This markdown file contains code and answers for "Reproducible Research" peer assesmnet - 1. For deatiled intrsuctions, please look at instructions.pdf lying in the "doc" folder.
- load the data
rm(list = ls())

# loading the data
data <- read.csv(unz(description = file.path(getwd(), "activity.zip"), filename = "activity.csv"),
header = TRUE, sep = ",")- Pre-processing the data
completedata <- data[complete.cases(data), ]
nadata <- data[!complete.cases(data), ]- Make a histogram of the total number of steps taken each day
- Calculate and report the mean and median total number of steps taken per day
For This part of the assignment we will work only with data which have no NAs. We then work out the total number of steps for each day, create the histogram of that set and calculate the mean and median. Since this functionality will be used later - we create a function.
calculate_histo_mean_meadian <- function(df) {
    sp <- split(df, as.factor(df$date))
    sapply(sp, function(x) {
        sum(x$steps)
    })

}

estimate1 <- calculate_histo_mean_meadian(completedata)
hist(estimate1, xlab = "Total no of steps taken each day", col = "blue")
mean1 = mean(estimate1)
median1 = median(estimate1)- Make a time series plot (i.e. type = "l") of the 5-minute interval (x-axis) and the average number of steps taken, averaged across all days (y-axis)
sp2 <- split(data, as.factor(data$interval))
avgsteps <- sapply(sp2, function(x) {
    mean(x$steps, na.rm = TRUE)
})
avgstepsdf <- data.frame(interval = names(avgsteps), avgsteps = avgsteps)

plot(names(avgsteps), avgsteps, type = "l", xlab = "5 minute interval", ylab = "average no of steps averaged across all days",
col = "blue")- Which 5-minute interval, on average across all the days in the dataset, contains the maximum number of steps?
idx <- names(avgsteps[which(avgsteps == max(avgsteps))])
idx
## [1] "835"
The 835, is the 5-minute interval, on average across all the days in the dataset, that contains the maximum number of steps
- Calculate and report the total number of missing values in the dataset We already calculated data with NA values in the pre-processing step.
Thus, the total number of rows with NAs is 2304
- Devise a strategy for filling in all of the missing values in the dataset.
The following strategy was used to fill all of the missing values in the dataset- We used the mean for that 5-minute interval
Since all the NA's are in the steps column , we can replace it with means for the corresponding 5-minute interval using the following code:
nadata$steps <- apply(nadata, 1, function(x) {
    int <- as.numeric(x["interval"])
    avgstepsdf[match(int, avgstepsdf$interval), "avgsteps"]
})- create a new dataset with filled in values.
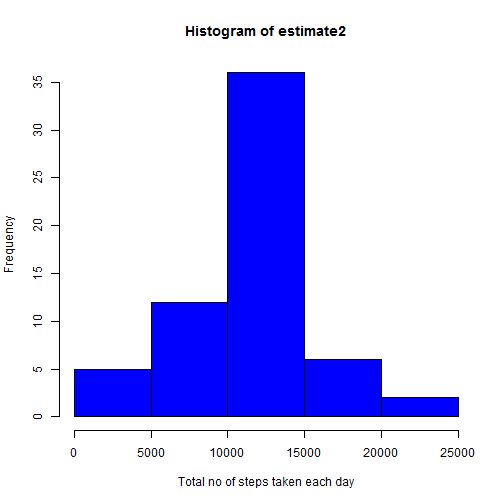
filleddata <- rbind(completedata, nadata)- Make a histogram of the total number of steps taken each day ,Calculate and report the mean and median total number of steps taken per day.
estimate2 <- calculate_histo_mean_meadian(filleddata)
hist(estimate2, xlab = "Total no of steps taken each day", col = "blue")
mean2 = mean(estimate2)
median2 = median(estimate2)- difference between estimates.
Yes, there is a difference between estinates taken at different points:
plot(density(estimate2), col = "red", xlab = "Total no of steps taken each day",
    ylab = "Frequency", main = "Comaprison of data without NA and data with\n      NA vlaues filled up")
lines(density(estimate1), col = "blue")
legend("topright", legend = c("w/o NA values", "filled values"), lty = 1, col = c("red",
    "blue"), bty = "n")
data with complete cases had median 10395 and mean 9354.2295
data with filled up NA values had median 1.0766 × 10⁴ and mean 1.0766 × 10⁴
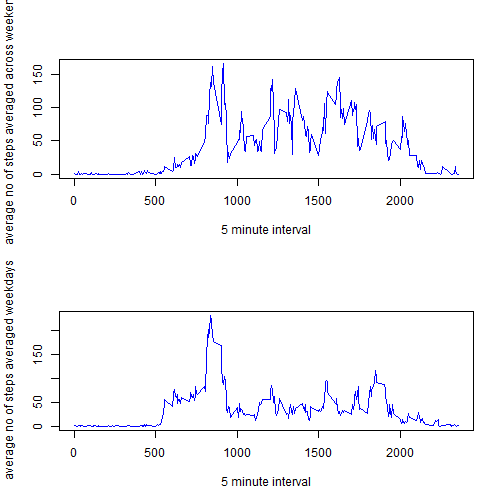
the variable weekst is coded 1 for weekdays and 0 for weekends.
## find the weekday

filleddata$day <- weekdays(as.Date(filleddata$date))
filleddata$weekst <- sapply(filleddata$day, function(x) {
    ifelse(x == "Saturday" | x == "Sunday", 0, 1)
})
spweek <- split(filleddata, as.factor(filleddata$weekst))

sp2 <- split(spweek[[1]], as.factor(spweek[[1]]$interval))
weekend <- sapply(sp2, function(x) {
    mean(x$steps, na.rm = TRUE)
})

sp3 <- split(spweek[[2]], as.factor(spweek[[2]]$interval))
weekday <- sapply(sp3, function(x) {
    mean(x$steps, na.rm = TRUE)
})

par(mfrow = c(2, 1))
plot(names(weekend), weekend, type = "l", xlab = "5 minute interval", ylab = "average no of steps averaged across weekend",
    col = "blue")
plot(names(weekday), weekday, type = "l", xlab = "5 minute interval", ylab = "average no of steps averaged weekdays",
    col = "blue")


