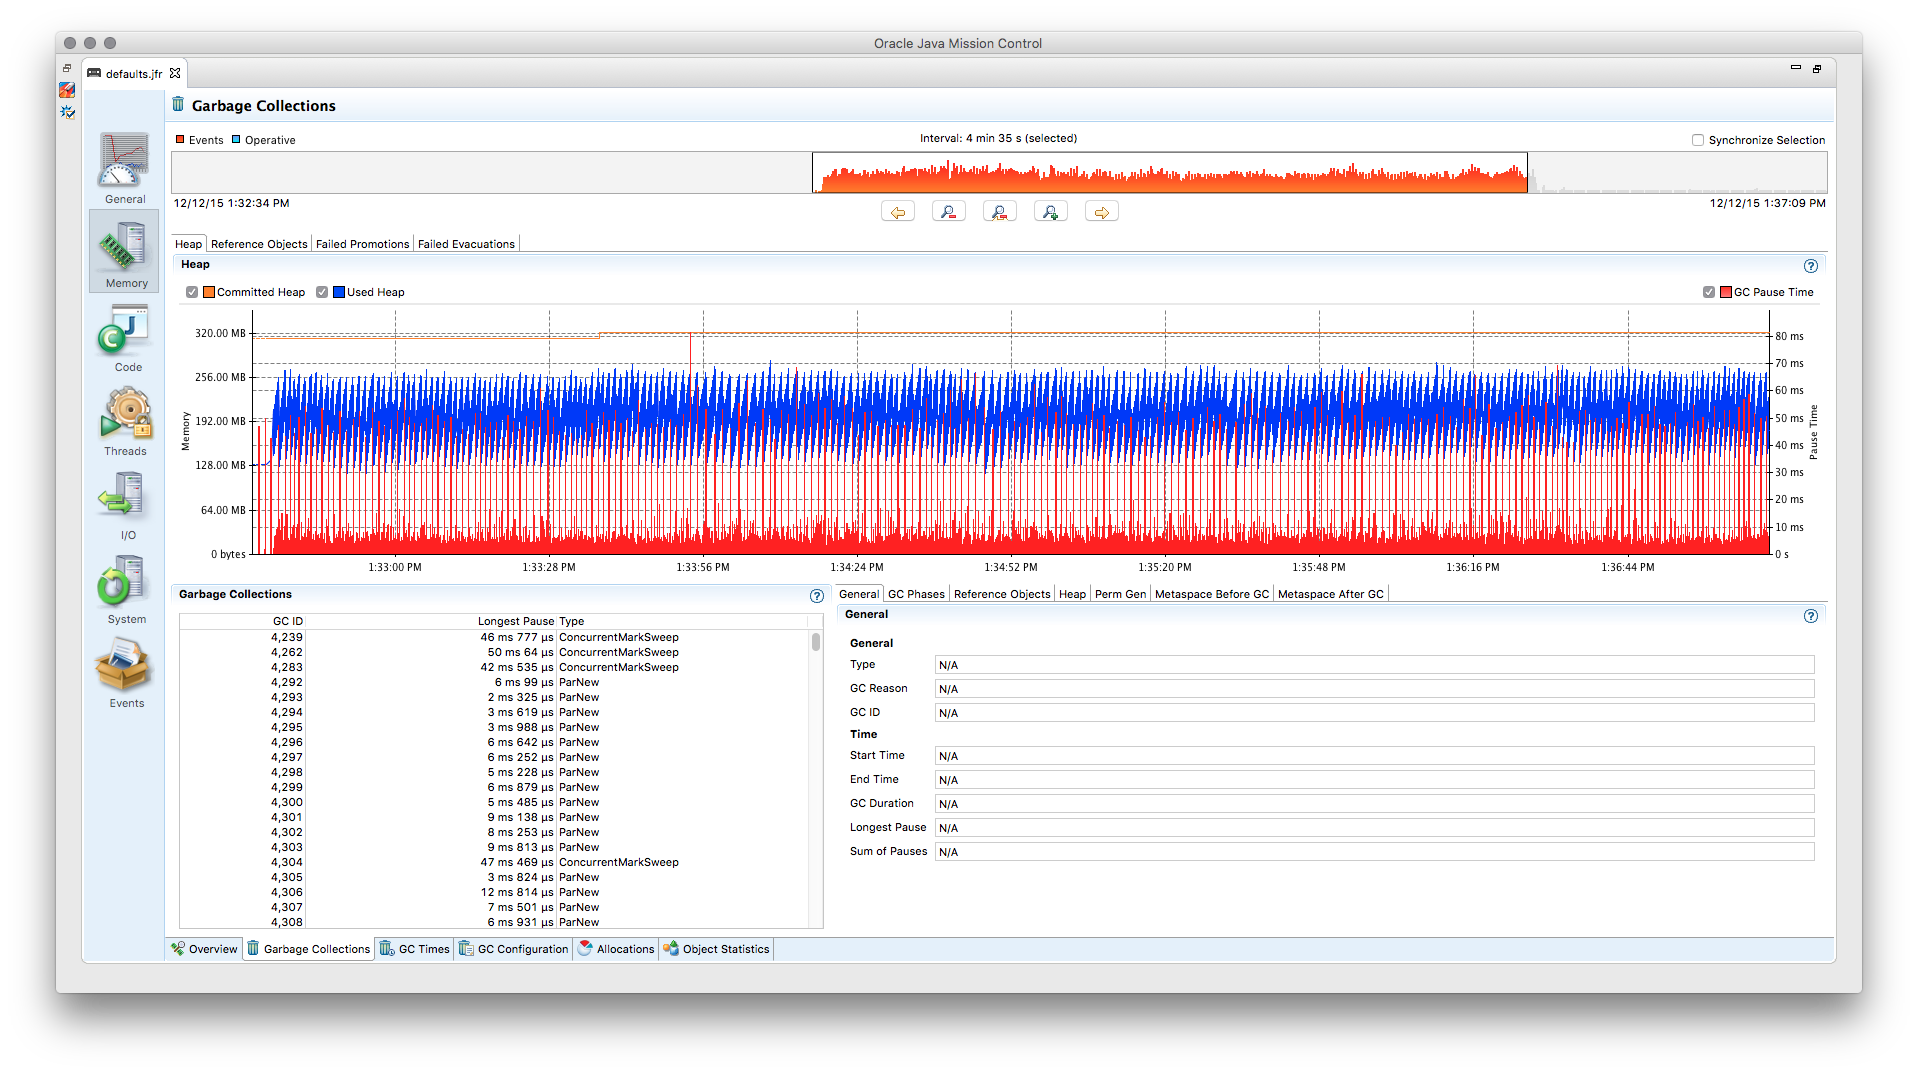
You probably want to gain additional insights from a race. Therefore, we have added telemetry devices to Rally. If you invoke
esrally list telemetry, it will show which telemetry devices are available:
dm@io:Projects/rally ‹master*›$ esrally list telemetry

    ____        ____
   / __ \____ _/ / /_  __
  / /_/ / __ `/ / / / / /
 / _, _/ /_/ / / / /_/ /
/_/ |_|\__,_/_/_/\__, /
                /____/


Available telemetry devices:

Command         Name                   Description
--------------  ---------------------  --------------------------------------------------------------------
jit             JIT Compiler Profiler  Enables JIT compiler logs.
gc              GC log                 Enables GC logs.
jfr             Flight Recorder        Enables Java Flight Recorder (requires an Oracle JDK or OpenJDK 11+)
node-stats      Node Stats             Regularly samples node stats
recovery-stats  Recovery Stats         Regularly samples shard recovery stats
ccr-stats       CCR Stats              Regularly samples Cross Cluster Replication (CCR) related stats

Keep in mind that each telemetry device may incur a runtime overhead which can skew results.
You can attach one or more of these telemetry devices to the benchmarked cluster. Except for node-stats, this only works if Rally provisions the cluster (i.e. it does not work with --pipeline=benchmark-only).
The jfr telemetry device enables the Java Flight Recorder on the benchmark candidate. Up to JDK 11, Java flight recorder ships only with Oracle JDK, so Rally assumes that Oracle JDK is used for benchmarking. If you run benchmarks on JDK 11 or later, Java flight recorder is also available on OpenJDK.
To enable jfr, invoke Rally with esrally --telemetry jfr. jfr will then write a flight recording file which can be opened in Java Mission Control. Rally prints the location of the flight recording file on the command line.
Supported telemetry parameters:
recording-template: The name of a custom flight recording template. It is up to you to correctly install these recording templates on each target machine. If none is specified, the default recording template of Java flight recorder is used.
Note
Up to JDK 11 Java flight recorder ship only with Oracle JDK and the licensing terms do not allow you to run it in production environments without a valid license (for details, refer to the Oracle Java SE Advanced & Suite Products page). However, running in a QA environment is fine.
The jit telemetry device enables JIT compiler logs for the benchmark candidate. If the HotSpot disassembler library is available, the logs will also contain the disassembled JIT compiler output which can be used for low-level analysis. We recommend to use JITWatch for analysis.
hsdis can be built for JDK 8 on Linux with (based on a description by Alex Blewitt):
curl -O -O -O -O https://raw.githubusercontent.com/dmlloyd/openjdk/jdk8u/jdk8u/hotspot/src/share/tools/hsdis/{hsdis.c,hsdis.h,Makefile,README}
mkdir -p build/binutils
curl http://ftp.gnu.org/gnu/binutils/binutils-2.27.tar.gz | tar --strip-components=1 -C build/binutils -z -x -f -
make BINUTILS=build/binutils ARCH=amd64
After it has been built, the binary needs to be copied to the JDK directory (see README of hsdis for details).
The gc telemetry device enables GC logs for the benchmark candidate. You can use tools like GCViewer to analyze the GC logs.
Warning
Using this telemetry device will skew your results because the node-stats API triggers additional refreshes. Additionally a lot of metrics get recorded impacting the measurement results even further.
The node-stats telemetry device regularly calls the cluster node-stats API and records metrics from the following sections:
- Indices stats (key
indicesin the node-stats API) - Thread pool stats (key
jvm.thread_poolin the node-stats API) - JVM buffer pool stats (key
jvm.buffer_poolsin the node-stats API) - JVM gc stats (key
jvm.gcin the node-stats API) - JVM mem stats (key
jvm.memin the node-stats API) - Circuit breaker stats (key
breakersin the node-stats API) - Network-related stats (key
transportin the node-stats API) - Process cpu stats (key
process.cpuin the node-stats API)
Supported telemetry parameters:
node-stats-sample-interval(default: 1): A positive number greater than zero denoting the sampling interval in seconds.node-stats-include-indices(default:false): A boolean indicating whether indices stats should be included.node-stats-include-indices-metrics(default:docs,store,indexing,search,merges,query_cache,fielddata,segments,translog,request_cache): A comma-separated string specifying the Indices stats metrics to include. This is useful, for example, to restrict the collected Indices stats metrics. Specifying this parameter implicitly enables collection of Indices stats, so you don't also need to specifynode-stats-include-indices: true.Example:
--telemetry-params="node-stats-include-indices-metrics:'docs'"will only collect thedocsmetrics from Indices stats. If you want to use multiple fields, pass a JSON file totelemetry-params(see the :ref:`command line reference <clr_telemetry_params>` for details).node-stats-include-thread-pools(default:true): A boolean indicating whether thread pool stats should be included.node-stats-include-buffer-pools(default:true): A boolean indicating whether buffer pool stats should be included.node-stats-include-breakers(default:true): A boolean indicating whether circuit breaker stats should be included.node-stats-include-gc(default:true): A boolean indicating whether JVM gc stats should be included.node-stats-include-mem(default:true): A boolean indicating whether JVM heap stats should be included.node-stats-include-network(default:true): A boolean indicating whether network-related stats should be included.node-stats-include-process(default:true): A boolean indicating whether process cpu stats should be included.
The recovery-stats telemetry device regularly calls the indices recovery API and records one metrics document per shard.
Supported telemetry parameters:
recovery-stats-indices(default: all indices): An index pattern for which recovery stats should be checked.recovery-stats-sample-interval(default 1): A positive number greater than zero denoting the sampling interval in seconds.
The ccr-stats telemetry device regularly calls the cross-cluster replication stats API and records one metrics document per shard.
Supported telemetry parameters:
ccr-stats-indices(default: all indices): An index pattern for which ccr stats should be checked.ccr-stats-sample-interval(default 1): A positive number greater than zero denoting the sampling interval in seconds.
