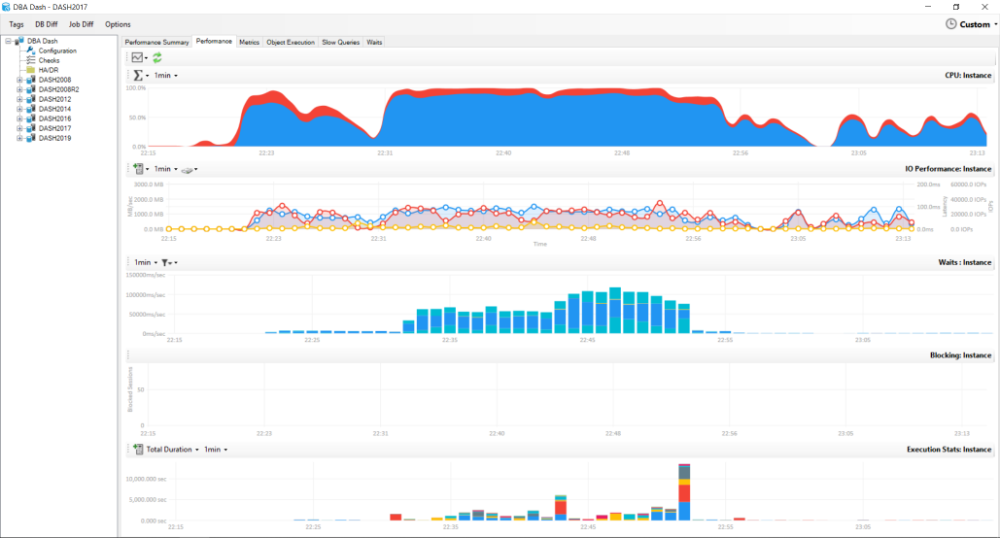
DBA Dash is a tool for SQL Server DBAs to assist with daily checks, performance monitoring and change tracking.
- Backups Agent Jobs, DBCC, Corruption, Drive space
- Availability Groups, Log Shipping, Mirroring
- OS Performance Counters + Custom Metrics
- Stored Procedure/Function/Trigger execution stats
- Capture slow queries (Extended Event trace)
- Azure DB monitoring
- Track changes to configuration, SQL Patching, drivers etc.
- Schema change tracking.
- Agent Job change tracking
- Option to monitor instances in isolated environments via S3 bucket.
- Custom Checks
What DBA Dash collects and when
- SQL Server 2016 SP1 or later required for DBADashDB repository database. RDS & Azure DB is supported.
- SQL 2008-SQL 2019 supported for monitored instances - including Azure and RDS (SQL Server).
- Windows machine to run agent. Agent can monitor multiple SQL instances.
- Account to use for agent. Review the security doc for required permissions.
Note: It's possible to run as a console app under your own user account for testing purposes.
- Extract the application binaries on the server where you want to run the agent. Run on a server separate to your production SQL instance if possible.
- The first thing we need to do is create the database that will be used as the central repository for your SQL instances. Run the DBADashServiceConfigTool.exe tool. Click the "Deploy/Update Database" button.
- A connection dialog is shown - use this to connect to the SQL Instance that you want to deploy the central repository database to.
- The DB Deploy dialog is shown. The default database name is DBADashDB - click deploy to create the database.
- It might take a few moments to create the database. Click "OK" when you see the "Deploy succeeded" dialog.
- The next step is to add databases that we want to monitor. Click the "Source" tab.
- Click the button to the right of the "Source" textbox to connect to the SQL Instance you want to monitor. Alternatively, the connection string can be entered manually.
*Note: Connection strings are encrypted to avoid storing them in plain text but it is recommended to use Windows authentication - the encryption should be considered as obfuscation. * - Click "Add/Update" to add the connection. Repeat as necessary to add the other SQL Instances you want to monitor. Note: Additional options are available for your source connections. Capture slow queries, take schema snapshots and customize schedules.
- Click "Save". A "ServiceConfig.json" file is created in the application folder that stores the configuration details for this agent.
- At this stage you might want to run "DBADashService.exe". This runs the agent as a console application and you can monitor what the application is doing. On startup and every 1hr on the hour it will collect "General" information from your SQL instances. e.g. Backups, Drive space, Agent jobs etc. Every 1min it will collect performance data. e.g. CPU, IO, Waits etc. More info on what is collected and when here
- You will most likely want to install the agent as a Windows service. Close the DBADashService.exe application and go back to the DBADashServiceConfigTool.exe application. Click the service tab.
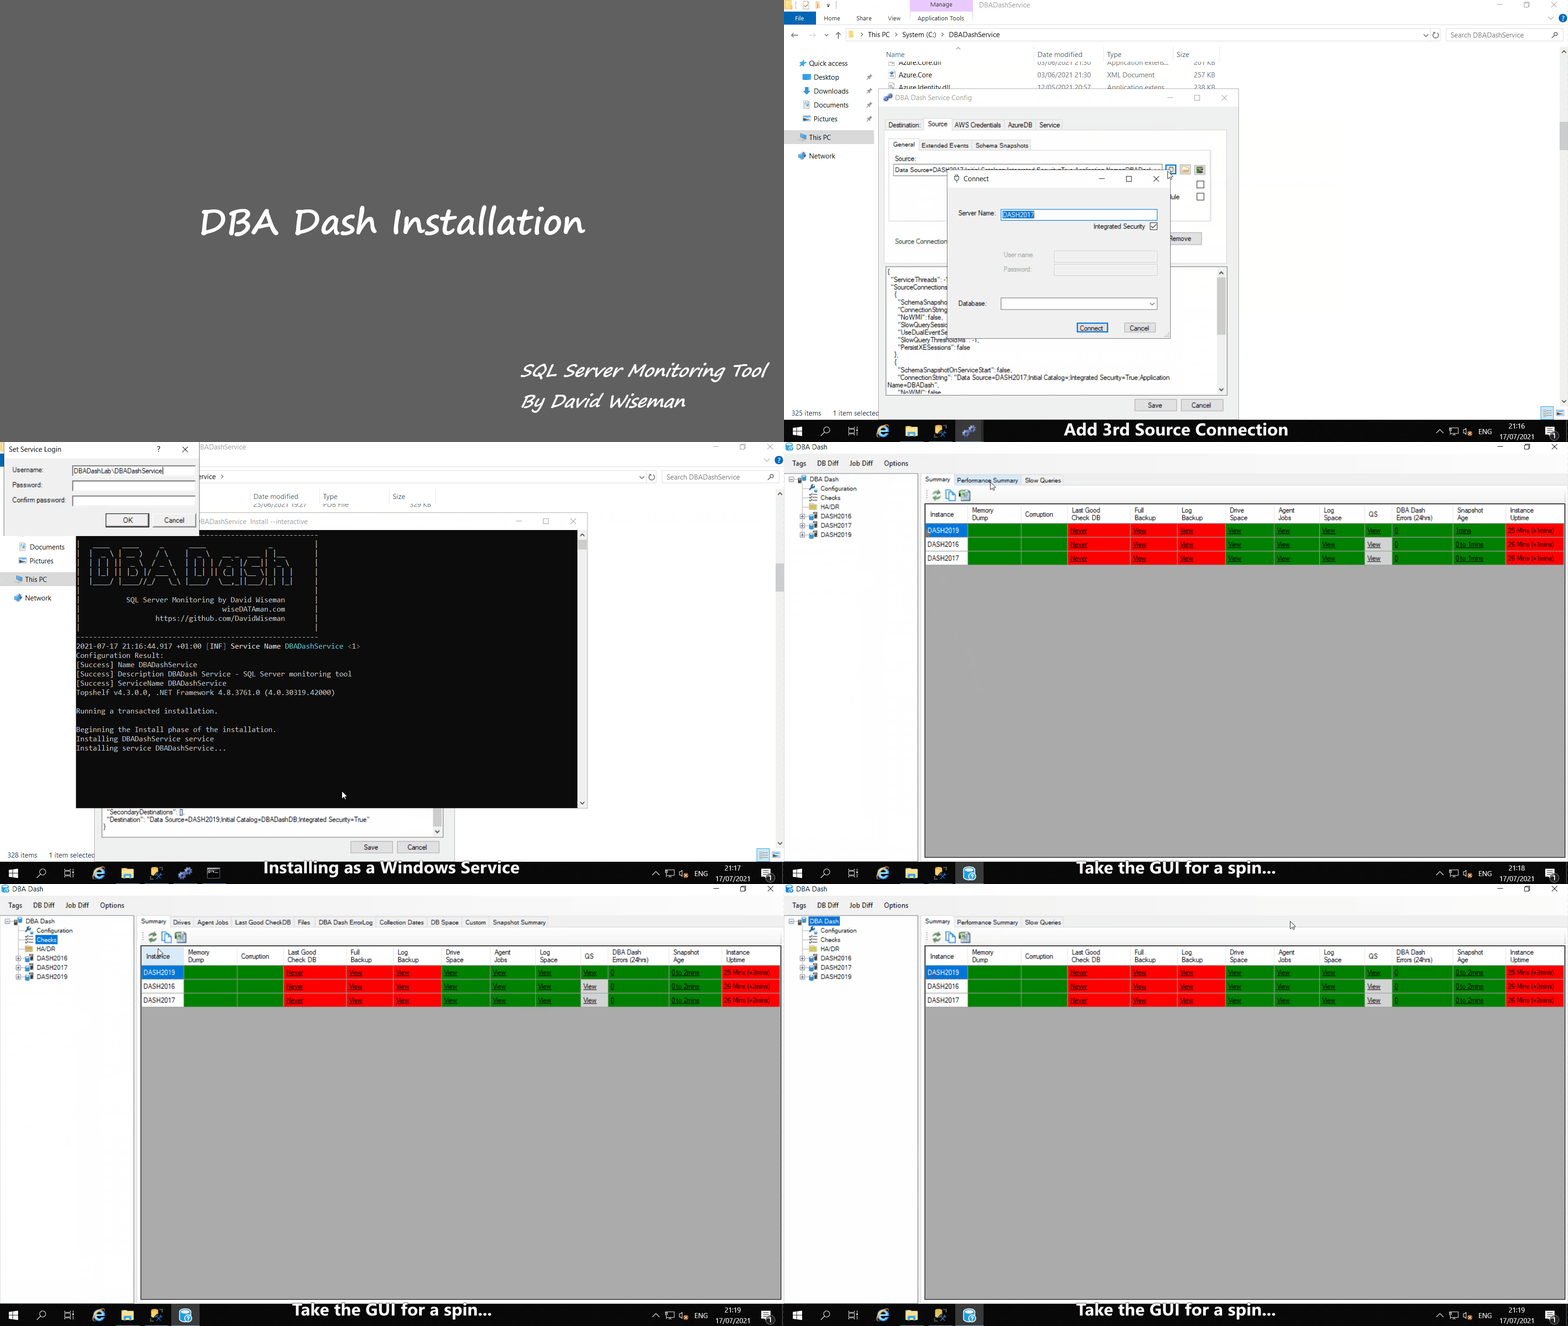
- Click "Install". Enter the credentials you want to use to run the service as and click "OK". The credentials should be entered in "domain\username" format.
- Close the command window.
- The service should now be installed and you can click the "Start" button to start the service.
- Installation is now complete. You can run the "DBADash.exe" application to get started using DBA Dash.
Note: More advanced service configuration is possible. e.g. A remote agent can be configured to write to a S3 bucket and another agent that connects to your repository database can use the S3 bucket as a source instead of a SQL connection string.
You can monitor Azure SQL Server databases with DBA Dash and the application includes some Azure specific dashboards that can help with performance/cost optimization. The process for adding azure DB connections is similar to normal SQL instances but each database is considered a separate instance that we need a connection to. You can manually add the connections for each database you want to monitor. Alternatively you can just a connection to the master dastabase.
If you have a connection to the master database, there are some options you can use on the "AzureDB" tab to add your other database connections:
- Check the "Scan for AzureDBs on service start" option. As the name suggests database connections will be added from the master connnection on service start.
- Check the "scan for new Azure DBs every 'x' seconds" option. This is useful to pick up new AzureDBs. Also if for some reason it fails to get the connections to your user databases on service start it would re-detect them on this interval.
- Click the "Scan Now" option. Use this option to add the individual database connections to the config file.
Any database connections created from master will inherit the settings from the master connection for slow query capture etc.
Amazon RDS (SQL Server only) can be used for source connections and for the repository database.
- Stop the DBA Dash agent. Use
net stop dbadashservicefrom the commandline or use the DBADashServiceConfigTool.exe tool (Service Tab) to stop the service. - Close any running instances of the GUI or DBA Dash Service Config tool.
- Replace all the app binaries with the ones from the new release (copy/paste). All the configuration information for the agent is stored in the ServiceConfig.json file so this file must be kept. You might want to keep backups of this file - particually before making configuration changes or installing new versions.
- If the "auto upgrade repository DB on service start" option is enabled you can run
net start dbadashserviceto complete the installation. Any database schema changes will be deployed automatically when the service starts.
** Alternatively: **
- Run DBADashServiceConfigTool.exe. On the destination tab you should be notified if there are database schema changes that need to be deployed. If necessary click Deploy/Update Database. Either click the "Deploy" button to apply the schema changes or click "Generate Script" if you want to review the changes/deploy manually. Note: The script must be run in sqlcmd mode. Ensure you have a backup prior to deploying changes.
- Click the service tab and click "Start" to start the service.
Note: If you are running multiple agents you should stop all the agents then run the upgrade process for each agent. The schema changes for the DB would get deployed for the first agent only.
It's possible to monitor instances where there isn't direct connectivity between the instance and your monitoring server. The destination you set in the DBA Dash Service config tool can be a folder path or point to a AWS S3 bucket. You setup an agent in the remote environment to push data to the S3 Bucket location. You then use that same location as a source connection on an agent where the destination is pointing to your DBADashDB central repository database. The "AWS Credentials" tab can be used to specify credentials if required.
If you chose to use a local folder instead of an S3 bucket then you would need to find a way to move files from that folder to a folder that can be accessed by the other agent connecting to your DBDashDB database. An S3 bucket is the easiest option but you could use a local folder and sync via a different cloud storage provider.

