Debugging a python application running on kubernetes with Pycharm (with breakpoints and the whole shebang)
One of the pains of running a containerized application on kubernetes is the inability to debug it with a normal IDE. With Python, there are nice solutions for remote debugging such as remote-pdb but it would never be as convenient as debugging your application with a real IDE.
Although Intellij did an amazing job with guidance and support for remote debugging, their solutions are incompatible with a remote runtime that is unfamiliar with the development environment, or in simpler terms - in order for remote debugging to work, the runtime (python process) needs to have network access to the IDE(your workstation).
Under the hood Pycharm uses a debugger based on pydevd - which only supports connecting from the runtime as a client and not listening to incoming connections inside the runtime as a server.
A naive solution to this problem can be coupling a sidecar running sshd with your deployment, and running a reverse SSH client tunnel . It would probably work - but in order to make it transparent one will need to inject the sidecar with one's public key, then run the SSH client and keep the tunnel open... seems like a lot of work.
Another alternative is using telepresence to actually run the service locally, but that would mean one would need to build/install dependencies locally - which sometimes mean a lot of time and work and without even mentioning the CPU and memory that our app will consume.
Ktunnel is a CLI that establishes a reverse tunnel from kubernetes and exposes your workstation to traffic from kubernetes, this means one can expose one's workstation to a kubernetes pod, or even as a service. for our use case - it means one can tell a pod running our python app to connect to localhost on the debug port, when actually behind the scenes a tunnel will be established to the IDE which is listening on that port on my workstation. pretty neat!
As an example I created a simple flask web server with two endpoints:
/- will return a random number/debug- will run
When the /debug endpoint is called, the runtime should attempt to connect to the debugger and block until it succeeds.
The code along with the kubernetes manifests can be found here
> kubectl apply -f deployment.yaml
deployment.extensions/pyremotedebug created
let's also port-forward to the web server and send a request:
> kubectl port-forward pyremotedebug-5dcf9cf4c6-q9tr9 8000
Forwarding from [::1]:8000 -> 8000

> curl localhost:8000
Handling connection for 8000
Hello, Ktunnel! random number: 409- Open pycharm, open the project (
File->open->"project directory"). - Put some breakpoints in the
main.pyfile
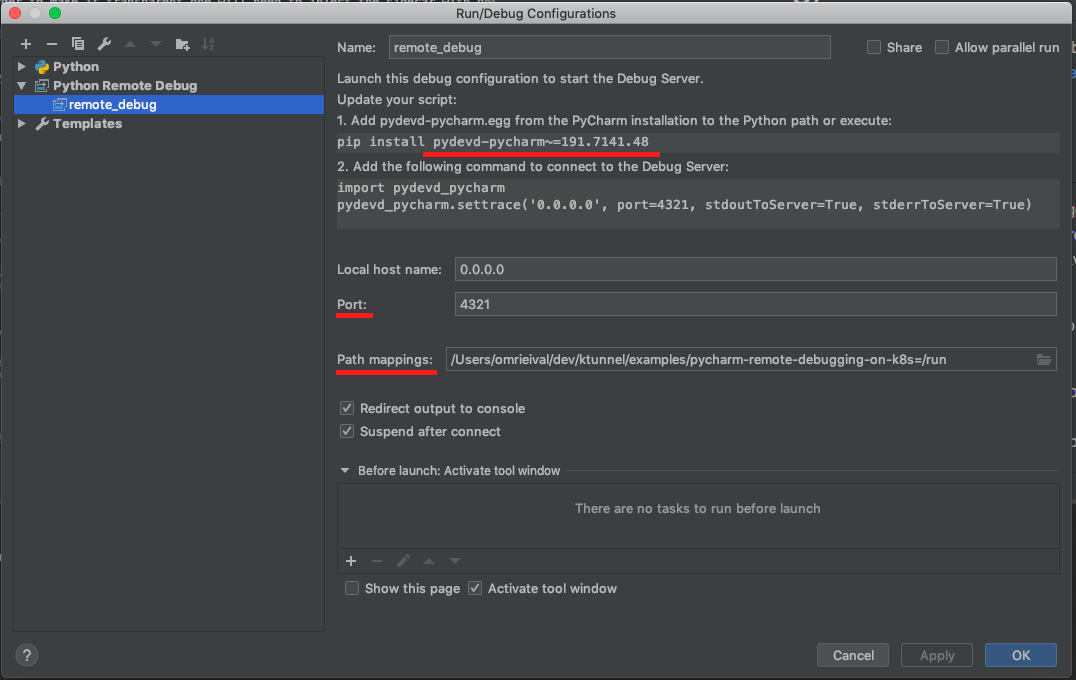
- Configure a remote debugger according to these instructions. use local host name 'localhost' and port 4321. Important note! use 'Path Mapping' to map your local project directory to the source Workdir in the container image

- Start the debugger (
Run->debug remote_server)
> ./ktunnel inject deployment pyremotedebug 4321
INFO[0000] Debug level is set to info
INFO[0000] Injecting tunnel sidecar to default/pyremotedebug
INFO[0000] Waiting for deployment to be ready
INFO[0011] All pods located for port-forwarding
INFO[0011] Waiting for port forward to finish
INFO[0011] Forwarding from 127.0.0.1:28688 -> 28688
Forwarding from [::1]:28688 -> 28688
INFO[0011] starting tcp tunnel from source 4321 to target 4321> curl localhost:8000/debugLooking at the container log you will see the following line:
INFO:root:Connecting to remote debugger on 127.0.0.1:4321
This means that the debugger is now connected to the runtime
Now, sending a request to the root endpoint will trigger the breakpoint in the IDE:
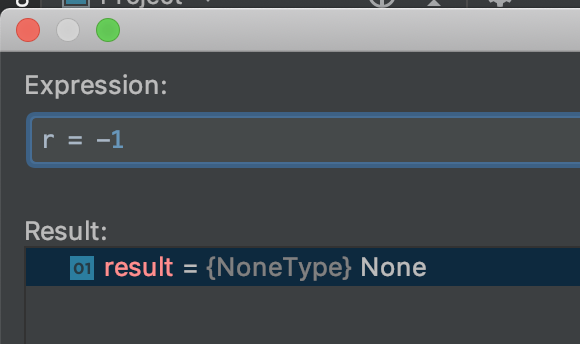
> curl -v localhost:8000/We can change the value of r in the Evaluate Expression window to -1, and the result in our terminal:

> curl -v localhost:8000/
*   Trying 127.0.0.1...
* TCP_NODELAY set
* Connected to localhost (127.0.0.1) port 8000 (#0)
> GET / HTTP/1.1
> Host: localhost:8000
> User-Agent: curl/7.54.0
> Accept: */*
>
* HTTP 1.0, assume close after body
< HTTP/1.0 200 OK
< Content-Type: text/html; charset=utf-8
< Content-Length: 33
< Server: Werkzeug/0.16.0 Python/3.7.6
< Date: Wed, 25 Dec 2019 06:15:53 GMT
<
* Closing connection 0
Hello, Ktunnel! random number: -1- For this to work with your Pycharm installation, the container needs to have a compatible 'pydevd-pycharm' version, in my case it's
pydevd-pycharm~=191.7141.48 - If you plan on doing this on production services, know that setting breakpoints on production services is not recommended, do at your own risk!