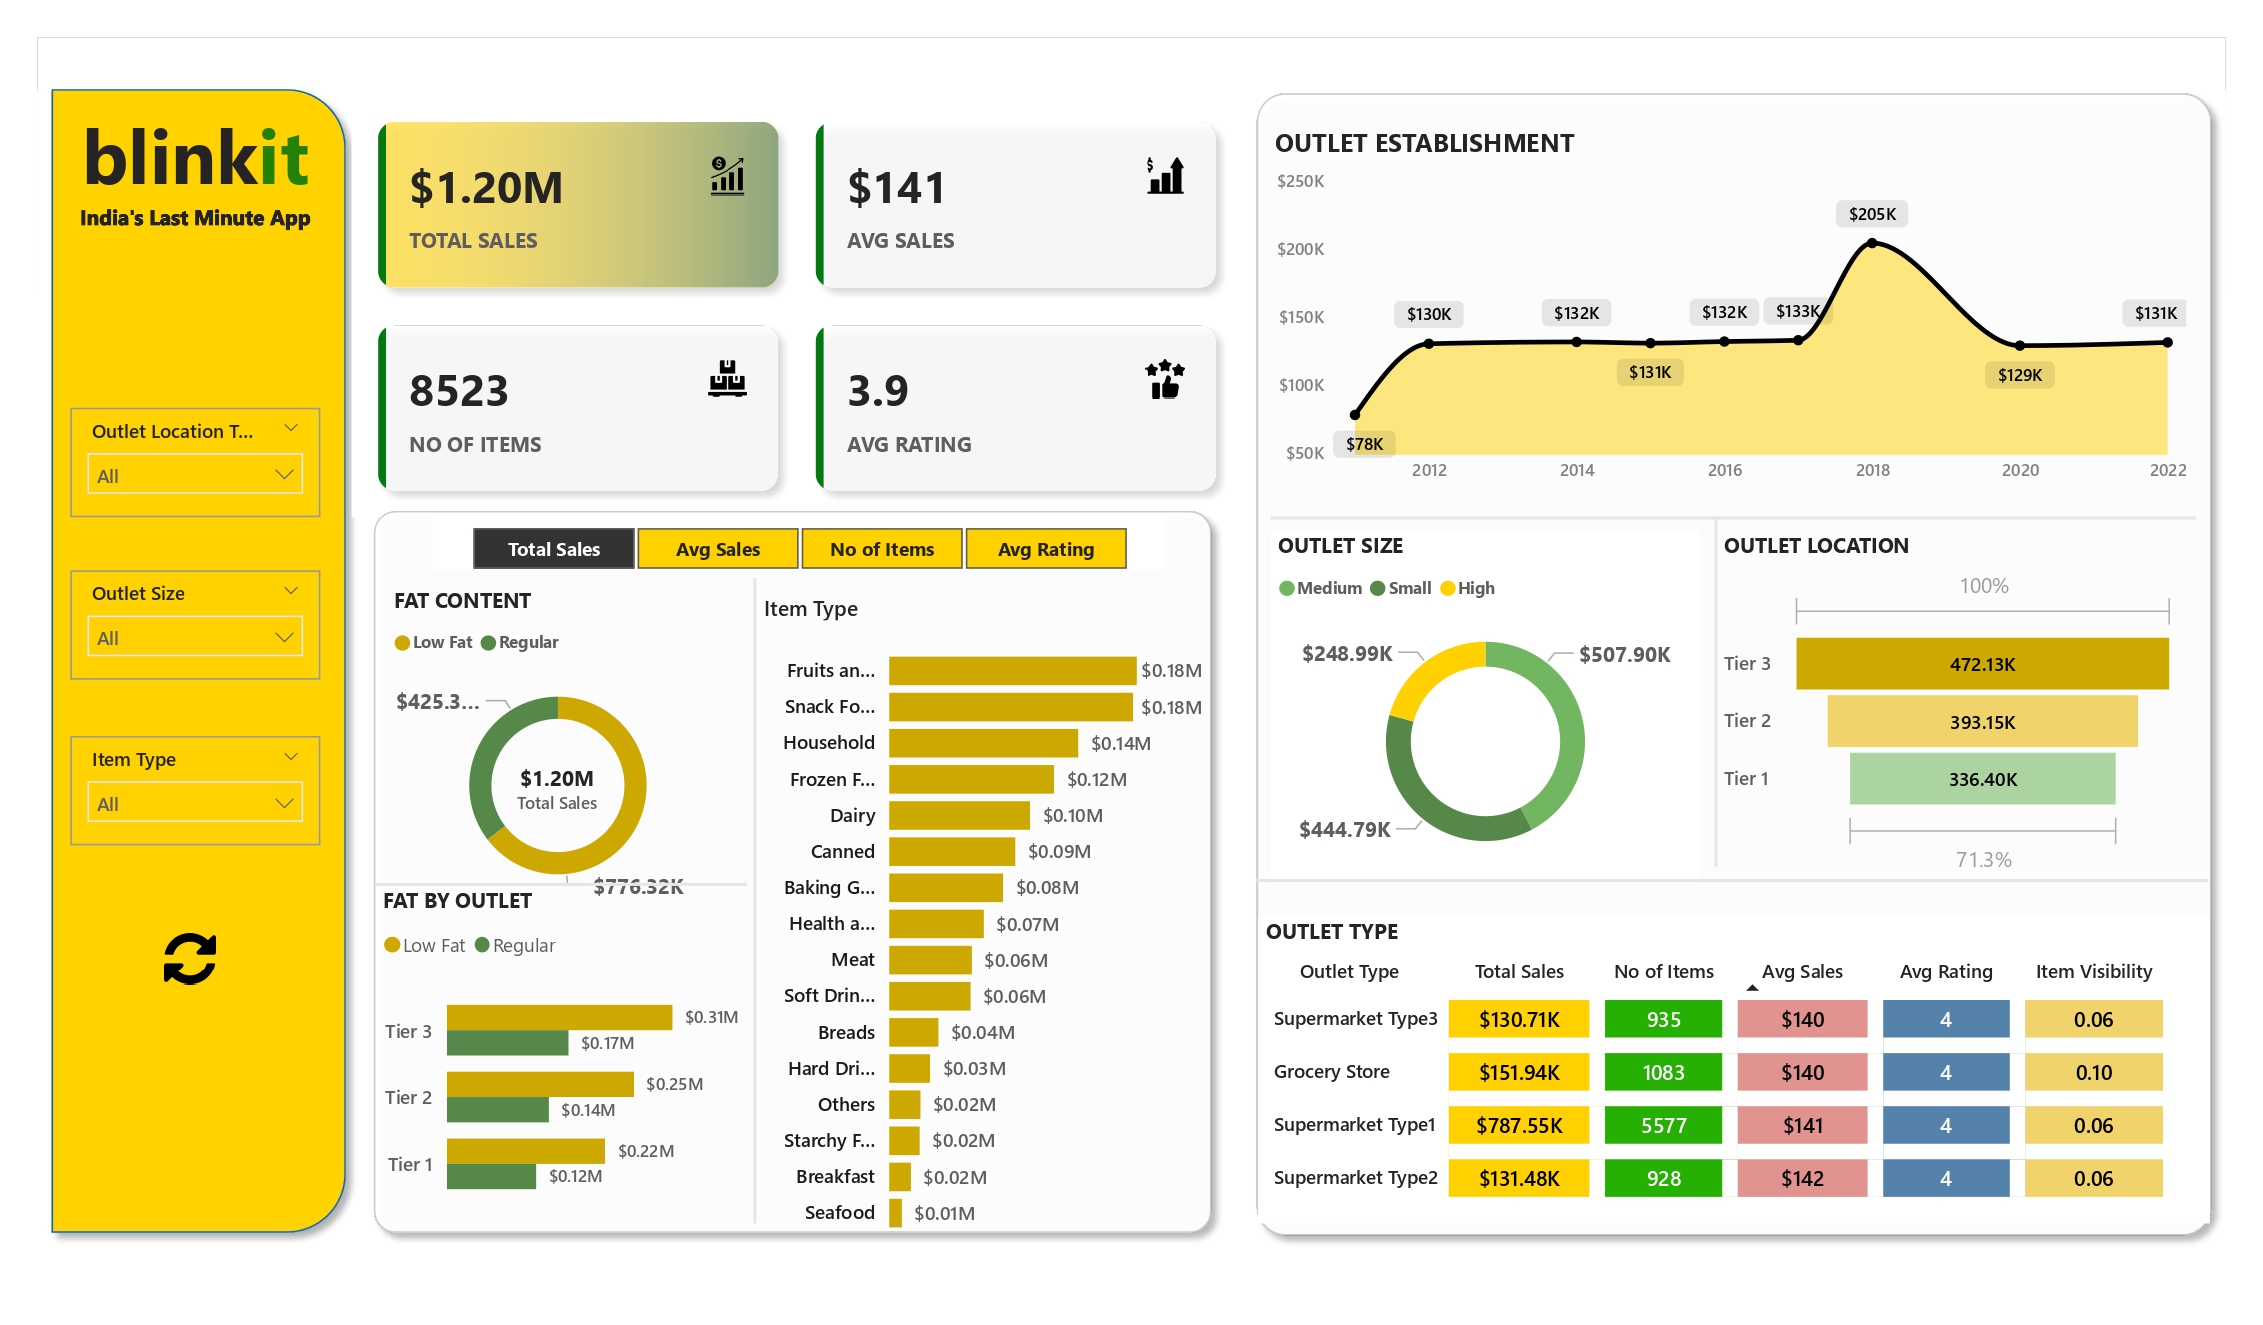
This project focuses on analyzing Blinkit's sales data using Power BI. The analysis aims to uncover key insights and trends within the sales data, helping to better understand customer behavior, product performance, and overall sales dynamics. The interactive dashboards created in Power BI provide a detailed exploration of the sales metrics, enabling informed decision-making.
The dataset used for this analysis includes sales data from Blinkit, with various attributes such as:
- Order ID
- Product Name
- Category
- Sales Amount
- Quantity Sold
- Order Date
- Customer ID
- Location
- Payment Method
The primary objectives of this project are:
- Sales Performance: Evaluate overall sales performance, including total revenue and number of orders.
- Product Analysis: Identify top-performing products and categories based on sales volume and revenue.
- Customer Insights: Analyze customer demographics and purchasing patterns to understand the customer base better.
- Sales Trends: Explore sales trends over time, including seasonal patterns and daily/weekly variations.
- Geographical Analysis: Understand sales distribution across different locations.
The following dashboards were developed to visualize and analyze the data:
- Sales Overview Dashboard: Provides a high-level summary of sales, including total revenue, number of orders, and average order value.
- Product Performance Dashboard: Breaks down sales by product and category, highlighting top-selling items and categories.
- Customer Analysis Dashboard: Analyzes customer behavior, including repeat purchases, average order size, and demographic insights.
- Sales Trends Dashboard: Visualizes sales trends over time, showing daily, weekly, and monthly sales patterns.
- Geographical Sales Dashboard: Maps out sales by location, identifying top-performing regions and potential areas for growth.
- Power BI: For data visualization and dashboard creation.
- SQL/Python (Optional): For data preprocessing and cleaning (if applicable).
- Clone this repository to your local machine.
git clone https://github.com/utkarsh-us/blinkit-sales-analysis-powerbi.git
- Open the
.pbixfile in Power BI Desktop. - Explore the different dashboards to gain insights into Blinkit's sales data.
- Modify the dataset or visualizations as needed.
The Blinkit Sales Analysis project offers a comprehensive view of the company's sales performance, enabling stakeholders to make data-driven decisions. The interactive dashboards provide valuable insights into customer behavior, product performance, and sales trends, helping to identify opportunities for growth and improvement.
This project is licensed under the MIT License - see the LICENSE file for details.
- Data sourced from Blinkit (or a simulated dataset if applicable).
- Special thanks to the Power BI community for support and resources.
