The Console plugin provides a UI to interact with the REST API of Elasticsearch. Console has two main areas: the editor,
where you compose requests to Elasticsearch, and the response pane, which displays the responses to the request.
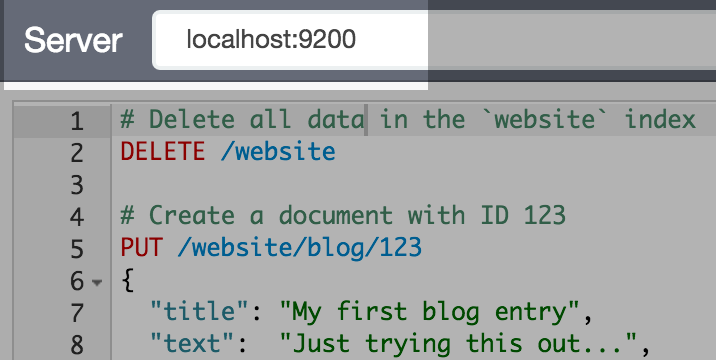
Enter the address of your Elasticsearch server in the text box on the top of screen. The default value of this address
is localhost:9200.
Console understands commands in a cURL-like syntax. For example the following Console command
GET /_search
{
  "query": {
    "match_all": {}
  }
}
is a simple GET request to Elasticsearch’s _search API. Here is the equivalent command in cURL.
curl -XGET "http://localhost:9200/_search" -d'
{
  "query": {
    "match_all": {}
  }
}'
In fact, you can paste the above command into Console and it will automatically be converted into the Console syntax.
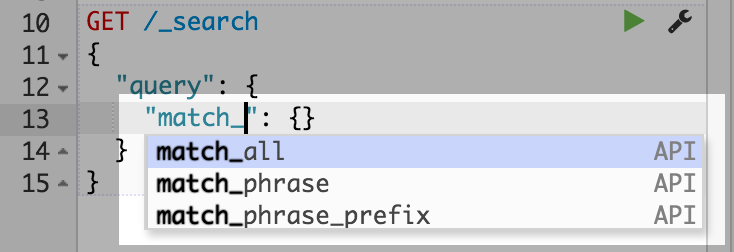
When typing a command, Console will make context sensitive suggestions. These suggestions can help you explore parameters for each API, or to just speed up typing. Console will suggest APIs, indexes and field names.
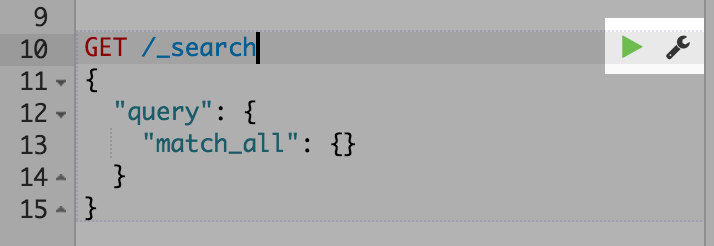
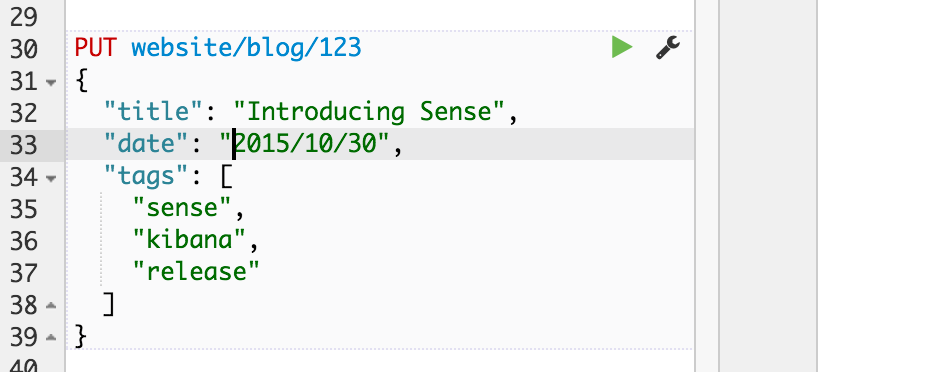
Once you have typed a command in to the left pane, you can submit it to Elasticsearch by clicking the little green triangle that appears next to the URL line of the request. Notice that as you move the cursor around, the little triangle and wrench icons follow you around. We call this the Action Menu. You can also select multiple requests and submit them all at once.
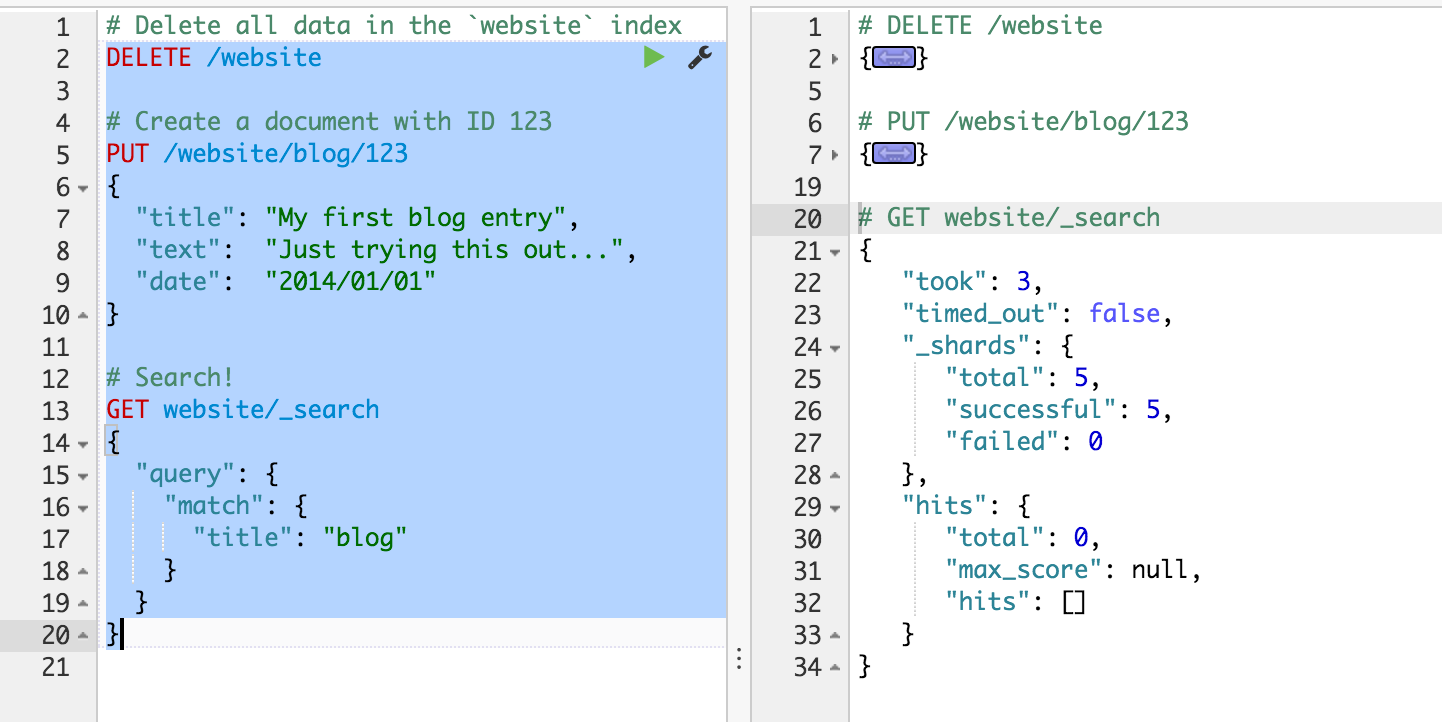
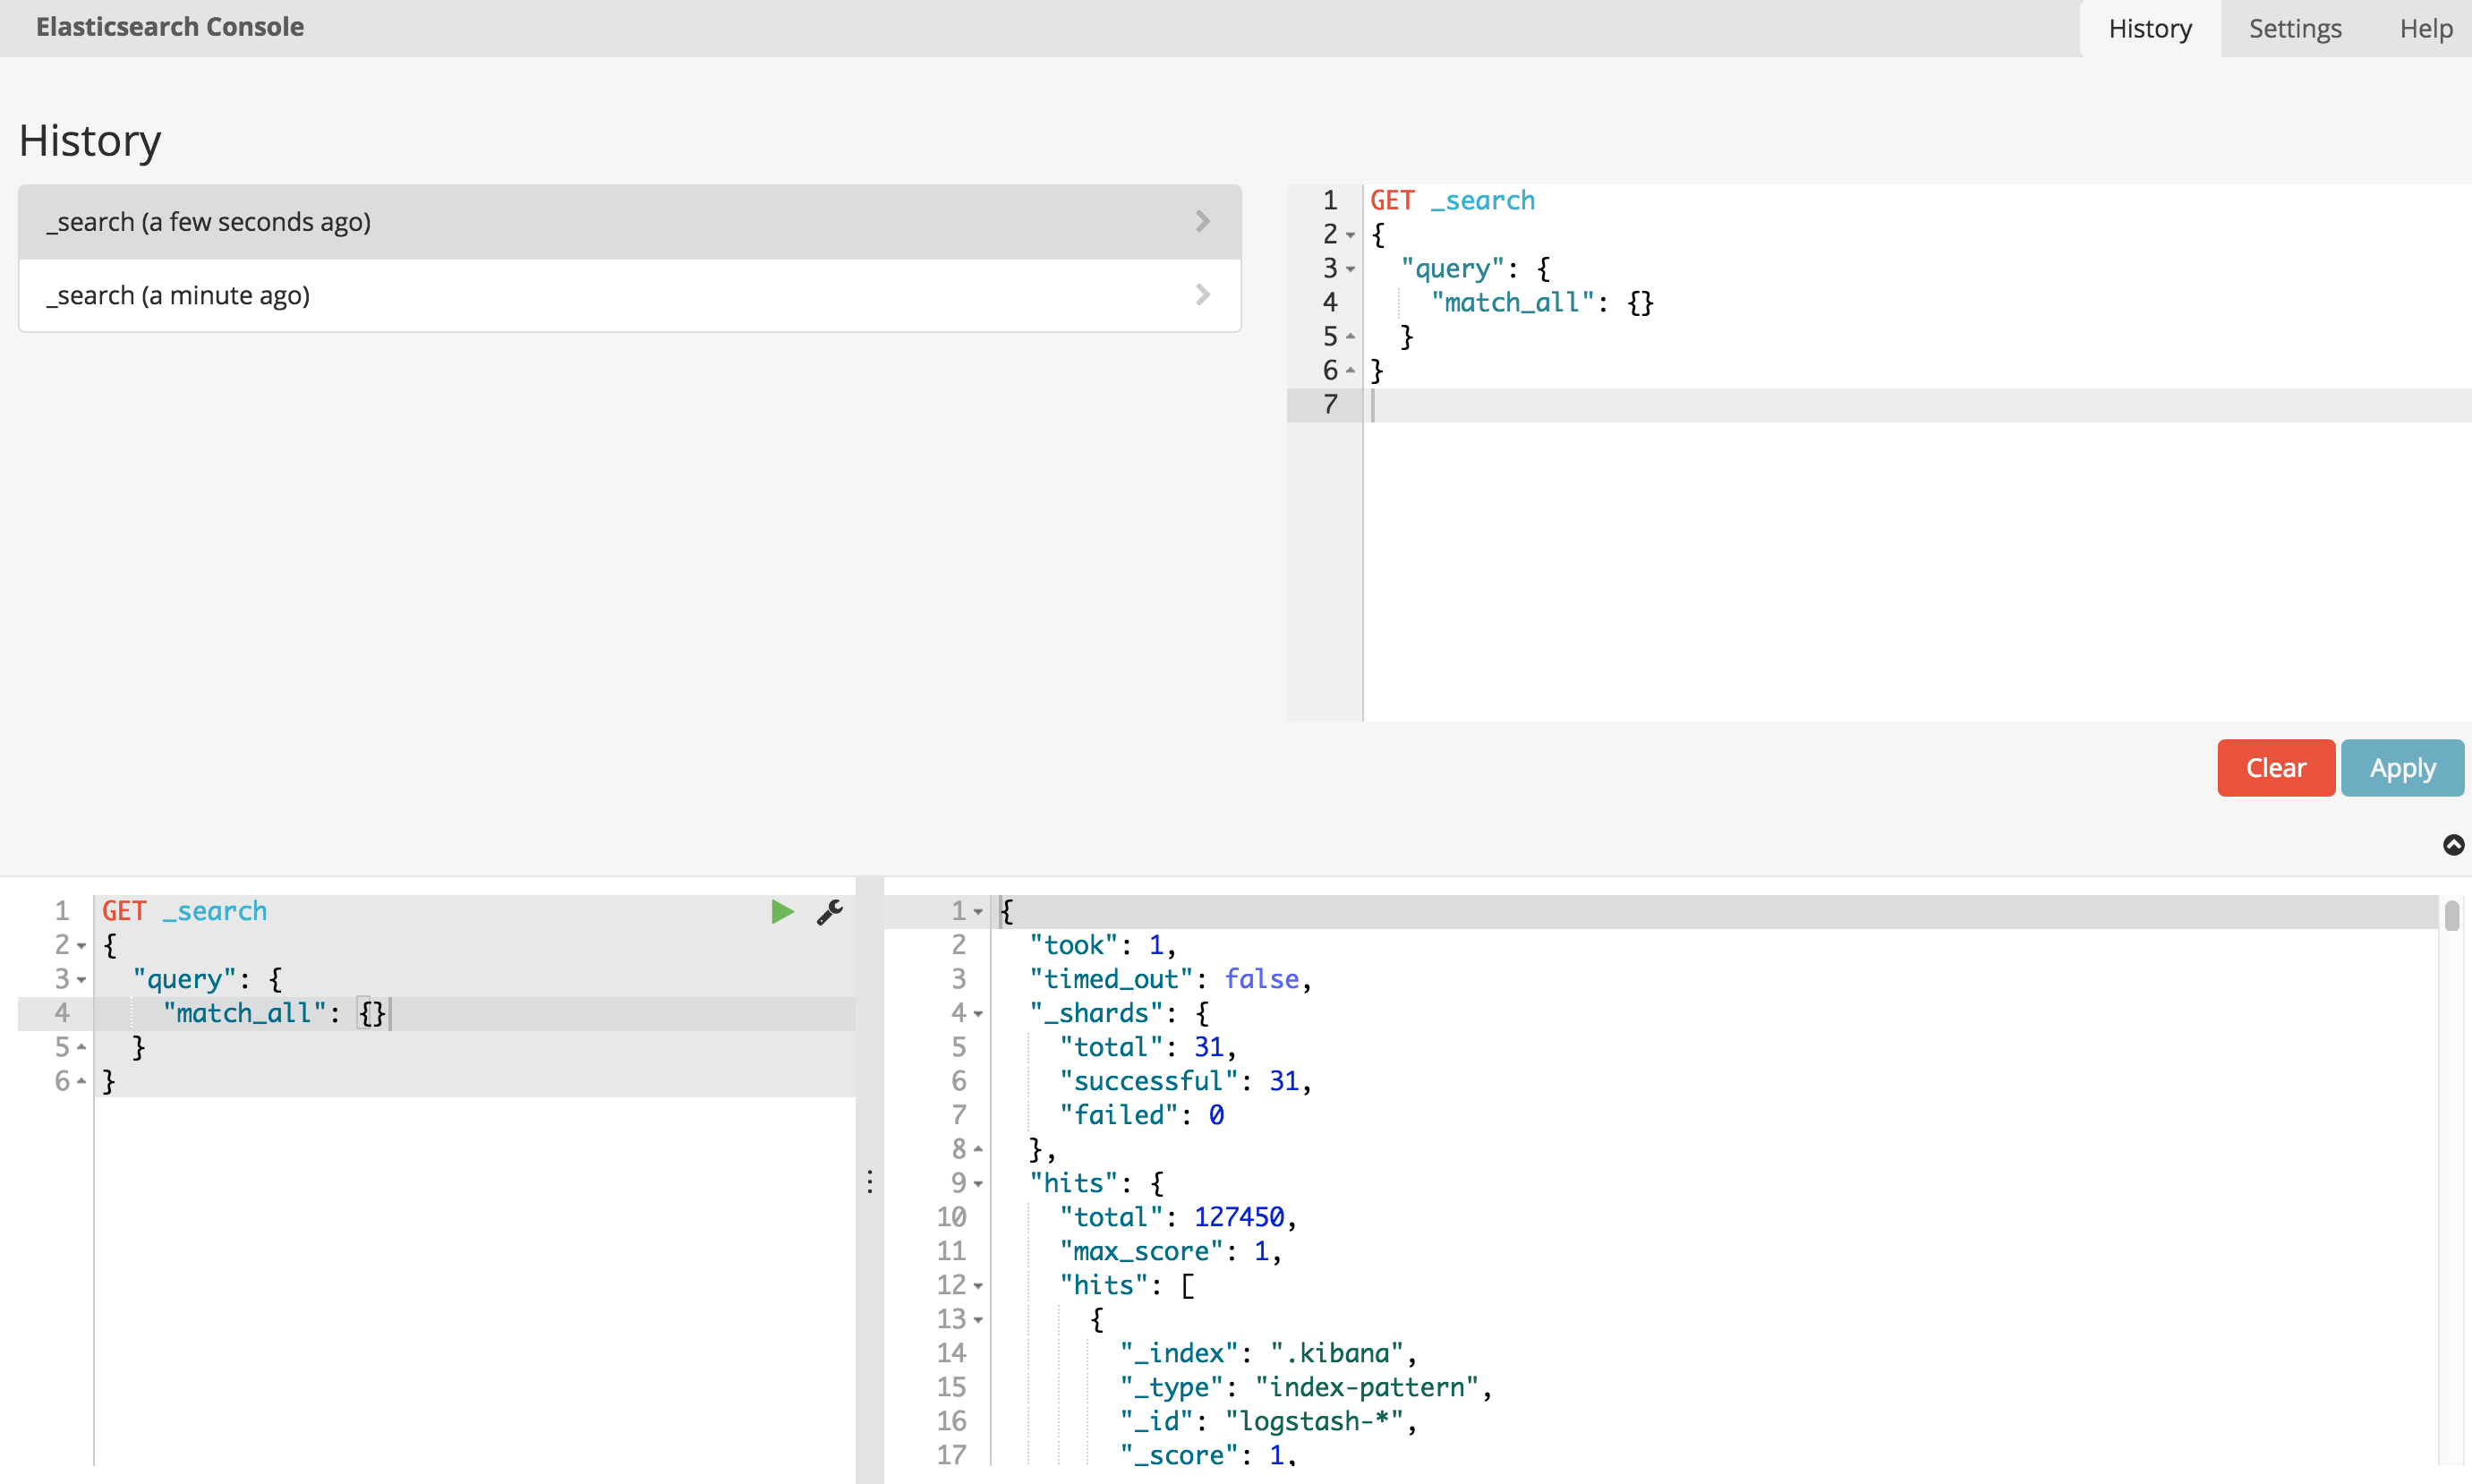
When the response come back, you should see it in the left hand panel:
Console allows you to easily switch between Elasticsearch instances. By default it will connect to localhost:9200
but you can easily change this by entering a different url in the Server input:
|
Note
|
Console is a development tool and is configured by default to run on a laptop. If you install it on a server please look at the Securing Console for instructions on how make it secure. |
In this section you will find a more detailed description of UI of Console. The basic aspects of the UI are explained in the Console for Kibana section.
The Console editor allows writing multiple requests below each other. As shown in the Console for Kibana section, you can submit a request to Elasticsearch by positioning the cursor and using the Action Menu. Similarly you can select multiple requests in one go:
Console will send the request one by one to Elasticsearch and show the output on the right pane as Elasticsearch responds. This is very handy when debugging an issue or trying query combinations in multiple scenarios.
Selecting multiple requests also allows you to auto format and copy them as cURL in one go.
Console allows you to auto format messy requests. To do so, position the cursor on the request you would like to format and select Auto Indent from the action menu:
Console will adjust the JSON body of the request and it will now look like this:
If you select Auto Indent on a request that is already perfectly formatted, Console will collapse the request body to a single line per document. This is very handy when working with Elasticsearch’s bulk APIs:
Console comes with a set of nifty keyboard shortcuts making working with it even more efficient. Here is an overview:
- Ctrl/Cmd + I
-
Auto indent current request.
- Ctrl + Space
-
Open Auto complete (even if not typing).
- Ctrl/Cmd + Enter
-
Submit request.
- Ctrl/Cmd + Up/Down
-
Jump to the previous/next request start or end.
- Ctrl/Cmd + Alt + L
-
Collapse/expand current scope.
- Ctrl/Cmd + Option + 0
-
Collapse all scopes but the current one. Expand by adding a shift.
Console maintains a list of the last 500 requests that were successfully executed by Elasticsearch. The history is available by clicking the clock icon on the top right side of the window. The icons opens the history panel where you can see the old requests. You can also select a request here and it will be added to the editor at the current cursor position.
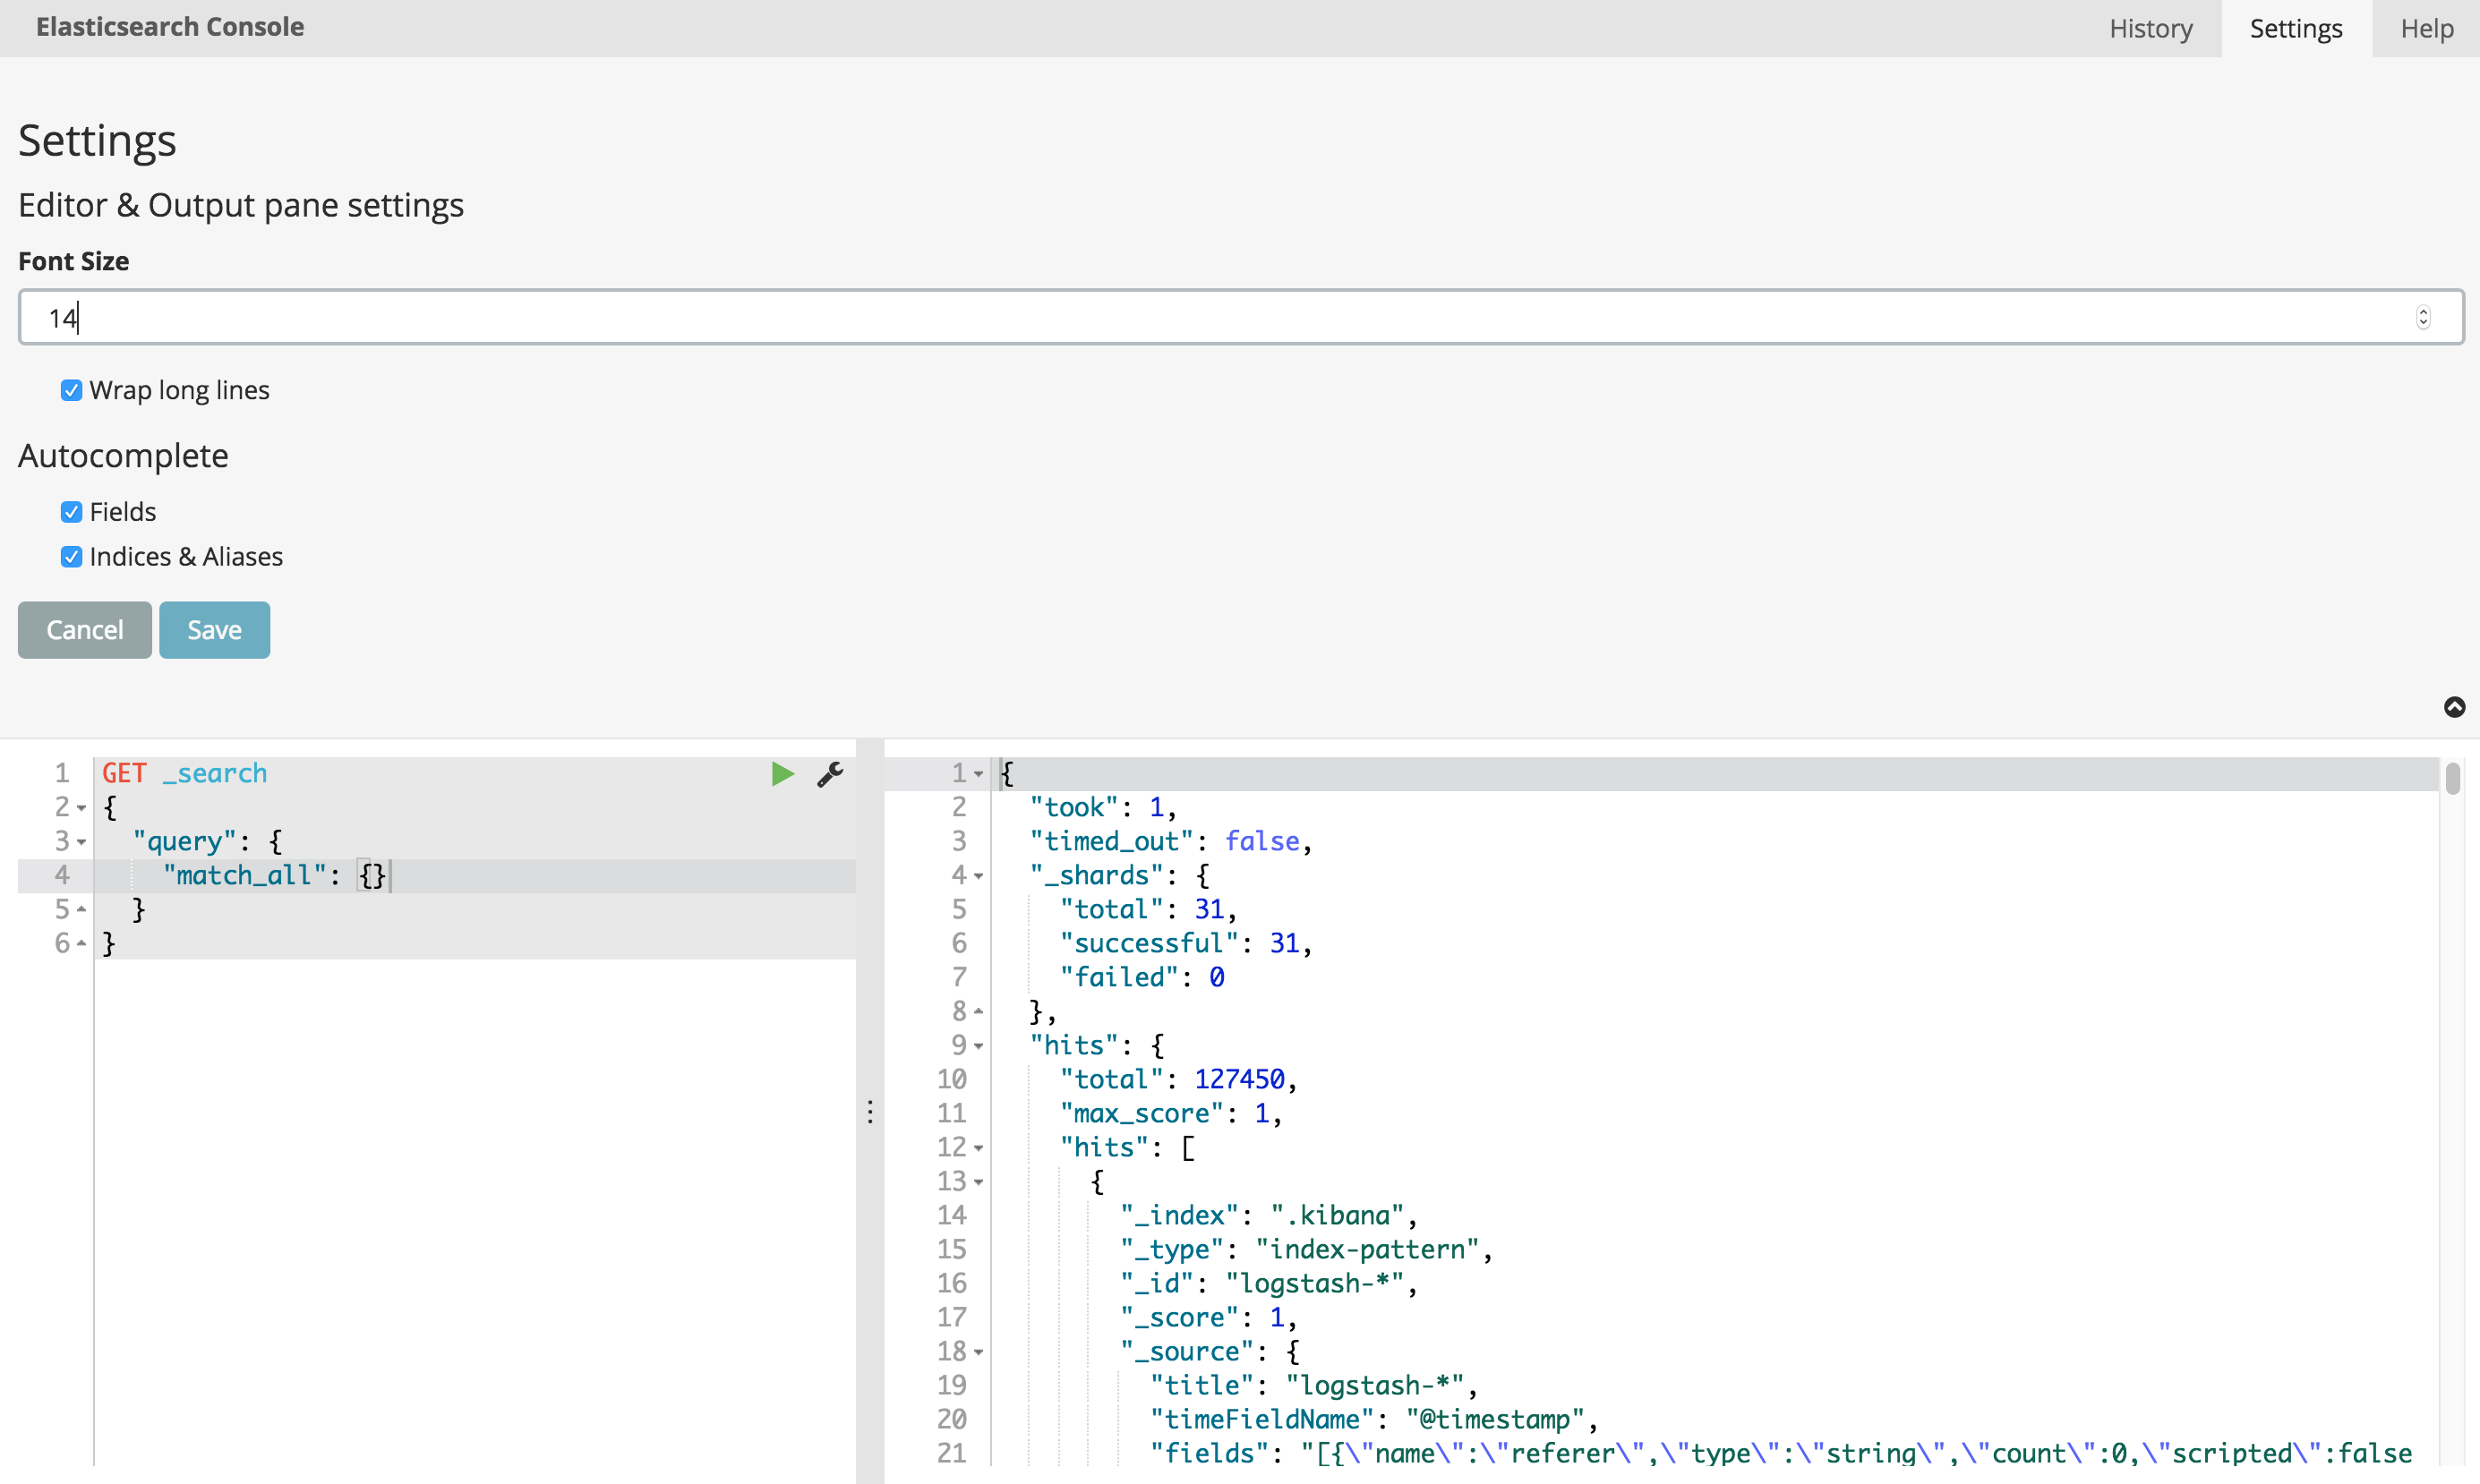
Console has multiple settings you can set. All of them are available in the Settings panel. To open the panel click on the cog icon on the top right.
Console is meant to be used as a local development tool. As such, it will send requests to any host & port combination,
just as a local curl command would. To overcome the CORS limitations enforced by browsers, Console’s Node.js backend
serves as a proxy to send requests on behalf of the browser. However, if put on a server and exposed to the internet
this can become a security risk. In those cases, we highly recommend you lock down the proxy by setting the
console.proxyFilter setting. The setting accepts a list of regular expressions that are evaluated against each URL
the proxy is requested to retrieve. If none of the regular expressions match the proxy will reject the request.
Here is an example configuration the only allows Console to connect to localhost:
sense.proxyFilter:
  - ^https?://(localhost|127\.0\.0\.1|\[::0\]).*
Restart Kibana for these changes to take effect.

