- wdb - Web Debugger
wdb is a full featured web debugger based on a client-server architecture.
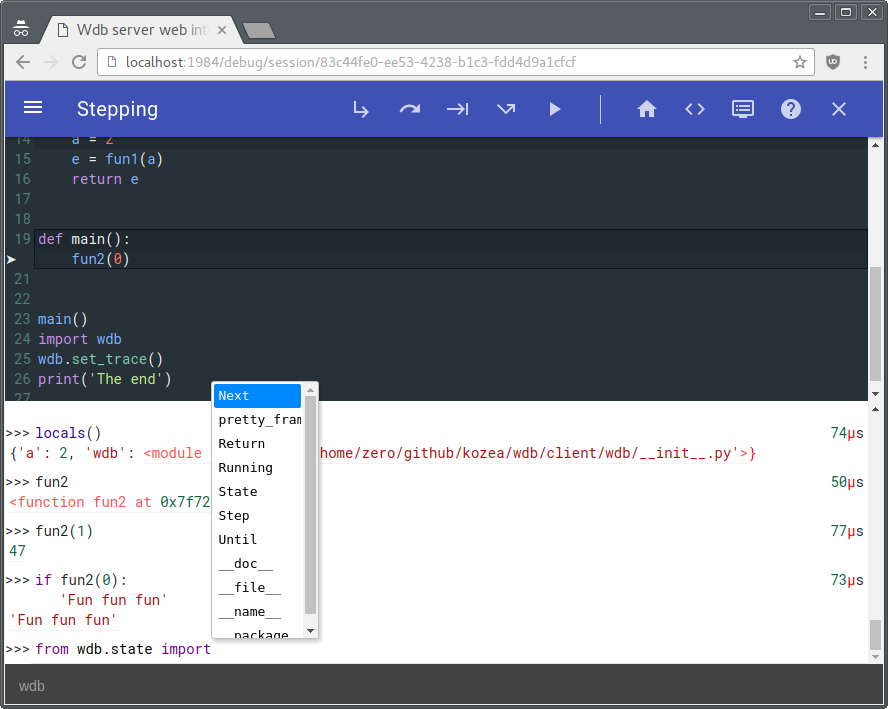
The wdb server which is responsible of managing debugging instances along with browser connections (through websockets) is based on Tornado. The wdb clients allow step by step debugging, in-program python code execution, code edition (based on CodeMirror) setting breakpoints...
Due to this architecture, all of this is fully compatible with multithread and multiprocess programs.
wdb works with python 2 (2.6, 2.7), python 3 (3.2, 3.3, 3.4α) and pypy. Even better, it is possible to debug a python 2 program with a wdb server running on python 3 and vice-versa or debug a program running on a computer with a debugging server running on another computer inside a web page on a third computer!
In other words it's a very enhanced version of pdb directly in your browser with nice features.
$ pip install wdb
To try wdb, first you have to start the wdb server:
$ wdb.server.py &
Next run:
$ python -m wdb your_file.py
Wdb will open a debugging window right in your browser, paused at the beginning of your program.
NB: You have to start the server only once. Multiple Debugging sessions can be run simultaneously without problem.
This is not the only way to debug a program, see below.
To debug any program, with the server on, just add:
    import wdb
    wdb.set_trace()
anywhere in your code. Your program will stop at the set_trace line. (Just like pdb)
To inspect your code on exception, you can do the following:
    from wdb import trace
    with trace():
        wrong_code()
Any exception during wrong_code will launch a debugging session.
You can also use the start_trace() and stop_trace methods.
(It's better to put the stop_trace in a finally block to avoid tracing all your program after an exception.)
wdb provides some tools to make it work nicely with different webservers:
For wsgi servers you can use the WdbMiddleware:
    from wdb.ext import WdbMiddleware
    wsgi_app = Whathever_wsgi_server_lib()
    my_app = WdbMiddleware(wsgi_app)
my_app.serve_forever()or using Flask:
    from flask import Flask
    from wdb.ext import WdbMiddleware
    app = Flask(__name__)
    app.debug = True
    app.wsgi_app = WdbMiddleware(app.wsgi_app)
    app.run(use_debugger=False) # Disable builtin Werkzeug debugger
you can also use the Flask-Wdb extension
    from flask import Flask
    from flask_wdb import Wdb

    app = Flask(__name__)
    app.debug = True
    Wdb(app)

app.run()or using django:
Add the middleware in your wsgi.py:
After:
    from django.core.wsgi import get_wsgi_application
    application = get_wsgi_application()
Add this:
    from wdb.ext import WdbMiddleware
    application = WdbMiddleware(application)
And in your settings.py, activate exception propagation:
    DEBUG = True
DEBUG_PROPAGATE_EXCEPTIONS = Trueor using CherryPy:
import cherrypy
from wdb.ext import WdbMiddleware

class HelloWorld(object):
    @cherrypy.expose
    def index(self):
        undefined_method() # This will fail
        return "Hello World!"

cherrypy.config.update({'global':{'request.throw_errors': True}})
app = cherrypy.Application(HelloWorld())
app.wsgiapp.pipeline.append(('debugger', WdbMiddleware))

cherrypy.quickstart(app)In tornado, which is not a wsgi server, you can use the wdb_tornado function which will monkey patch the execute methon on RequestHandlers:
    from wdb.ext import wdb_tornado
    from tornado.web import Application
    my_app = Application([(r"/", MainHandler)])
    if options.debug:
        wdb_tornado(my_app)
my_app.listen(8888)If wdb slows down too much of your application (tracing all the things takes time), you can start it disabled with:
    my_app = WdbMiddleware(wsgi_app, start_disabled=True)  # or
    wdb_tornado(my_app, start_disabled=True)
Then when you get an exception just click on the on/off button.
You can easily do remote debugging with wdb:
Let's say you want to run a program p.py on computer A and you want to debug it on computer B.
Start wdb server on computer A and launch this:
WDB_NO_BROWSER_AUTO_OPEN=True python -m wdb p.py
And open a browser on computer B at the url given by wdb log.
Now you can also run wdb server on a computer C and run on computer A:
WDB_NO_BROWSER_AUTO_OPEN=True WDB_SOCKET_SERVER=computerC.addr WDB_SOCKET_PORT=19840 python -m wdb p.py
And go with computer B to http://computerC/debug/session/[uuid in log] there you can step into p.py running in computer A. Yay !
You can use different configurations:
See wdb.server.py --help for changing ports on server and these environnement vars for wdb instances:
WDB_SOCKET_SERVER         # WDB server host
WDB_SOCKET_PORT           # WDB server socket port
WDB_WEB_SERVER            # WDB server host for browser openning
WDB_WEB_PORT              # WDB server http port
WDB_NO_BROWSER_AUTO_OPEN  # To disable the automagic browser openning (which can't be done if the browser is not on the same machine)
Once you are in a breakpoint or in an exception, you can eval all you want in the prompt under the code.
Multi-lines are partially supported using [Shift] + [Enter].
As of now the following special commands are supported during breakpoint:
* .s or [Ctrl] + [↓] or [F11]    : Step into
* .n or [Ctrl] + [→] or [F10]    : Step over (Next)
* .r or [Ctrl] + [↑] or [F9]     : Step out (Return)
* .c or [Ctrl] + [←] or [F8]     : Continue
* .u or [F7]                     : Until (Next over loops)
* .j lineno                      : Jump to lineno (Must be at bottom frame and in the same function)
* .b arg                         : Set a session breakpoint, see below for what arg can be*
* .t arg                         : Set a temporary breakpoint, arg follow the same syntax as .b
* .z arg                         : Delete existing breakpoint
* .l                             : List active breakpoints
* .f                             : Echo all typed commands in the current debugging session
* .d expression                  : Dump the result of expression in a table
* .w expression                  : Watch expression in curent file (Click on the name to remove)
* .q                             : Quit
* .h                             : Get some help
* .e                             : Toggle file edition mode
* .g                             : Clear prompt
* .i [mime/type;]expression      : Display the result in an embed, mime type is auto detected on linux and defaults to "text/html" otherwise
* iterable!sthg                  : If cutter is installed, executes cut(iterable).sthg
* expr >! file                   : Write the result of expr in file
* !< file                        : Eval the content of file
* [Enter]                        : Eval the current selected text in page, useful to eval code in the source
*
* * arg is using the following syntax:
*   [file/module][:lineno][#function][,condition]
* which means:
*   - [file]                    : Break if any line of `file` is executed
*   - [file]:lineno             : Break on `file` at `lineno`
*   - [file][:lineno],condition : Break on `file` at `lineno` if `condition` is True (ie: i == 10)
*   - [file]#function           : Break when inside `function` function
*
* File is always current file by default and you can also specify a module like `logging.config`.
You can also eval a variable in the source by middle clicking on it. You can add/remove a breakpoint by clicking on the line number.
NB: Hotkeys with arrows are purposely not triggered in the eval prompt to avoid conflicts when typing.
To see which debugging session are currently open, open your browser at http://localhost:1984/. You can also close crashed session.
Yes to avoid that, you can add a w builtin at the beggining of your application:
    from wdb.ext import add_w_builtin
    add_w_builtin()
you can now use the w object any where in your code:
    my_code()
    w.tf  # Stop next line
doubtful_code() my_code()
with w.trace():
doubtful_code()You can use the light theme like that:
    wdb.server --theme=light  # and if you disable the debugger
    WdbMiddleware(app, theme='light') # or
    wdb_tornado(app, theme='light')
But it is less polished than the dark theme. If you like writing css feel free to make your own and pull request it to me, css is generated using compass and most of the work will be setting variables.
Wdb has dynamic code completion in eval prompt thanks to jedi.
wdb is based on websockets and since 3812417 its layout relies on flexbox, browser requirement is now :
- Chrome 29
- Firefox 22
- IE 11
Better update you browser in any case. If it doesn't work with one of these version please report it.
It's a firefox config flag, visit about:config and set:
dom.allow_scripts_to_close_windows to true
All contributions are more than welcomed, use the fork luke !
Wdb is now partially tested, so if you want to contribute be sure to run the test suite:
    $ pip install pytest
    $ py.test
Feel free to add tests !
This library is licensed under GPLv3
wdb - An improbable web debugger through WebSockets
wdb Copyright (C) 2013  Florian Mounier, Kozea

This program is free software: you can redistribute it and/or modify
it under the terms of the GNU General Public License as published by
the Free Software Foundation, either version 3 of the License, or
(at your option) any later version.

This program is distributed in the hope that it will be useful,
but WITHOUT ANY WARRANTY; without even the implied warranty of
MERCHANTABILITY or FITNESS FOR A PARTICULAR PURPOSE.  See the
GNU General Public License for more details.

You should have received a copy of the GNU General Public License
along with this program.  If not, see <http://www.gnu.org/licenses/>.