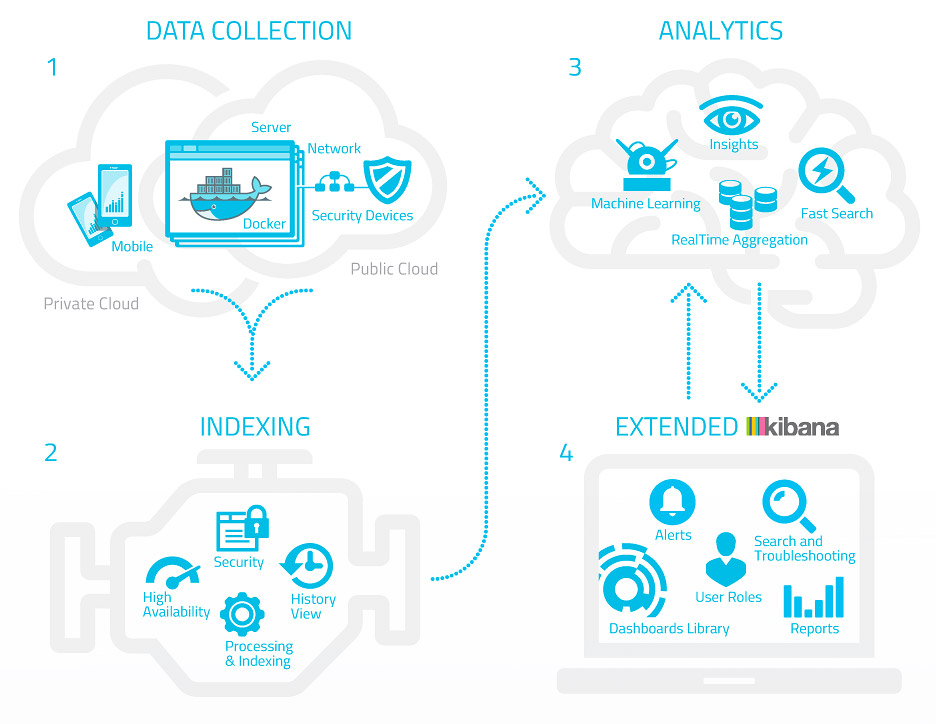
- CENTRALIZING LOG DATA - In today’s distributed architecture and micro services environment, it’s crucial to have all the logs from your application, the OS and the infrastructure provider in one place in order to properly monitor and be able to quickly troubleshoot issues. Logz.io keeps all the logs in one place and all are synchronized by time allowing you to quickly get a holistic view of your entire environment.
- TROUBLESHOOTING & FORENSICS - Troubleshooting production issues is perhaps the most common use-case of log analytics. The Logz.io interface (Kibana) lets you search through millions of records to investigate and pinpoint potential issues. You can filter results by server, application or any custom parameter until you reach the the source of the problem. Advanced features such as alerts enable you to get proactive notifications of issues you think are important, helping you to stay on top of evolving problems.
- INFRASTRUCTURE MONITORING - Monitoring your infrastructure can often help with identifying application level issues. We have implemented seamless integration with cloud providers like AWS, Heroku and others to allow you quick and detailed access to your infrastructure. We have also integrated Docker image to collect server level statistics to aid in monitoring.
- SECURITY & COMPLIANCE - Most environments today require a certain level of security protection and compliance. You can use Logz.io to monitor various security threats such as password brute force detection, access control, network access and customized events. You can setup proactive alerts on selected events and create the relevant dashboards to view trends and aggregated data. For compliance purposes using S3 Archiving capabilities can help save data across required data duration.
- BUSINESS INTELLIGENCE- There is a great advantage of using Logz.io’s ELK Cloud service for Business intelligence. The Kibana interface includes a range of visualizations and dashboards to track your environment. By combining application level logs and infrastructure level logs you have unique visibility into the journey your customers are experiencing. You can determine if their response time is affected by application issues and you can detect errors that are otherwise not existent if you only monitor customer interaction.
10 Elasticsearch Concepts You Need to Learn https://logz.io/blog/10-elasticsearch-concepts/
Everything You Need to Know About ELK Stack 5.0 https://logz.io/blog/elk-stack-5-0/
The Complete Guide to the ELK Stack https://live-logz-io.pantheonsite.io/learn/complete-guide-elk-stack/
-
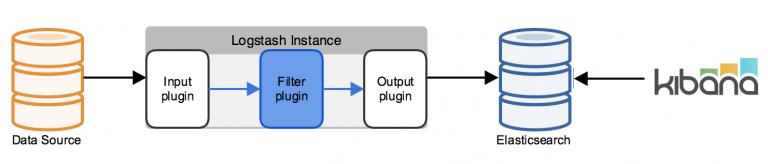
The ELK stack consists of Elasticsearch, Logstash, and Kibana.
-
Welcome to the ELK Stack: Elasticsearch, Logstash, and Kibana
Logstash: It is a tool for managing events and logs. You can use it to collect logs, parse them, and store them for later use (like, for searching). Speaking of searching, logstash comes with a web interface for searching and drilling into all of your logs. It is fully free and fully open source.
Elasticsearch: Elasticsearch is a search server based on Lucene. It provides a distributed, multitenant-capable full-text search engine with a RESTful web interface and schema-free JSON documents.
Kibana: A nifty tool to visualize logs and timestamped data.
http://elk.mesosframeworks.com/
https://github.com/deviantony/docker-elk

The Complete Guide to the ELK Stack https://logz.io/learn/complete-guide-elk-stack/
The Complete Guide to the ELK Stack https://logz.io/learn/complete-guide-elk-stack/
ELK - LOGSTASH, ELASTICSEARCH, AND KIBANA http://www.bogotobogo.com/Hadoop/ELK/ELK_ElasticSearch_Logstash_Kibana4.php
http://www.bogotobogo.com/Hadoop/ELK/ELK_Architecture_Samples_ElasticSearch_Logstash_Kibana.php
https://www.elastic.co/products
https://logz.io/product/#tab-6a5f99f5d900b26b85f https://www.elastic.co/blog/found-uses-of-elasticsearch
https://www.elastic.co/guide/en/logstash/current/introduction.html
https://logz.io/learn/complete-guide-elk-stack/
Logstash Tutorial: How to Get Started https://logz.io/blog/logstash-tutorial/
https://www.elastic.co/elasticon/conf/2016/sf
Elastic Qbox Logit.io Sematext Logz.io Digital Ocean – Elk http://community.visualize-it.co/knowledgebase/collecting-performance-data-from-unix-systems-using-topbeat-and-elk/
https://dzone.com/articles/using-elk-in-net-applications?
The Full ELK Stack Installation Tutorial https://logz.io/learn/elk-stack-tutorial/
How to Use ELK to Monitor Performance https://logz.io/blog/elk-monitor-platform-performance/
Docker Monitoring with the ELK Stack: A Step-by-Step Guide https://logz.io/learn/docker-monitoring-elk-stack/
Welcome to the ELK Stack: Elasticsearch, Logstash, and Kibana https://qbox.io/blog/welcome-to-the-elk-stack-elasticsearch-logstash-kibana
The Definitive Guide to AWS Log Analytics Using ELK https://logz.io/learn/definitive-guide-aws-log-analytics-elk/
Visualizing data with Elasticsearch, Logstash and Kibana https://blog.webkid.io/visualize-datasets-with-elk/ The Definitive Guide to AWS Log Analytics Using ELK https://logz.io/learn/definitive-guide-aws-log-analytics-elk/
Real time monitoring of .NET web applications with logstash, elasticsearch and Kibana http://spencerooni.github.io/2015/07/10/real-time-monitoring-of-.net-web-applications-with-logstash-elasticsearch-and-kibana.html
How to Integrate Slack with Elasticsearch, Logstash, and Kibana https://qbox.io/blog/integrate-slack-elasticsearch-logstash-kibana-elk
How to Use Elasticsearch, Logstash, and Kibana to Manage Redis Logs https://qbox.io/blog/redis-logs-elasticsearch-logstash-kibana
https://bulldogjob.pl/articles/398-monitoring-net-applications-with-elk
Monitor Service Uptime With Heartbeat and the ELK Stack https://dzone.com/articles/monitor-service-uptime-with-heartbeat-and-the-elk
Some successful ELK log analytics use cases include:
- Risk management
- Market intelligence
- E-commerce personalization
- Compliance
- Security analysis
- Fraud detection
http://i0.wp.com/community.visualize-it.co/wp-content/uploads/2016/02/elk-flow.png
https://wikitech.wikimedia.org/wiki/Logstash#/media/File:Wikipedia_webrequest_flow_2015-10.png
How to Use ELK to Monitor Performance https://logz.io/blog/elk-monitor-platform-performance/
NGINX Log Analysis with Elasticsearch, Logstash, and Kibana https://logz.io/blog/nginx-log-analysis/
Creating Custom Kibana Visualizations: A How-To Guide https://logz.io/blog/kibana-visualizations/
IIS Log Analyzer: Elasticsearch, Logstash, and Kibana https://logz.io/blog/iis-log-analyzer/
Elasticsearch Cluster Setup & Update: Read, Plan, and Test https://logz.io/blog/elasticsearch-cluster-setup/
Logstash Tutorial: How to Get Started https://logz.io/blog/logstash-tutorial/
A Guide to Logstash Plugins https://logz.io/blog/logstash-plugins/
An Elasticsearch Tutorial: Getting Started https://logz.io/blog/elasticsearch-tutorial/
A Kibana Tutorial: Part 1 — Getting Started https://logz.io/blog/kibana-tutorial/
Redis Performance Monitoring with the ELK Stack https://logz.io/blog/redis-performance-monitoring-elk-stack/
Apache Log Analyzer: Elasticsearch, Logstash, and Kibana https://logz.io/blog/apache-log-analyzer/
https://logz.io/blog/what-is-devsecops/
https://logz.io/blog/docker-logging-elk-stack-part-two/ https://logz.io/blog/docker-logging/
https://logz.io/blog/real-time-analytics/
https://logz.io/blog/bigquery-vs-athena/
https://logz.io/blog/machine-learning-log-analytics/
https://logz.io/blog/log-data-important-for-compliance/
https://logz.io/blog/server-log-analysis/
https://logz.io/blog/elasticsearch-mapping/
https://logz.io/blog/docker-swarm-monitoring-logging-using-elk-stack/
https://logz.io/blog/monitor-elasticsearch-graphite-grafana/
https://logz.io/blog/the-cost-of-doing-elk-stack-on-your-own/
https://logz.io/blog/business-intelligence-tools/
Technical Debt is a Good Thing https://logz.io/blog/technical-debt/
How to Use ELK to Monitor Performance https://logz.io/blog/elk-monitor-platform-performance/
Logz.io Introduces Alerts to the ELK Platform https://logz.io/blog/introducing-alerts-for-elk/
https://app.logz.io/#/dashboard/apps
LOGSTASH Cheat Sheet https://www.snip2code.com/Snippet/726129/This-is-a-LOGSTASH-Cheat-Sheet
Elasticsearch Cheatsheet http://elasticsearch-cheatsheet.jolicode.com/ https://rayhon.gitbooks.io/tech-blog/content/elasticsearch-cheatsheet.html
kibana-cheat-sheet https://snitchhunt.org/kibana-cheat-sheet https://drive.google.com/file/d/0B2S_IOa0MiOHWndxWFRiUHNoNW8/view
https://cdn-images-1.medium.com/max/800/0*IelcAOs7TPQxBYE_.png https://balamaci.ro/content/images/2016/03/elkstack.png
https://balamaci.ro/java-app-monitoring-with-elk-logstash/ https://www.elastic.co/guide/en/logstash/current/static/images/logstash.png
https://fabianlee.org/wp-content/uploads/2016/11/elk-simplest-with-kibana-768x164.png
https://www.hcltech.com/sites/default/files/images/elk_stack.png
https://www.hcltech.com/blogs/real-time-operational-insights-using-elk-stack