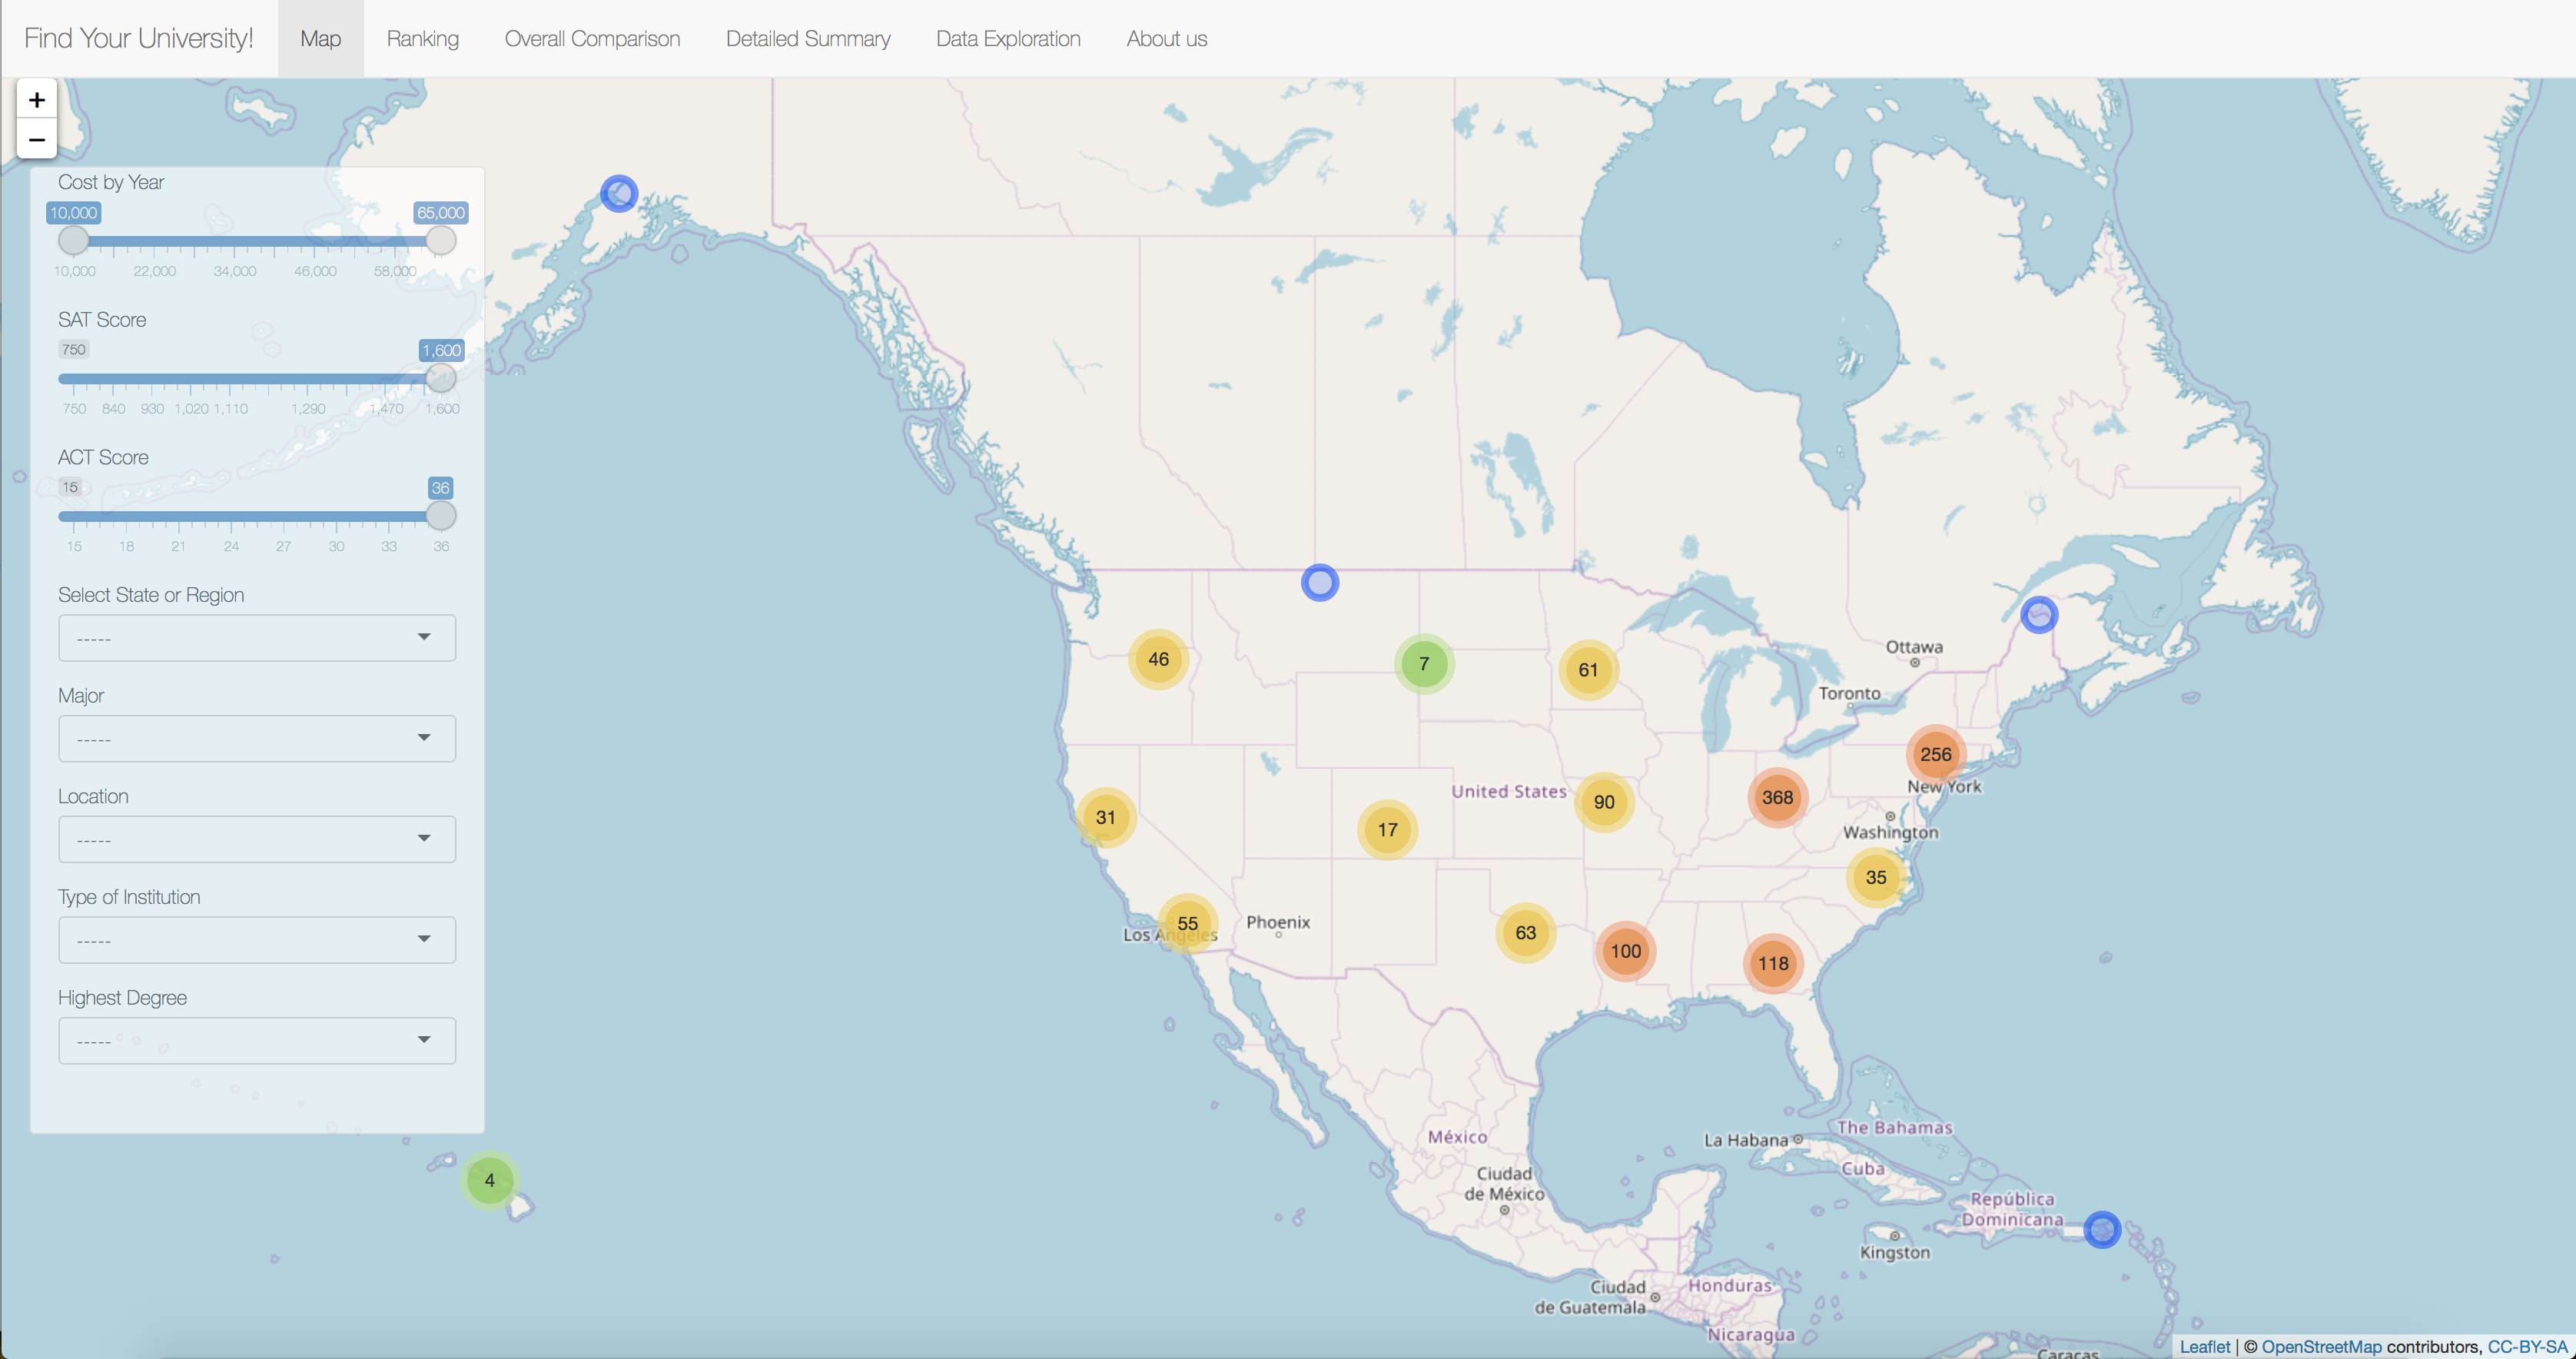
In this second project of GR5243 Applied Data Science, we develop a version 2.0 of an Exploratory Data Analysis and Visualization shiny app and our chosen topic is college scorecard. See Project 2 Description for more details.
The learning goals for this project is:
- business intelligence for data science
- study legacy codes and further development
- data cleaning
- data visualization
- systems development/design life cycle
- shiny app/shiny server
Term: Spring 2018
-
Team #4
-
Team Members
- Alcantara, Zuleimy [email protected]
- Gao, Han [email protected]
- Guo, Yaoqi [email protected]
- Mu, Jay [email protected]
- Zheng, Wanyi [email protected]
-
Project summary: In this second project of GR5243 Applied Data Science, we develop a version 2.0 of an Exploratory Data Analysis and Visualization shiny app and our chosen topic is college scorecard. Find Your University 2.0 helps prospect college students find their ideal college match. Whether they are in beginning stages or at the end . Our app allows students to do side by side comparisons of admission stats, tuition costs, ranks, and campus information in one place allowing students to focus on the application. This app is an update and expansion of a previous project from the same class in Fall 2017.
+Added Functionality:
We made the map more interactive. For example, students can now be directed to the selected school
website from the map. They can also access Quick-Facts about the school before proceeding to learn more.
Our Ranking Tab now allows students to select schools they wish to learn more about.
Our Overall Comparison now gives side by side comparison of admission, demographics, tuition, and campus life of different colleges.
Our Detailed Summary Tab allows students to get a more customizable experience. Students can choose which comparisons they'll like to see and they'll see it in a more appealing display. It allows students to access information quicker and all in one convenient place.
Our Data Exploration Tab allows you to see side by side comparison of Admission stats over the last decade. This gives students an idea of where they currently stand.
We added an A bout us tab so that the user could learn more about the functionality of the app and the development team.
Overall we changed labels to more user-friendly titles. We changed the ordering of the tabs simplifying user navigation.
-
Data Scorce:
- https://collegescorecard.ed.gov/data/
- https://www.ers.usda.gov
- https://wonder.cdc.gov/NASA-NLDAS.html
- https://www.bls.gov/lau/
- https://www.census.gov/did/www/saipe/
- https://wonder.cdc.gov/wonder
- https://www.forbes.com/sites/nataliesportelli/2016/07/06/the-full-list-of-americas-top-colleges-2016/#191c50d569a4
-
Contribution statement: see here
Following suggestions by RICH FITZJOHN (@richfitz). This folder is orgarnized as follows.
proj/
├── app/
├── lib/
├── data/
├── doc/
└── output/
Please see each subfolder for a README file.
