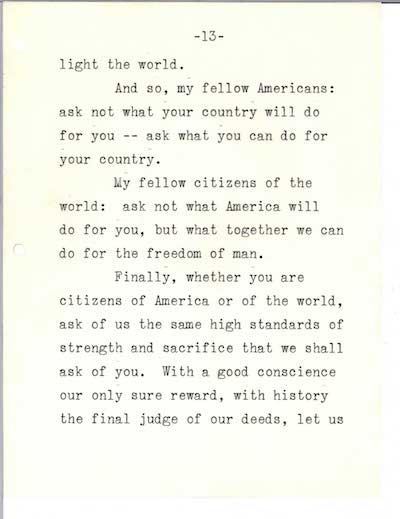
Inaugural speech is the first official speech of any president of United States. It is the first time the public get to hear the president's plan for the next 100 days or 4 years. Historians who studied [1][2] past presidential inaugural speeches concluded that the speeches persistently demonstrated American ideological values over time, with constant shifts of emphasis in different eras. Natural language processing and text mining are promising tools to derive new findings in this collection of historical documents. [3]
[1] Sigelman, Lee. "Presidential inaugurals: The modernization of a genre." Political Communication 13.1 (1996): 81-92.
[2] Windt, Theodore Otto. "Presidential rhetoric: Definition of a field of study." Presidential Studies Quarterly 16.1 (1986): 102-116.
[3] Shahin, Saif. "When scale meets depth: Integrating natural language processing and textual analysis for studying digital corpora." Communication Methods and Measures 10.1 (2016): 28-50.
In this project we will explore the texts of U. S. presidents' inaugrual speeches, from that of George Washington to that of Donald Trump which was delivered earlier this year.
You are tasked to explore the texts using tools from text mining and natural language processing such as sentiment analysis, topic modeling, etc, all available in R and write a small story about inaugural speeches of U.S. presidents on interesting trends and patterns identified by your analysis.
For this project, you will receive 59 inaugrual speeches that was scrapped from The American Presidency Project.
Even though this is an individual project, you are encouraged to discuss online and exchange ideas.
The data set released contain:
InaugrationInfo.xlsx: some basic information about the presidential inaugrations.InaugrationDates.txt: dates information about the presidential inaugrations.inaug[president]-[term].txt: plain text files of the transcripts of inaugrual speeches.
You should produce an R notebook (rmd and html files) in your GitHub project folder, where you should write a story or a blog post on presidential inaugural speeches based on your data analysis. Your story should be supported by your results and appropriate visualization
A GitHub starter codes repo will be posted on piazza for you to fork and start your own project. The GitHub repo will come with suggested milestones.
- R dplyr package
- R readr package
- R DT package
- R tibble
- Rcharts, quick interactive plots
- htmlwidgets, javascript library adaptation in R.
For this project we will give tutorials and give comments on:
- GitHub
- R notebook
- Example on sentiment analysis and topic modeling
The final repo should be under our class github organization (TZStatsADS) and be organized according to the structure of the starter codes.
proj/
├──data/
├──doc/
├──figs/
├──lib/
├──output/
├── README
- The
datafolder contains the raw data of this project. These data should NOT be processed inside this folder. Processed data should be saved tooutputfolder. This is to ensure that the raw data will not be altered. - The
docfolder should have documentations for this project, presentation files and other supporting materials. - The
figsfolder contains figure files produced during the project and running of the codes. - The
libfolder contain computation codes for your data analysis. Make sure your README.md is informative about what are the programs found in this folder. - The
outputfolder is the holding place for intermediate and final computational results.
The root README.md should contain your name and an abstract of your findings.
This is a relatively short project. We only have about two weeks of working time.
- [wk1] Week 1 is the data processing and mining week. Read data description, project requirement, browse data, and think about what to do and try out different tools you find related to this task.
- [wk1] Try out ideas on a subset of the data set to get a sense of computational burden of this project.
- [wk2] Explore data for interesting trends and start writing your data story.
