Cabot is a free, open-source, self-hosted infrastructure monitoring platform that provides some of the best features of PagerDuty, Server Density, Pingdom and Nagios without their cost and complexity. (Nagios, I'm mainly looking at you.)
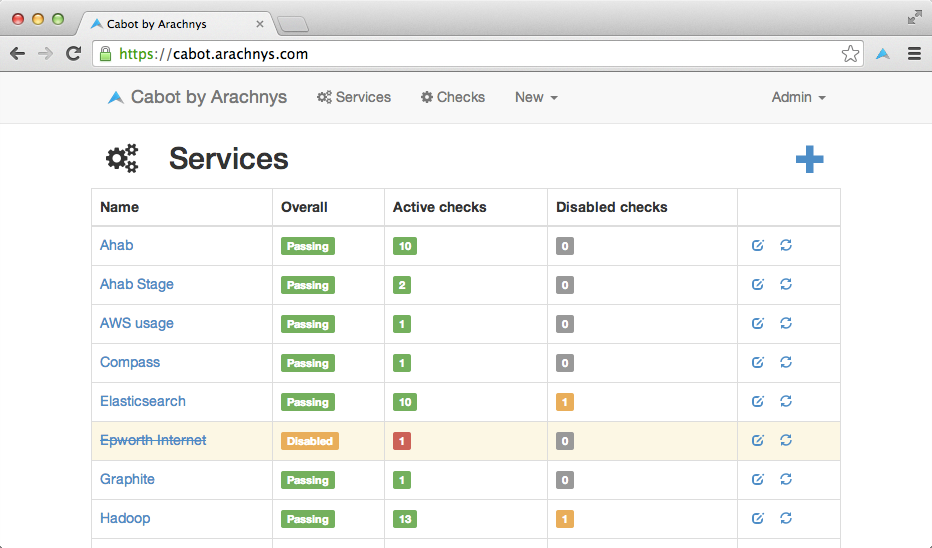
It provides a web interface that allows you to monitor services (e.g. "Stage Redis server", "Production ElasticSearch cluster") and send telephone, sms or hipchat/email alerts to your on-duty team if those services start misbehaving or go down - all without writing a line of code. Best of all, you can use data that you're already pushing to Graphite/statsd to generate alerts, rather than implementing and maintaining a whole new system of data collectors.
You can alert based on:
We built Cabot as a Christmas project at Arachnys because we couldn't wrap our heads around Nagios, and nothing else out there seemed to fit our use case. We're open-sourcing it in the hope that others find it useful.
Cabot is written in Python and uses Django, Bootstrap, Font Awesome and a whole host of other goodies under the hood.
- Clone this repo
- Add your keys for external services to
conf/production.env. - Spin up a new VPS instance (on e.g. AWS or DigitalOcean) - you can even do this from the command line via
tugboattugboat create cabot --size=63 --image=1505447 --region=1- create a new droplet calledcabotwith 1GB of memory running Ubuntu 12.04 in New York region
- Run
fab provision -H [email protected]from your local clone. This will install dependencies on the new server and create a newubuntuuser that will be able to connect over SSH (we do this for compatibility with Amazon's Ubuntu AMIs). - Run
fab deploy -H [email protected]locally.- The deploy script will prompt you to create a Django superuser which you'll use to log in and create additional users.
- Go to
your.server.hostname, log in as superuser, and create your firstServices andChecks using the web interface. - (Optional) get woken up at 3 a.m. by an automated phone call telling you your server has crashed.
A Service corresponds to a logical unit of your infrastructure. This might be a single machine ("Production Postgresql master"), a service running on shared infrastructure ("Stage Redis") or any number of machines ("Production ElasticSearch cluster").
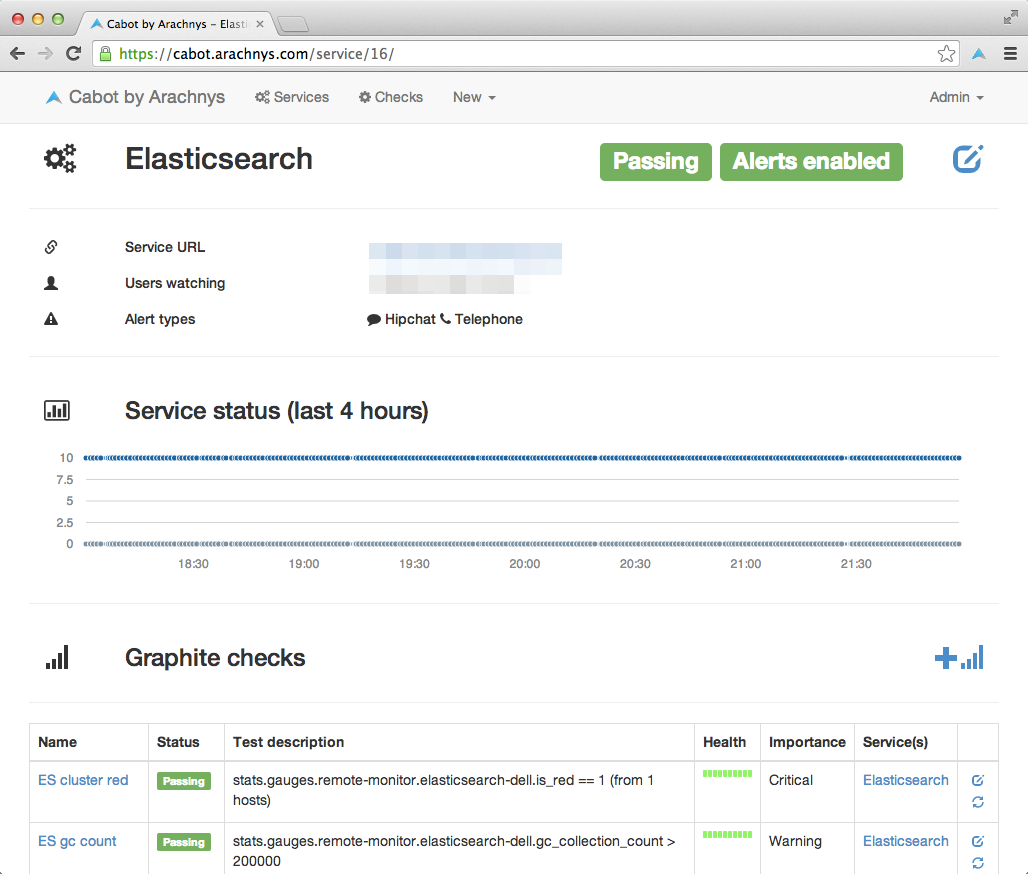
Each service is associated with one or more Checks which are monitored in real time.
If a check fails, Cabot can alert you by:
This allows you to calibrate the disruption of the alert (potential phone call at 2am) with the importance of the service (Production frontpage means bleary-eyed firefighting, Stage build server can wait until morning).
Checks can either be:
- Graphite metrics - watch Graphite metrics to make sure they stay within reasonable bounds.
- Monitor infrastructure load to assess whether more resources are required, or monitor disk space on your servers.
- HTTP responses - essentially poor man's Pingdom - check if a server is up, verify response code and run a regex against page content.
- e.g. Check that the phrase Next-generation compliance for high-risk markets appears on www.arachnys.com/ - if it doesn't, perhaps the server is down or misconfigured?
- Jenkins jobs - monitor tasks running on Jenkins to make sure they are behaving OK
- e.g. schedule integration test suite to run against your API every 10 minutes. Cabot will monitor build status of that test suite and alert you to failures.
Cabot will watch specific metrics on your Graphite server (as simple or as complex as you want) and alert based on those metrics.
For example, you can set it up to watch a graphite key called es-production.*.load.load.longterm and alert based on:
- The value of metrics returned from Graphite
- The number of non-null data series from Graphite
In this case, we might want to get an alert either when the number of data series (= machines reporting) falls below 5, or when the load figures for any machine go above 10.
Cabot will poll the endpoint specified (including optional basic auth) and will check for:
- Correct status code (e.g.
200) - Regex match on page content
Cabot can be set up to watch the status of jobs on your Jenkins CI server.
Jenkins can send email alerts on failed builds but we wanted a way of matching up failing builds with actual infrastructure problems.
At the moment all you need to do is put in the exact name of the task on Jenkins. Failed builds will cause the check to fail.
You can also specify the maximum amount of time to allow a build to spend in the queue (to identify stuck jobs) and alert based on that.
Cabot can alert you in one or more ways:
- Email - least intrusive
- Hipchat - better, as (a) it will send you an email if you're offline anyway (as long as your notification preferences are right) and (b) others can jump on the alert even if you don't see it straight away.
- SMS - For important services we can send SMS to alert of failures. Obviously this can be quite annoying so use it wisely.
- Telephone - There is basic functionality to place a phone call on check failure. There is also integration with Google Calendar to implement a rota system.
- Telephone alerts ignore the list of users to notify, and try to phone the "duty officer" straight off.
- The rota is pulled directly from a Google Calendar. All it looks for is a calendar event whose title is the same as the username of the user to alert.
- If there is nobody specified in the Google Calendar rota for that day it will fall back to the user who is flagged as the "Fallback duty officer" (look at the subscriptions page)
- Telephone alerts will only be sent if:
- The failing
Checkis configured asCritical - Telephone alerts are enabled for the
Service(s) in question - There is a user currently scheduled as on duty or there is a correctly-configured backup user
- Mobile phone numbers are correctly configured
- The failing
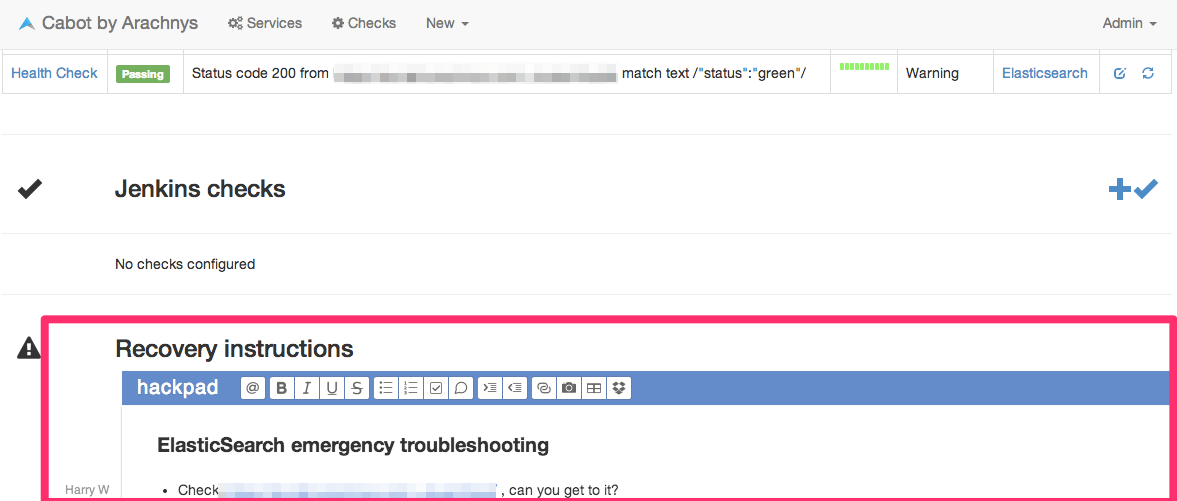
When something goes wrong it's important that information on how to fix it is at our fingertips, especially if it goes wrong at 3am and you want to go back to sleep.
Internally we use Hackpad to consolidate and share this sort of information. Each Service can be linked to an embedded hackpad:
### Dependencies
Cabot needs a few basic things to be installed on top of a clean Ubuntu 12.04 LTS install. We have included a slightly modified setup script in this repo as bin/setup_dependencies.sh. Note that we don't actually use this script ourselves for provisioning - it's really just an example, although at the time of writing it seems to work - and some things will have to be set by hand - e.g. Redis password and SSL certificate.
- Clone repo
cd repo && vagrant up- start Vagrantvagrant ssh- log in to provisioned Vagrant boxforeman start- run webserver and celery tasks for development
If you go to http://localhost:5001/ you should see the front page.
Use standard Django syntax from within Vagrant box:
foreman run python manage.py test cabotapp
In order to use all functionality the following settings must be configured in conf/production.env. If you use fab deploy it will automatically generate an upstart service config including these:
CALENDAR_ICAL_URL- URL of the linked Google Calendar which contains team rota data, e.g.http://www.google.com/calendar/ical/blah%40group.calendar.google.com/
GRAPHITE_API- URL of Graphite server, e.g.https://graphite.mycompany.com/GRAPHITE_USERandGRAPHITE_PASS- username and password (basic auth) for Graphite server
JENKINS_API- URL of Jenkins server, e.g.https://jenkins.mycompany.com/JENKINS_USERandJENKINS_PASS- username and password for API access (basic auth)
HIPCHAT_ALERT_ROOM- numeric ID of the Hipchat room you want alerts sent to, e.g.14256HIPCHAT_API_KEY- write-only API key for Hipchat
TWILIO_ACCOUNT_SID- SID of Twilio accountTWILIO_AUTH_TOKEN- Auth tokenTWILIO_OUTGOING_NUMBER- number for called ID of phone and SMS alerts, e.g.+442035551234
Currently new users have to be added through the Django admin.
You can add phone numbers and hipchat aliases to existing users through the web interface (under Admin > Alert subscriptions > [username])
WWW_HTTP_HOST- FQDN of server, e.g.cabot.yourcompany.com
fab deploy -H cabot.yourcompany.com
- More sophisticated statuses
- Uptime statistics tracked and presented
- Require users to acknowledge phone calls by pressing a button
- Package for PyPI
- Adaptors for other services (Campfire, Travis CI, etc)
- Better user provisioning/invitations/Google Apps SSO
- More tests!
My dog is called Cabot and he loves monitoring things. Mainly the presence of food in his immediate surroundings, or perhaps the frequency of squirrel visits to our garden. He also barks loudly to alert us on certain events (e.g. the postman coming to the door).
It's just a lucky coincidence that his name sounds like he could be an automation tool.
Please write an adaptor, add some tests and send us a pull request. We don't yet have a proper plug-in architecture but it wouldn't be hard to implement one.
Cabot provides an unauthenticated endpoint /status/ which returns response body Checks running if any checks have successfully run in the last five minutes, and Checks not running if they have not.
Our solution to this is very unsophisticated: we have a Jenkins job set up to hit this endpoint every five minutes with the following script:
curl -XGET https://cabot.yourcompany.com/status/ | grep "Checks running"
It will fail if checks stop running or there is some other server failure. Currently (as we have it set up) that will just cause an email alert which we think is acceptable.
We did think about deploying a second instance of Cabot to monitor the first but it seemed like too much hassle.
See LICENSE file in this repo.


