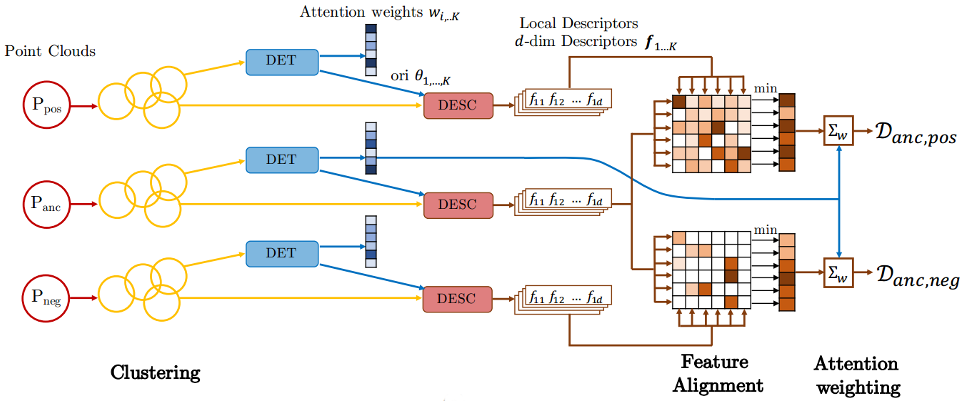
Update (8 Jan): Added the code to generate the Oxford dataset training data. Training code will be uploaded soon.
This work is based on our ECCV2018 paper. 3DFeat-Net is an approach for learning features for point cloud geometric registration under weak-supervision, where the supervision is given in terms of whether 2 point clouds have very high overlap or low (or no) overlap. For details, please read our paper which can be found on arXiv.
Bibtex:
@inproceedings{yew2018-3dfeatnet,
    title={3DFeat-Net: Weakly Supervised Local 3D Features for Point Cloud Registration},
    author={Yew, Zi Jian and Lee, Gim Hee},
    booktitle={ECCV},
    year={2018}
}
Our code is developed and tested on the following environment:
- Python 3.5
- Tensorflow 1.4 (with Cuda 8.0)
- Numpy 1.13.3
- Scikit-learn 0.19.1
We also use MATLAB scripts for evaluation and processing of data.
The network model is in models/feat3dnet.py.
Before using the model, you first need to compile the customized tf_ops in the folder tf_ops (we use the customized grouping and sampling ops from PointNet++).
Check and execute tf_xxx_compile.sh under each subfolder. Update the python and nvcc file if necessary. The scripts has been updated for TF1.4, so if you're using TF version < 1.4, refer to the original script provided with PointNet++ for compilation.
Code to train the network will be uploaded soon.
- Run
inference_example.shwhich will load the pretrained model in the folderckptand generate the keypoints and descriptors for the example data inexample_data. A sample checkpoint can be downloaded from here. The output will be stored inexample_data/results. - Run the MATLAB script
scripts/computeAndVisualizeMatches.mwhich will match the features, estimate the relative transformation (with RANSAC) between the point clouds and display the results.
It should be straightforward to run on your own data, just make sure the data is in the expected format (see scripts_data_processing/Readme.md). Note however the following:
- z-axis should be pointing vertically upwards
- The network considers up to 64 points per cluster. For dense point clouds, it will pick the points randomly (as long the flag
--randomize_pointsis set which will randomize the input point ordering). This means that the performance may differ slightly with each run.
Refer to scripts_data_processing/Readme.md .
