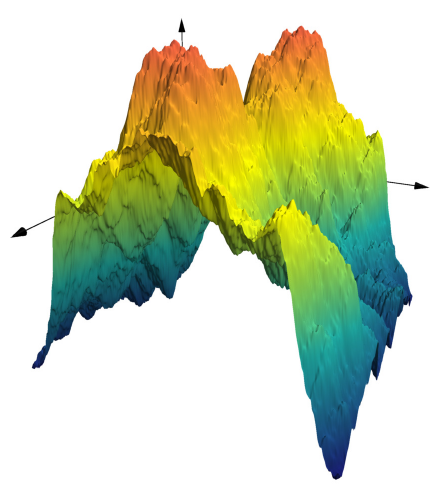
AsyPlots is a Julia package for creating figures in Asymptote. Asymptote is a mature language for technical drawing in two and three dimensions. This package provides access to
- Vector graphics with LaTeX-rendered labels in 2D and 3D
- An OpenGL renderer for interacting with 3D figures
- Easily customizable colors and arrows
- Convenience functions for line graphs and surface plots, with less of a time-to-first-plot penalty than some other packages
- An environment designed for working directly with graphics primitives (points, paths, polygons, circles, parametric surfaces) in natural coordinates
- in-line plotting in IJulia and Juno's plot pane
- Options to save output as asy, eps, pdf, svg, or png
- An alternative Cairo backend, for speed
AsyPlots requires Asymptote, which you might already have as a part
of your TeX installation (run asy --version from the command line to
check).
Asymptote can optionally use an alternative backend that relies on Cairo.jl, though
this package is currently not installing cleanly.
Try
using Homebrew
Homebrew.brew(`reinstall fontconfig`)
Pkg.build("Cairo")
See this thread for more details.
using AsyPlots
n = 250; srand(1)
A = [(x,y) == (0,0) ? 0 : 1/(x^2+y^2) for x=0:n-1,y=0:n-1]
B = randn(n,n)
save("fgf.png",plot(real(fft(A.*B));width=150)) # hide
plot(real(fft(A.*B)))
using AsyPlots # hide
n = 100000; srand(2) # hide
x = cumsum(rand(-1:1,n))
y = cumsum(rand(-1:1,n))
save("rw.svg",Plot(Path(x,y;color="White"), # hide
bgcolor="Black", width=512, # hide
axispen="Red",axes=true,axisarrow=Arrow())) # hide
Plot(Path(x,y;color="White"),
bgcolor="Black",
axispen="Red",
axes=true,
axisarrow=Arrow())

