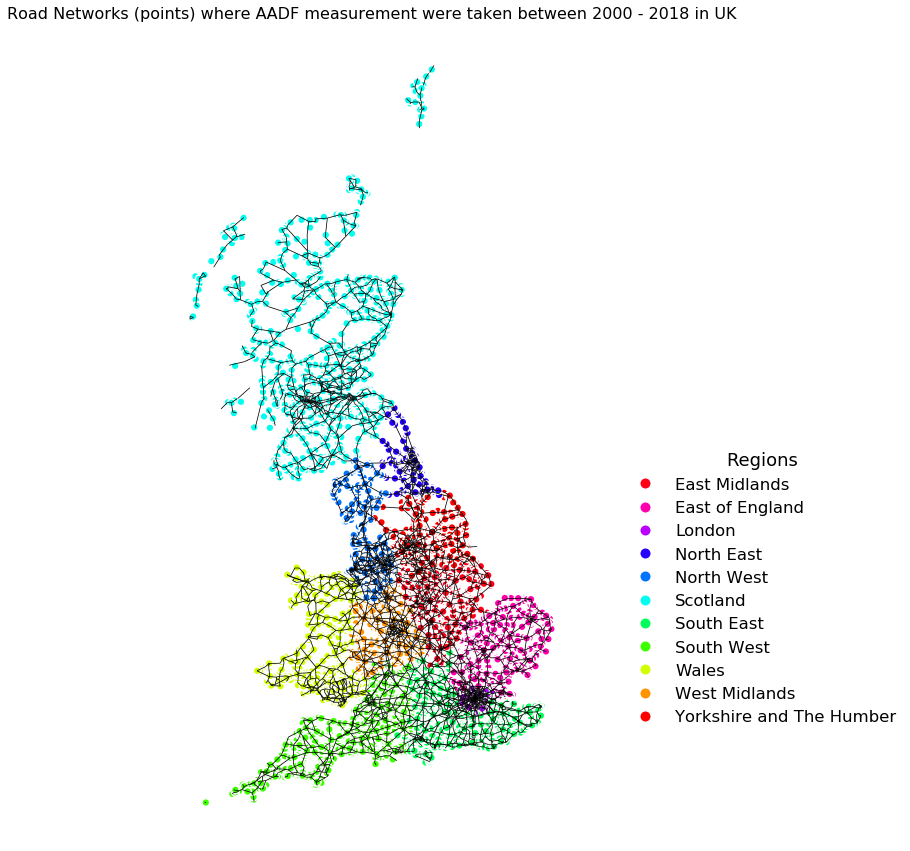
This project entails performing in-depth descriptive analysis and data visualization on the United Kingdom road traffic (2000 - 2018) and accident dataset (2005 - 2014) and further forecasting / predicting the rate of accident for the next two years based on the available time series dataset.
It is recommended to view the notebook using nbviewer as most of the plots and figures are interactive, the nbviewer links for each category (notebook) is provided below.
This project is broken down into 3 categories:
1. Road Traffic Analytics and Visualization uk_road_traffic
- This aspect of the project takes a detailed look into United Kingdom (UK) long-term road traffic trends between 2000 - 2018 based on estimated Annual average daily flows (AADFs) and volume of traffic (i.e. miles driven per year for each vehicle on a particular road) for vehicle types, road networks, geographical regions, road types and highway authorities.
2. Road Accident Analytics and Visualization uk_road_accident
- This aspect of the project takes a detailed look into United Kingdom (UK) long-term road accident trends between 2005 - 2014, which includes but not limited to potential casualties due to road accidents, areas most affected by accidents, highway authorities notorious for road accidents and those that are the "safest", conditions likely to cause accidents and road types and geographical regions well known for accidents.
3. Timeseries forecasting of the rate of road accident in UK for the next 2 years. TimeSeries Forecast
-
The aim of this part is to use statistical and machine learning models to forecast the number of casualties due to road accidents 2 years into the future based on the available dataset, also this project entails experimenting on the different kinds of Long-Short Term Memory (LSTM) Neural Networks (i.e. LSTM, GRU - Gated recurrent units, Bidirectional LSTM and Convolutional LSTM) and trying to see if they can learn from the small time series dataset.
- For this project we will use the following models for forecasting:
-
SARIMA (Seasonal - Autoregressive Integrated Moving Average)
-
Facebook Prophet
-
LSTM (Long Short Term Memory) Networks:
- LSTM
- GRU (Gated Recurrent Units)
- Bidirectional LSTM
- Convolutional LSTM
-
- For this project we will use the following models for forecasting:
- Pandas
- Numpy
- Sci-kit learn
- Statsmodels
- Pmdarima
- Plotly
- GeoPandas
- Keras
- Facebook Prophet
- Matplotlib
Analytics Results and Visualization (Just a few insightful visualizations.....check the notebooks for more insights)
- Model training results (Train data == '2005-01-01' - '2013-12-01'; Test Data == '2014-01-01' - '2014-12-01';)
- Model evaluation metrics MAE -- Mean Absolute Error MAPE -- Mean Absolute Percentage Error
| Models | MAE | MAPE % |
|---|---|---|
| SARIMA | 27.3 | 5.18 |
| Facebook Prophet | 9.45 | 1.79 |
| LSTM | 21.54 | 4.21 |
| GRU | 20.87 | 4.04 |
| Bidirectional LSTM | 21.40 | 4.18 |
| Convolutional LSTM | 20.98 | 4.10 |
-
From the above tables, Facebook Prophet outperforms other models to become the best model for our timeseries forecast, LSTM and GRU models were not able to generalize well enough on the out-of-sample because of the SMALL SIZE (120 data rows) of the data after aggregating the data into monthly data. Interestingly, despite the fact that SARIMA model performed worst based on the MAE nad MAPE, it was still able to generalize well when we plotted the predicted value alongside the actual value.
-
Overall, only SARIMA and Facebook Prophet were used to forecast the accident rates for the next 2 years, simply because LSTM models weren't able to generalize well on un-seen data (after long hours of trials and experimenting with the LSTM hyperparameters). As a result, of this we didn't use them for forecasting.


