This is a program to implement neural search on datasets using vector embeddings. The objective is to fetch datasets according to the given requirements.
- Vector Embeddings: Utilizes advanced sentence transformers to convert text data into high-dimensional vector embeddings, enabling efficient and accurate search capabilities.
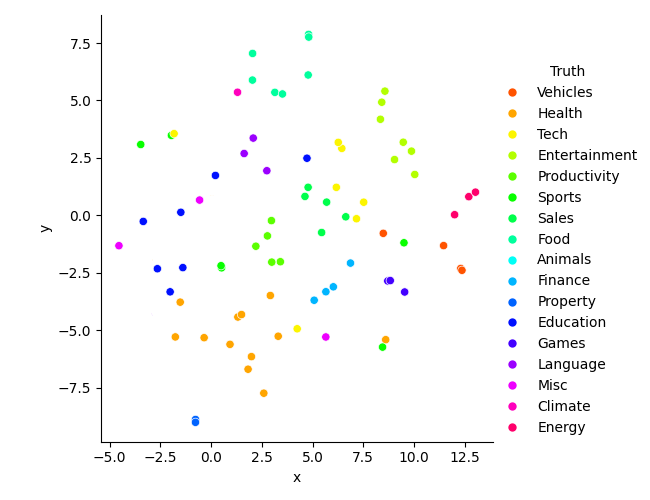
- Dimensionality Reduction: Applies techniques like TSNE and PCA to reduce the dimensionality of embeddings, making it easier to visualize and interpret the data.
- Visualization: Generates various plots to help understand the data and embeddings, including:
- 2D Scatter Plot: Visualizes the reduced-dimensional embeddings in a 2D space.
- Heatmap: Displays the similarity matrix of embeddings.
- Bar Plot: Highlights the most relevant words based on TF-IDF scores.
- Pair Plot: Shows pairwise relationships in the dataset.

- 2D Scatter Plot: Visualizes the reduced-dimensional embeddings in a 2D space.
- TF-IDF Analysis: Performs TF-IDF analysis to identify and visualize the most relevant words in the dataset, helping to understand the key terms and their importance.


To get started with Neural Dataset Search, follow these steps:
-
Clone the repository:
git clone https://github.com/AshwinDEM/NeuralDataHunt.git cd NeuralDataHunt -
Create a virtual environment:
python -m venv venv
venv\Scripts\activate
-
Install the required dependencies:
pip install -r requirements.txt
-
Prepare your dataset: Ensure your dataset is in CSV format and properly preprocessed.
-
Run the main script:
python main.py
-
Visualize the results: The script will generate various plots to help you understand the embeddings and the relevance of different words in your dataset.
-
Plot the most frequent words among the top 30 TF-IDF words:
from src.drawfinal import plot_top_tfidf_words
plot_top_tfidf_words('data/data3.csv')
Here is an example workflow:
-
Load your own dataset:
import pandas as pd
df = pd.read_csv('data/data3.csv')
-
Preprocess the text data:
df['Tags'] = df['Tags'].apply(lambda x: ', '.join(x.strip('[]').split(';')))
df['combined_text'] = df.apply(
    lambda row: f"Col1: {row['Col1']} | Col2: {row['Col2']} | Col3: {row['Col3']} | Col4: {row['Col4']}",
    axis=1
)
df['combined_text'] = df['combined_text'].apply(lambda x: x.lower())
-
Apply TF-IDF and visualize the top words:
from src.drawfinal import plot_top_tfidf_words
plot_top_tfidf_words('data/data3.csv')
Contributions are welcome! Please open an issue or submit a pull request for any improvements or bug fixes.