Features:
- Efficient Deployment: Initiate testing through Docker-compose for quick and streamlined server deployment.
- Comprehensive Monitoring: Detailed bug analysis is made possible through integration with Elastic Search and Kibana, ensuring consistent performance tracking.
- Real-Time Notifications: Configurable Lark webhooks provide instant test messages in your Instant Messaging (IM) app, keeping you informed on-the-go.
- Simplified Validation: Simply copy original queries to validate.py in Python to perform straightforward validation.
You need Java version 11 to run the GDsmith.
$ java --version
openjdk 11.0.19 2023-04-18
OpenJDK Runtime Environment (build 11.0.19+7-post-Ubuntu-0ubuntu122.04.1)
OpenJDK 64-Bit Server VM (build 11.0.19+7-post-Ubuntu-0ubuntu122.04.1, mixed mode, sharing)
Then run the GDsmith.jar in the query_producer. The following command will produce 100 files in query_producer/logs/composite. You can change the num-thread and num-tries to speed up the generation.
$ cd query_producer
$ java -jar GDsmith.jar --num-tries 100 --num-queries 5000 --algorithm compared3 --num-threads 16 compositeNow you need to start the database servers. We have already provided the docker-compose file, since Nebula requires a cluster, you have to start the Nebula cluster first.
$ cd nebula-docker-compose
$ docker compose up -d
Then go back to the project root, you just need to enter docker compose up -d, the testing will start.
$ docker build -t pt .
$ docker compose up -d
[+] Running 12/12
 ✔ Container elasticsearch                           Running                                             0.0s
 ✔ Container pattern-transformer-cypher2gremlin-1    Running                                             0.0s
 ✔ Container kibana                                  Running                                             0.0s
 ✔ Container pattern-transformer-nebula_client-1     Running                                             0.0s
 ✔ Container logstash                                Running                                             0.0s
 ✔ Container pattern-transformer-tinkerpop_client-1  Started                                             0.8s
 ✔ Container pattern-transformer-redis-stack-1       Ru...                                               0.0s
 ✔ Container pattern-transformer-memgraph-1          Runni...                                            0.0s
 ✔ Container pattern-transformer-redis_client-1      R...                                                0.0s
 ✔ Container pattern-transformer-memgraph_client-1   Running                                             0.0s
 ✔ Container pattern-transformer-neo4j-1             Running                                             0.0s
✔ Container pattern-transformer-neo4j_client-1 R... 0.0s You can monitor the runtime logs in docker shell, or watching the logs folder.
First you can see what containers we have:
NAME                                     IMAGE                                                 COMMAND                  SERVICE             CREATED             STATUS              PORTS
elasticsearch                            docker.elastic.co/elasticsearch/elasticsearch:8.8.1   "/bin/tini -- /usr/l…"   elasticsearch       14 hours ago        Up 14 hours         0.0.0.0:9200->9200/tcp, :::9200->9200/tcp, 0.0.0.0:9300->9300/tcp, :::9300->9300/tcp
kibana                                   docker.elastic.co/kibana/kibana:8.8.1                 "/bin/tini -- /usr/l…"   kibana              14 hours ago        Up 14 hours         0.0.0.0:5601->5601/tcp, :::5601->5601/tcp
logstash                                 docker.elastic.co/logstash/logstash:8.8.1             "/usr/local/bin/dock…"   logstash            14 hours ago        Up 14 hours         0.0.0.0:5044-5045->5044-5045/tcp, :::5044-5045->5044-5045/tcp, 9600/tcp
pattern-transformer-cypher2gremlin-1     pattern-transformer-cypher2gremlin                    "java -jar demo-0.0.…"   cypher2gremlin      14 hours ago        Up 14 hours         0.0.0.0:8085->8080/tcp, :::8085->8080/tcp
pattern-transformer-memgraph-1           memgraph/memgraph-platform:latest                     "/bin/sh -c '/usr/bi…"   memgraph            14 hours ago        Up 14 hours         0.0.0.0:3000->3000/tcp, :::3000->3000/tcp, 0.0.0.0:7688->7687/tcp, :::7688->7687/tcp
pattern-transformer-memgraph_client-1    pt                                                    "bash ./scripts/run_…"   memgraph_client     14 hours ago        Up 17 minutes
pattern-transformer-neo4j-1              neo4j:5.6.0-enterprise                                "tini -g -- /startup…"   neo4j               14 hours ago        Up 14 hours         0.0.0.0:7474->7474/tcp, :::7474->7474/tcp, 7473/tcp, 0.0.0.0:7687->7687/tcp, :::7687->7687/tcp
pattern-transformer-neo4j_client-1       pt                                                    "bash ./scripts/run_…"   neo4j_client        14 hours ago        Up About an hour
pattern-transformer-redis-stack-1        redis/redis-stack:6.2.6-v7                            "/entrypoint.sh"         redis-stack         14 hours ago        Up 14 hours         0.0.0.0:6379->6379/tcp, :::6379->6379/tcp, 8001/tcp
pattern-transformer-redis_client-1       pt                                                    "bash ./scripts/run_…"   redis_client        14 hours ago        Up 2 hours
pattern-transformer-tinkerpop_client-1   pt                                                    "bash ./scripts/run_…"   tinkerpop_client    14 hours ago        Up 9 minutes
Take neo4j as an example, you can see the logs by the following commands:
$ docker compose logs -f neo4j_clientYou can see the files similar to the following. Each *.tsv contains the logic error that we found, each *.log contains the full logs of the runtime, and *.json contains 10 max performance inconsistency query pairs.
$ tree logs
logs
├── memgraph.log
├── memgraph_performance.json
├── nebula.log
├── nebula_logic_error.tsv
├── nebula_performance.json
├── neo4j.log
├── neo4j_performance.json
├── redis.log
├── redis_logic_error.tsv
├── redis_performance.json
├── tinkerpop.log
└── tinkerpop_logic_error.tsv

0 directories, 12 files- Testing Interruptions: The testing process may encounter interruptions when queries request a large volume of data, which could overburden the graph databases.
- Database Crashes: If a query triggers a crash or kernel bug within the database, the database may terminate unexpectedly. Although we have implemented an auto-restart strategy, we cannot guarantee a successful restart every time.
If these happen, you have to restart it manually.
$ docker compose restart neo4j_clientFor a more detailed explanation and additional information, please refer to the subsequent README file.
├── configs                             # configurations
├── cypher                             # cyper generator
├── cypher2gremlin                     # an individual java project to transform cypher into gremlin
├── database_tests                     # main test logic controllers
├── db.json                            # a file that record the testing process
├── docker-compose.yaml
├── Dockerfile
├── elk                                # elk toolkits for monitoring the testing process
├── evaluation                         # evaluations for paper
├── gdb_clients                        # client stubs for the GDB server.
├── logs                               # general logs, performance logs and logic bug log.
├── mutator                            # implementation of mutator
├── nebula-docker-compose              # an individual folder for establish the nebula database
├── query_file                          # a testing data dir
├── query_producer                     # a path that store the queries we used in the test
├── README.md
├── requirements.txt
├── scripts                            # scripts for quick start testing
└── webhook                            # webhooks for sending warning and error message to lark
The detailed testing procedure is archived in the database_tests directory. Let's delve deeper into its structure. Within database_tests, there are five subdirectories representing different databases: memgraph, nebula, neo4j, redis, and tinkerpop. As the testing procedures across these databases bear a lot of similarities, we've abstracted the overall process into a convenient script named helper.py. This allows for a uniform testing approach across different databases, improving efficiency and consistency.
├── helper.py
├── memgraph
│   ├── TestMemGraph.py
│   └── validator.py
├── nebula
│   ├── nebula.txt
│   ├── TestNebula.py
│   ├── test_nebula_simple.py
│   └── validator.py
├── neo4j
│   ├── TestNeo4j.py
│   └── validator.py
├── redis
│   ├── TestRedis.py
│   └── validator.py
└── tinkerpop
    ├── TestTinkerpop.py
    └── validator.py
In helper.py, we use general_testing_procedure to show the general proedures of metamorphic testing. Each distinct database only needs to pass the corresponding configurations into the general_testing_procedure.
Currently, we have the following configurable parameters:
- Mode of Testing:
live: Sends messages directly to your Instant Messaging (IM) application.debug: Runs local tests on a single file.normal: Performs tests without sending messages to IM.
- report: Defines the IM reporting function and webhook token.
- transform_times: Sets the number of transformations to be carried out.
- client: Identifies the client for a given graph database.
- logger: Defines the logger.
- source_file: Specifies the input file that contains query clauses.
- logic_inconsistency_trace_file: Points to the logic bug output file.
- database_name: Indicates the name of the database.
- mutator_func: Sets the mutation strategy.
- query_producer_func: Defines the approach to handling the query file.
- oracle_func: Identifies the oracle.
class TestConfig:
    def __init__(self, **kwargs):
        self.mode = kwargs.get('mode', 'live')
        self.report = kwargs.get('report', post)
        self.report_token = kwargs.get('report_token')
        self.transform_times = kwargs.get('transform_times', 5)

        self.client: GdbFactory = kwargs.get('client')
        self.logger: Logger = kwargs.get('logger')
        self.source_file = kwargs.get('source_file')
        self.logic_inconsistency_trace_file = kwargs.get('logic_inconsistency_trace_file')
        self.database_name = kwargs.get('database_name')

        self.mutator_func: Callable[[str], str] = kwargs.get('mutator_func', QueryTransformer().mutant_query_generator)
        self.query_producer_func = kwargs.get('query_producer_func', lambda: ([], []))
        self.oracle_func: Callable[[TestConfig, any, any], None] = kwargs.get("oracle_func")

        # temp val for consistency checker
        self.q1 = None
        self.q2 = None

self.num_bug_triggering = 0We provide the elk toolkits, you can find it in elk folder. By running the docker compose up -d, you have started elasticsearch, kibana, and logstash. However, there is no input data(log) yet, so you have to manually configure the filebeat, sending the log file to the elasticserach.
You can follow the official instructions at https://www.elastic.co/beats/filebeat
We also provide a template configuration for your reference.
filebeat.inputs:

- type: log
  paths:
    - /home/replace-with-your-path/logs/*.log

filebeat.config.modules:
  path: ${path.config}/modules.d/*.yml
  reload.enabled: false
setup.ilm.overwrite: true
setup.template.settings:
  index.number_of_shards: 1
setup.kibana:
  host: "localhost:5601"
output.elasticsearch:
  hosts: ["localhost:9200"]
processors:
  - add_host_metadata:
      when.not.contains.tags: forwarded
  - add_cloud_metadata: ~
  - add_docker_metadata: ~
  - add_kubernetes_metadata: ~
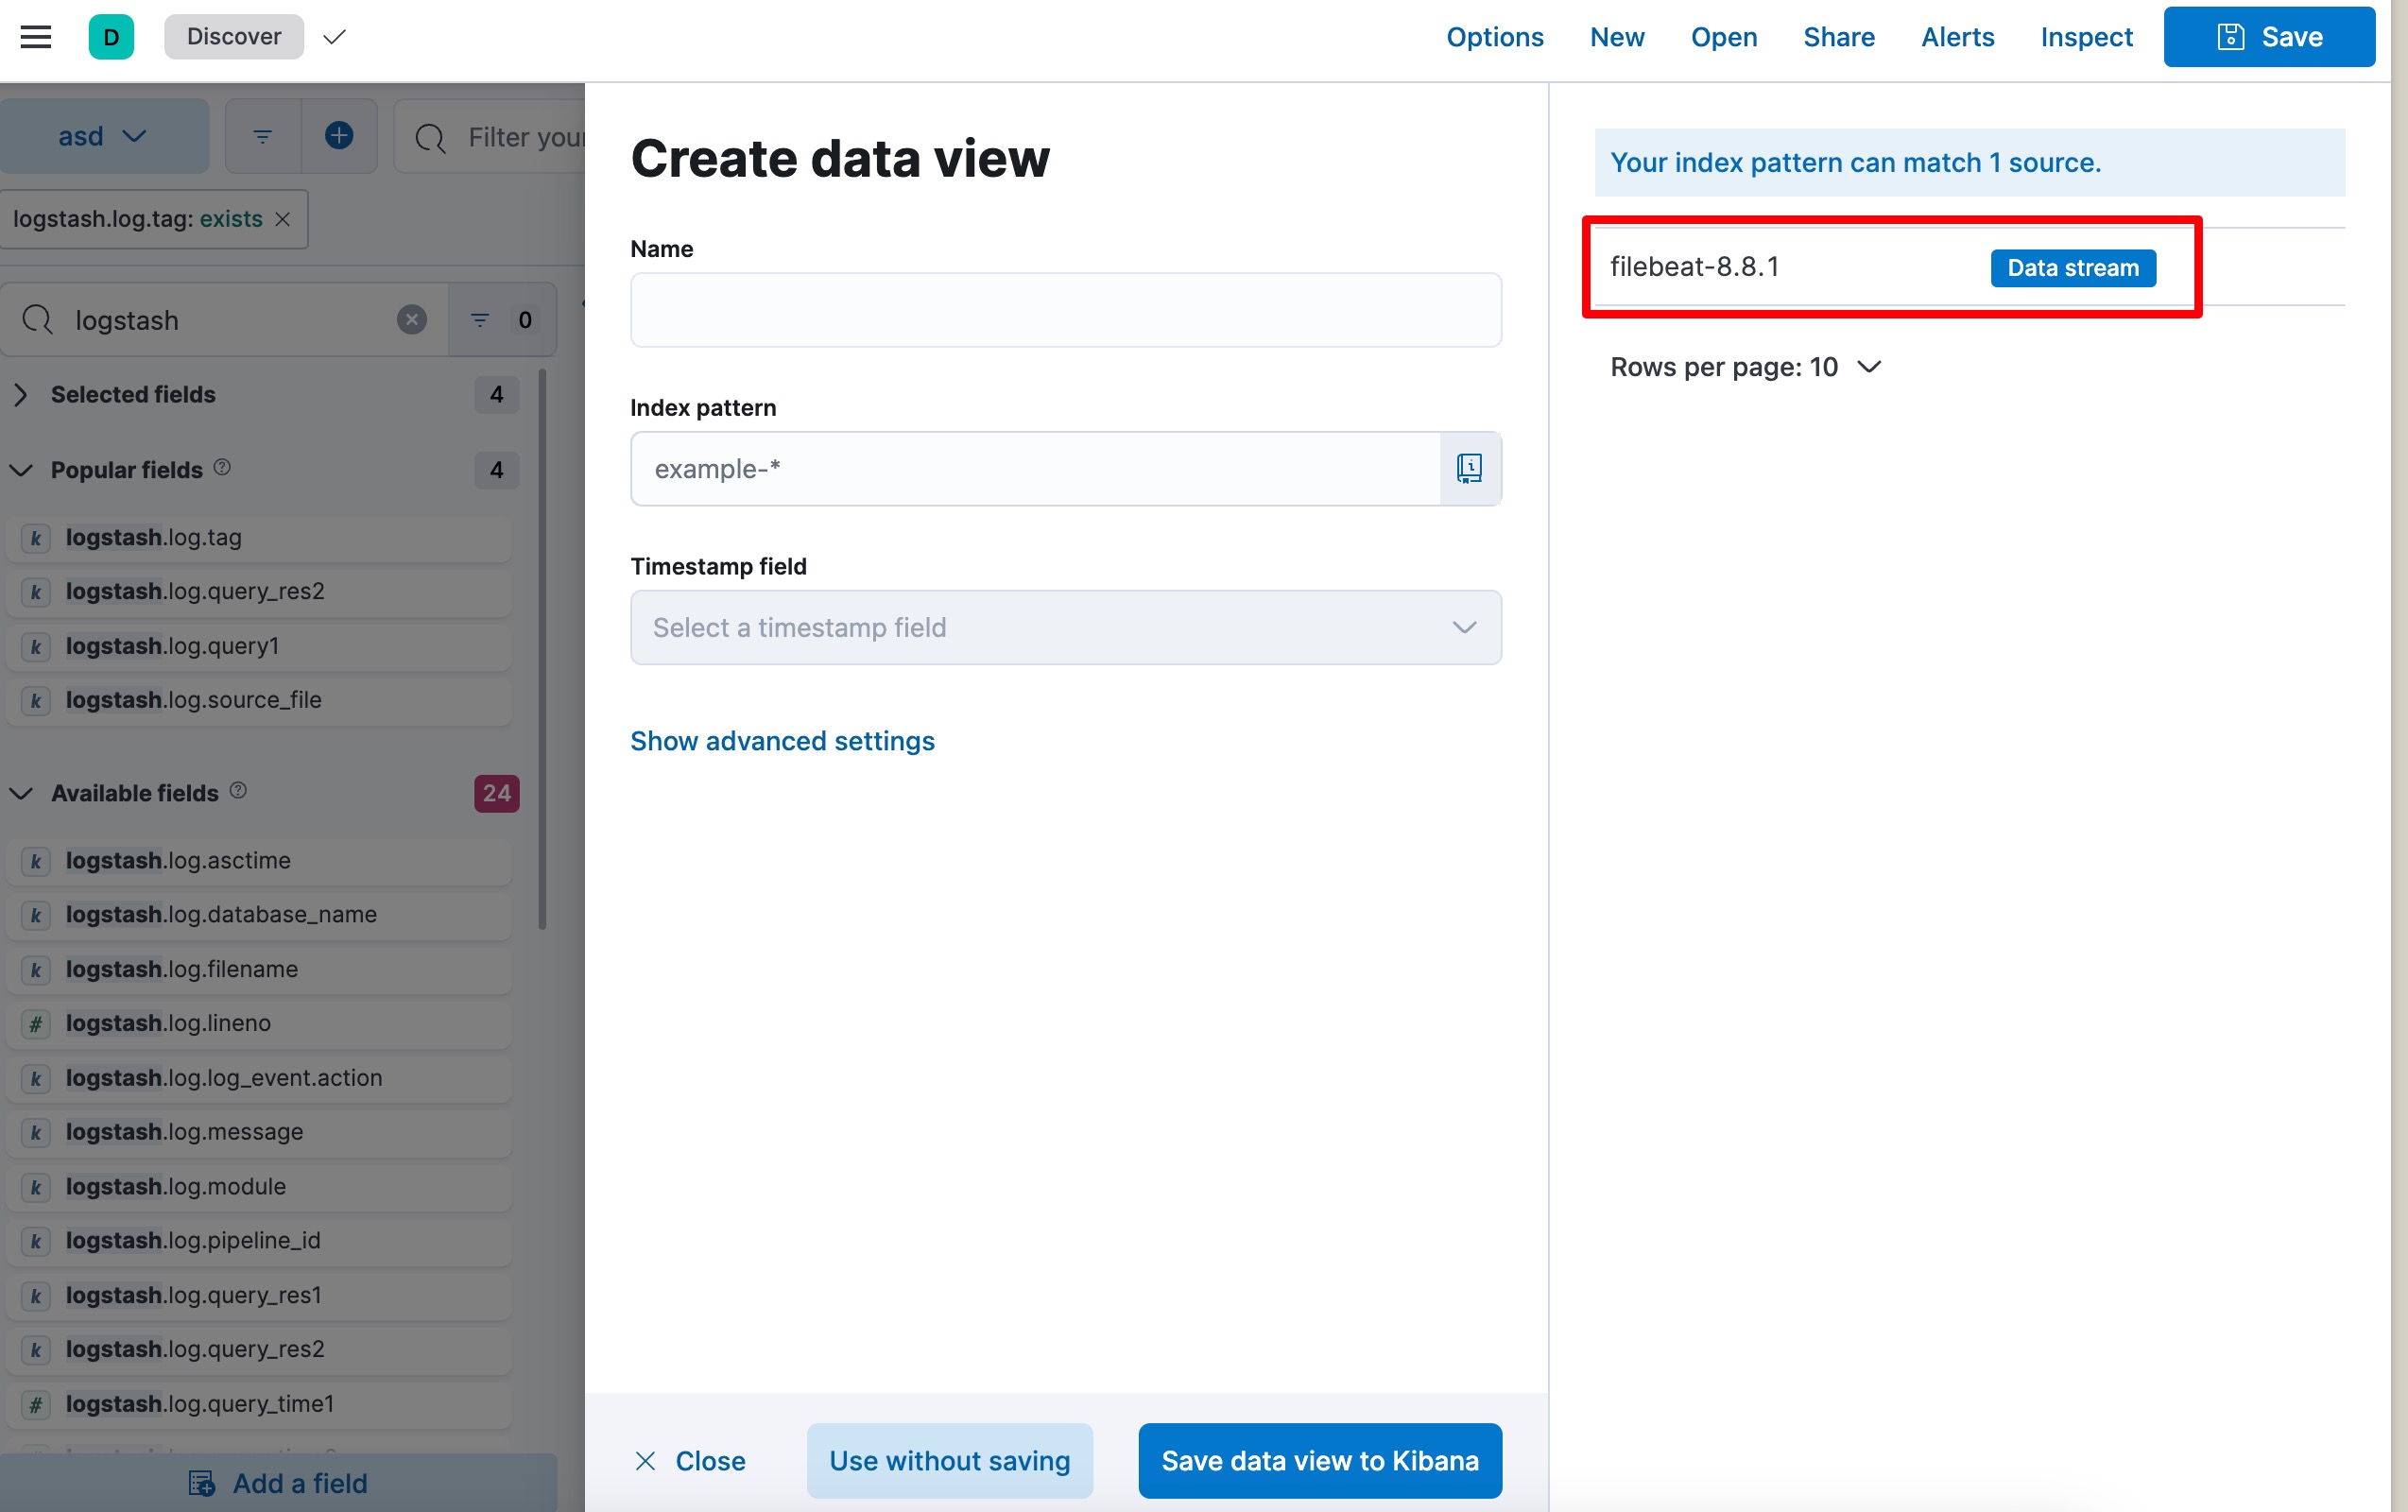
Then configure it in kibana dashboard, you can open the browser, http://localhost:5601
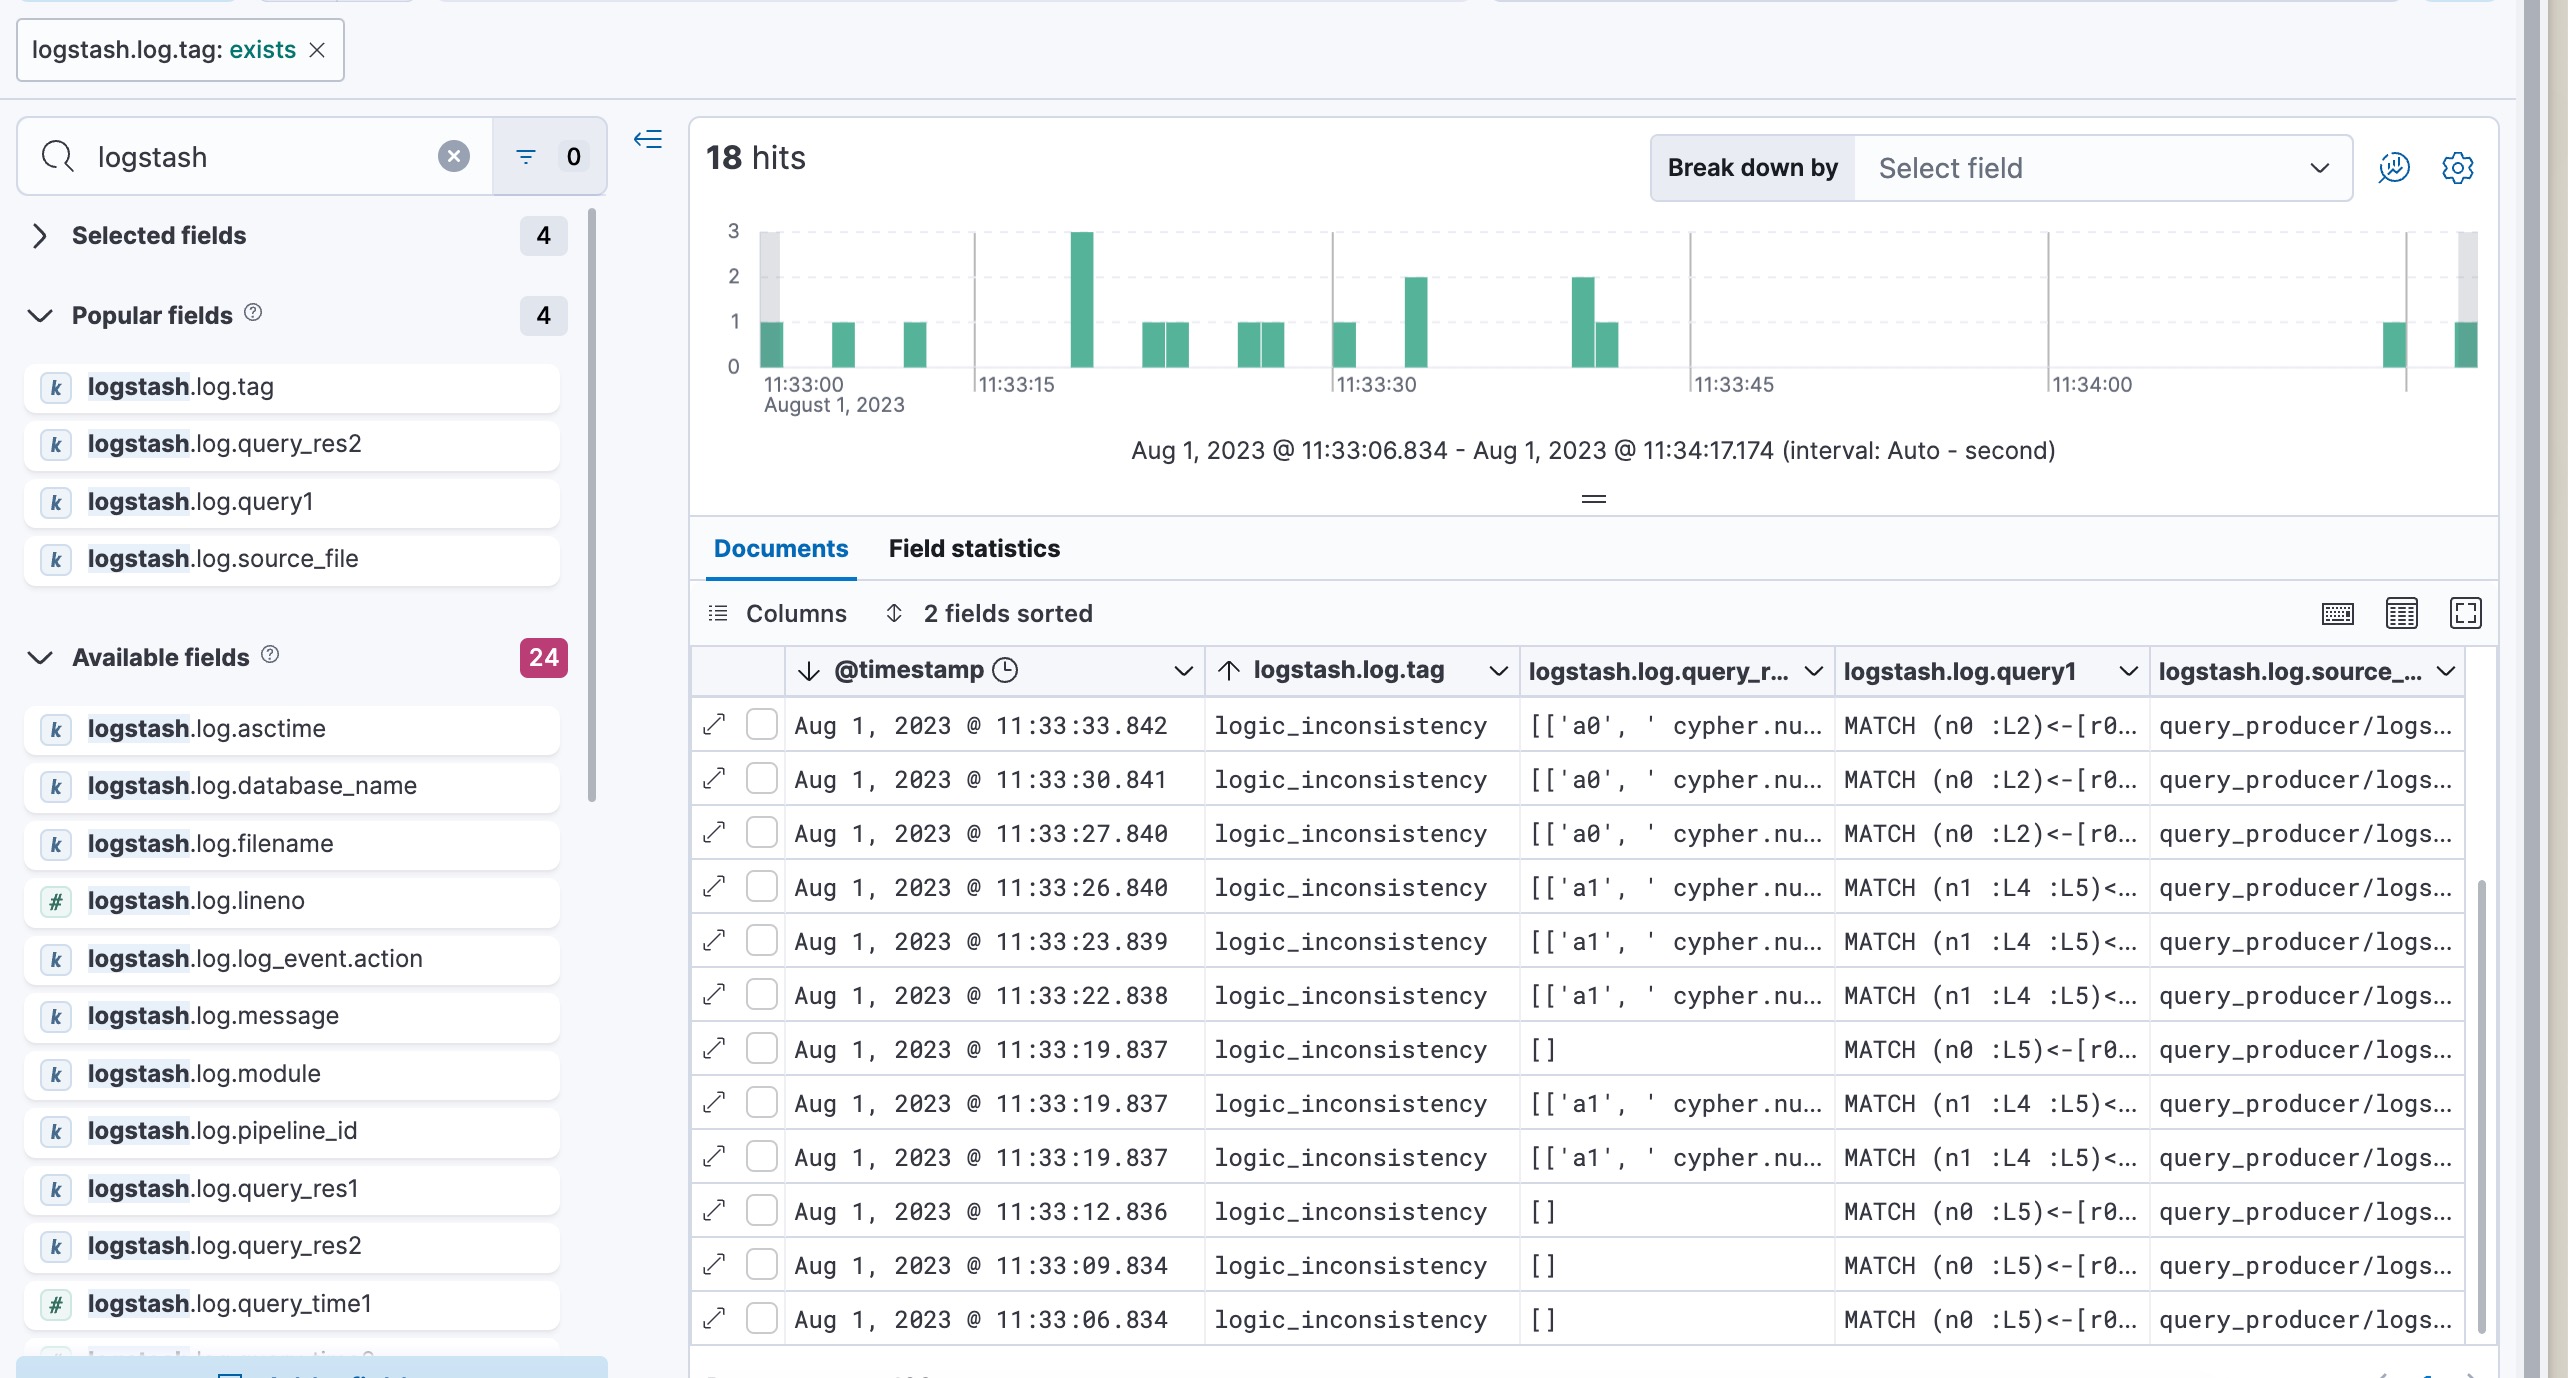
By creating a dataview of filebeat you can have a table of these bugs
Then, search the logstash.log metric, and add it to the table. You can see the following image:
We utilize the GDsmith as the cypher generator, we also implement our own cypher and gremlin generator. To control the behavior, you can change the config.ini.
[memgraph]
uri = memgraph
port = 7687
input_path = query_producer/logs/composite
; you can replace `gdsmith` with `cypher`
generator = gdsmith
We generated the data needed for the evaluation using the following scripts:
evaluation/eval0.py: Evaluates the number of distinct queries and query plans (Q2(a) and Q2(b)).evaluation/eval1.py, Evaluates the number of bug-triggering test cases (Q2(c)).
To reproduce the results for Q2(a) and Q2(b), execute the first script using the following command:
$ docker compose exec -it redis_client bash
root@c8596f7defc9:/appdata# python evaluation/eval0.py
The script will generate four integers, one on each line, in the file evaluation/eval0.res. These integers represent the following, in order:
- Number of distinct queries based on Random Base Queries
- Number of distinct query plans based on Random Base Queries
- Number of distinct queries based on Long Base Queries
- Number of distinct query plans based on Long Base Queries
To reproduce the results for Q2(c), run the second script with:
$ docker compose exec -it redis_client bash
root@c8596f7defc9:/appdata# python evaluation/eval1.py
This will output a single integer into the file evaluation/eval1.res, representing:
- Number of bug-triggering test cases
Note that the second script evaluation/eval1.py is expected to be quite time-intensive.
On our testing machine, it took ~12 hours to complete the entire evaluation.
Because two of the bug-inducing test cases are associated with multiple bugs (all bugs in such cases have been confirmed by developers on Discord), the count of bug-inducing cases here slightly varies from the one documented on paper.
TinkerGraph, MemGraph, Neo4j, NebulaGraph, RedisGraph-main, RedisGraph-FalkorDB
🔭: If you use any tools or datasets in this project, please kindly cite the following paper:
- Qiuyang Mang*, Aoyang Fang*, Boxi Yu, Hanfei Chen, and Pinjia He (*: equal contribution). [ICSE'24]
Should you have any questions, please post to the issue page, or email Qiuyang Mang via [email protected].

