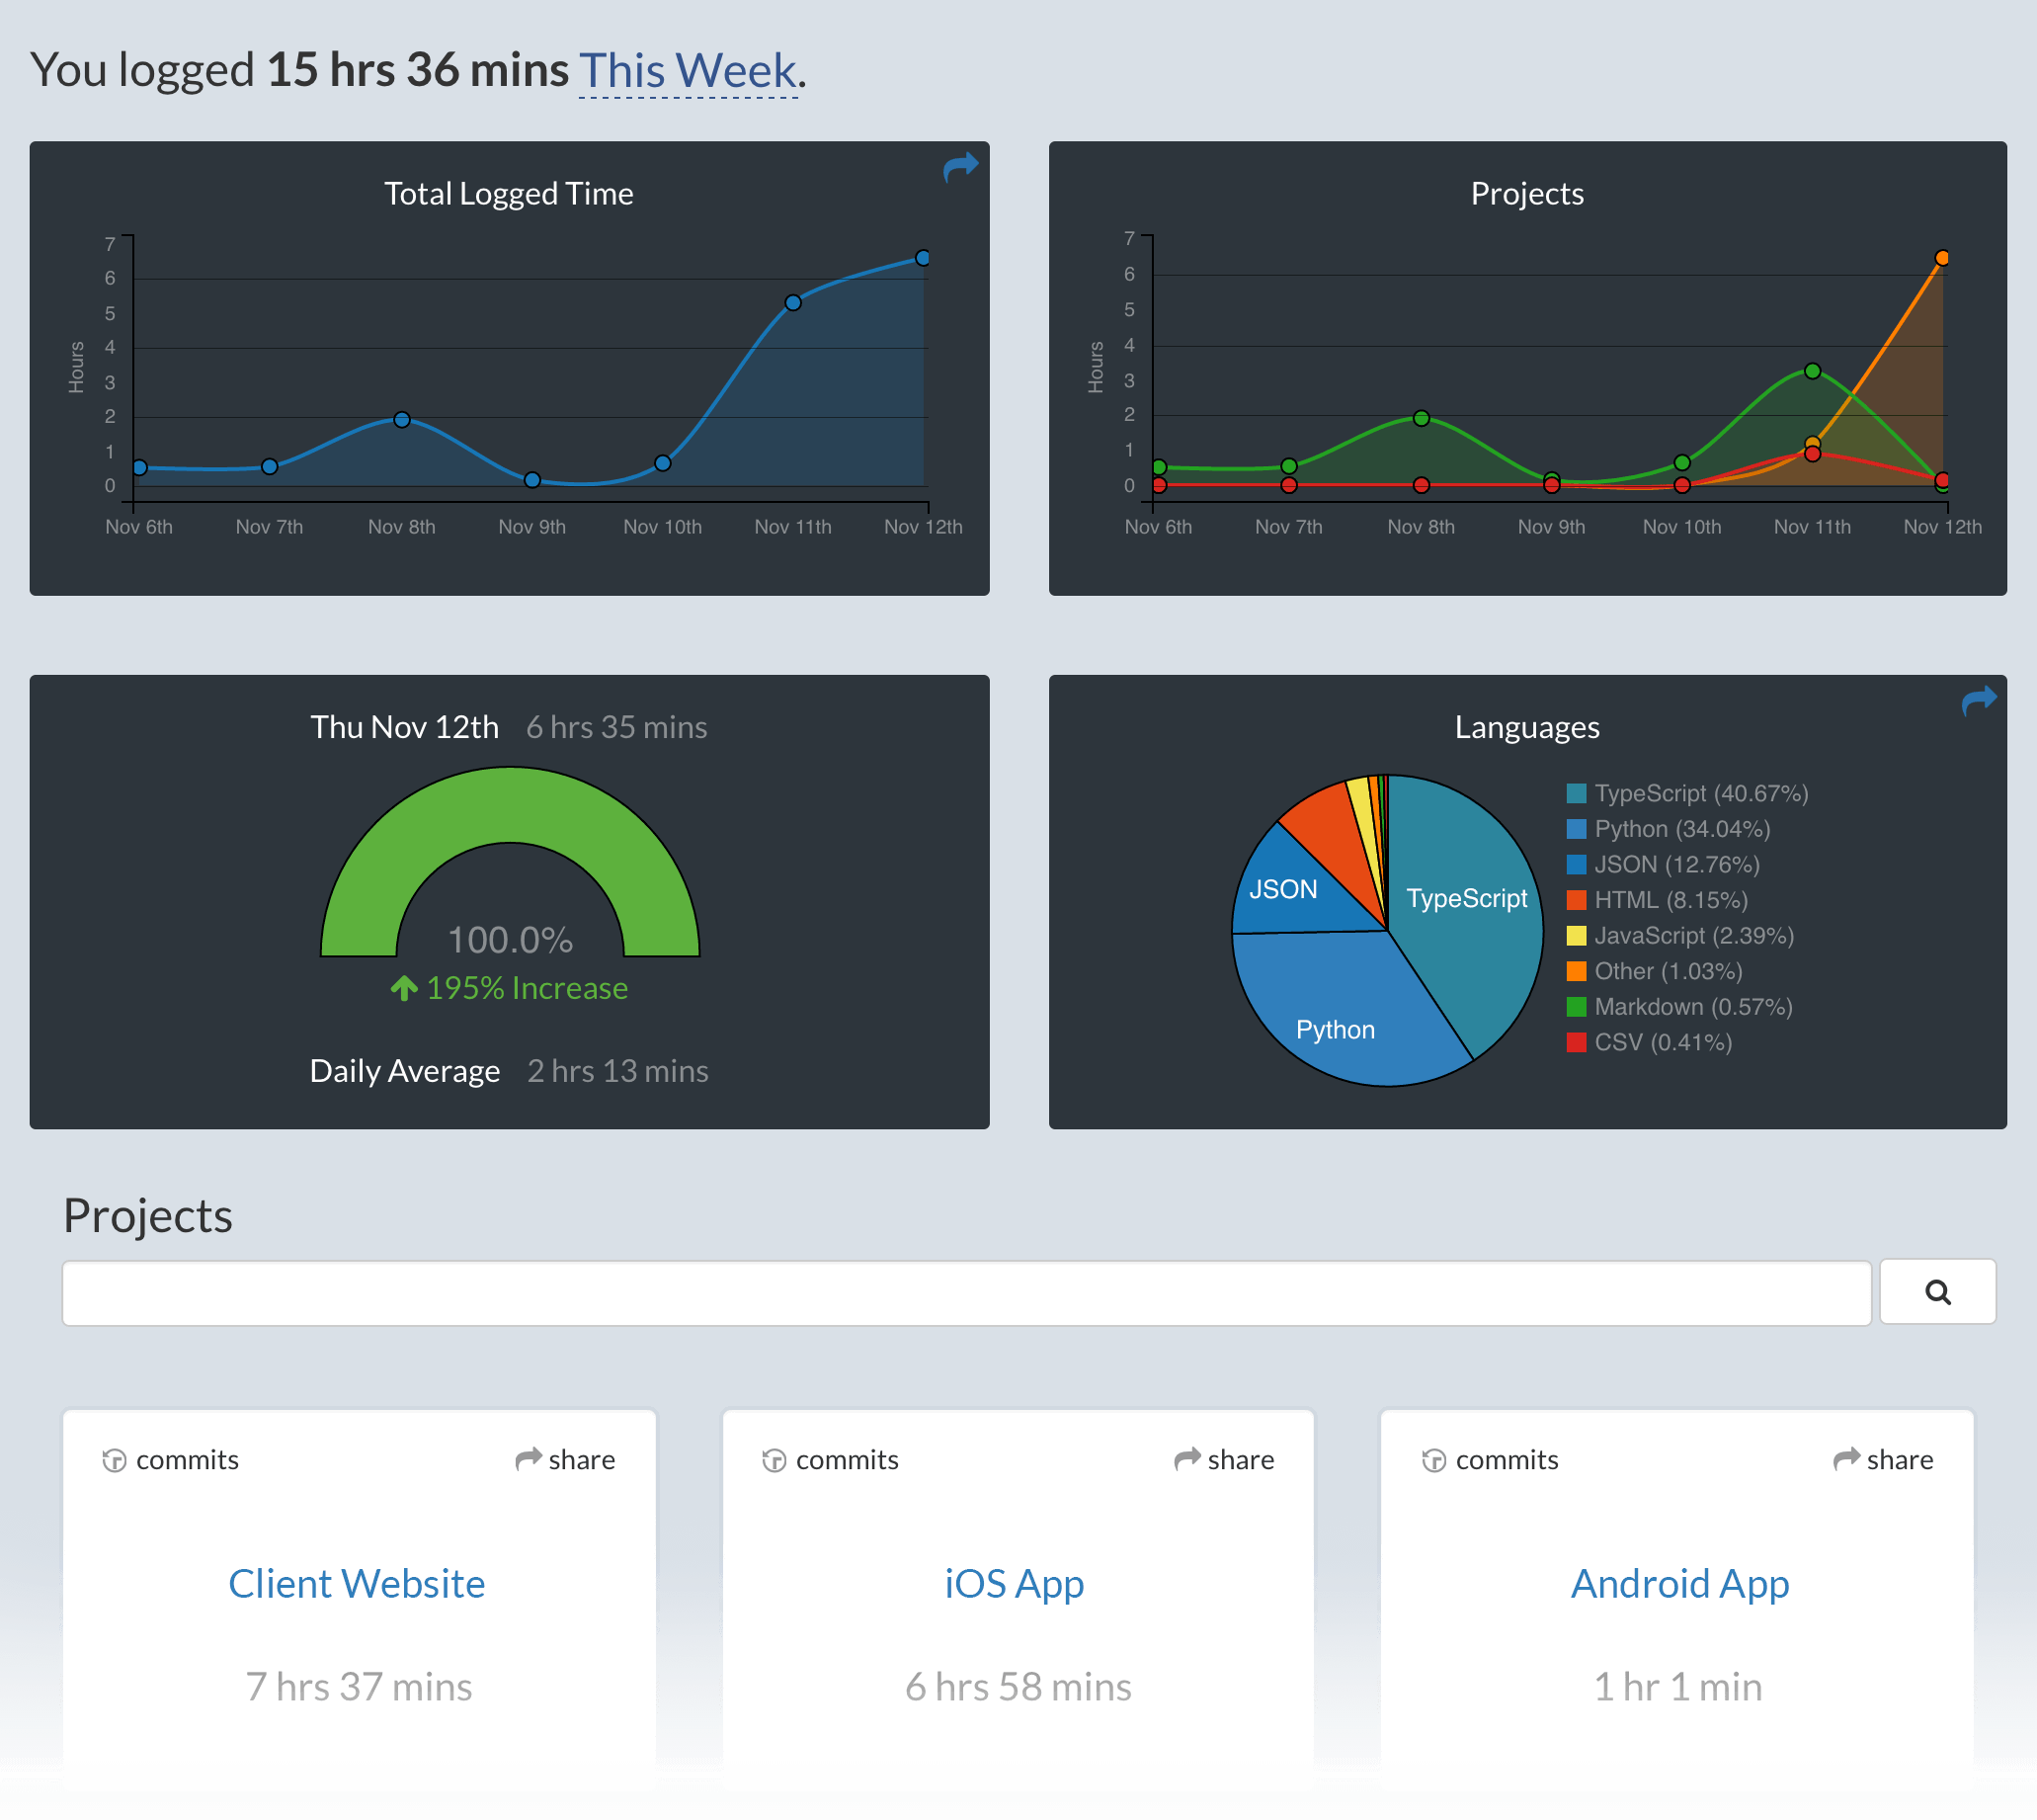
Metrics, insights, and time tracking automatically generated from your programming activity.
- Press
F1orCMD + Shift + Pand typeinstall. PickExtensions: Install Extension.
- Type
wakatimeand hitenter.
-
Restart Visual Studio Code.
-
Enter your api key, then press
enter.
(If you’re not prompted, press `F1` or `CMD + Shift + P` then type `WakaTime API Key`.)
- Use VSCode and your coding activity will be displayed on your WakaTime dashboard.
Visit https://wakatime.com to see your coding activity.
$WAKATIME_HOMEdefaults to$HOME
Some settings are available from CMD+SHIFT+p, then typing wakatime.
Settings are stored in the INI file at $WAKATIME_HOME/.wakatime.cfg.
More information can be found from wakatime core.
First, turn on debug mode:
- Press CMD+SHIFT+p
- Type
wakatime.debug, and pressEnter. - Select
true, then pressEnter.
Next, open your Developer Console to view logs and errors:
Help → Toggle Developer Tools
Errors outside the scope of vscode-wakatime go to $WAKATIME_HOME/.wakatime.log from wakatime-cli.
The How to Debug Plugins guide shows how to check when coding activity was last received from your editor using the Plugins Status Page.
Microsoft Windows Only: Using WakaTime behind a corporate proxy? Try enabling your Windows Root Certs inside VS Code with the win-ca extension:
Press Ctrl+Shift+X, search for win-ca, press Install.
For more general troubleshooting info, see the wakatime-cli Troubleshooting Section.


