Note: This is a fork of the original Lighthouse Metrics, created by Sigma Prime.
If you are running a Lighthouse node in docker and would like visibility of your docker logs within Grafana, this is for you!
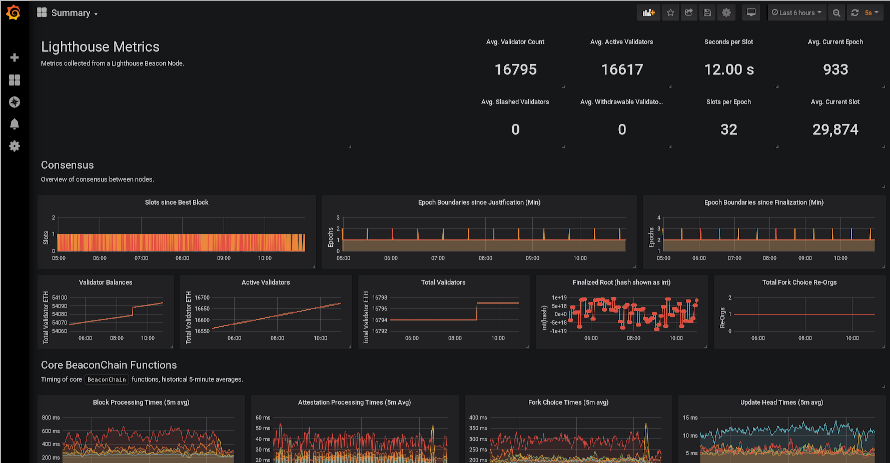
Provides a docker-compose environment which scrapes metrics from Lighthouse
nodes using Prometheus and presents them in a browser-based Grafana GUI.
This also uses Grafana's Loki and Promtail for aggregating docker logs for your running containers.

- Install the docker plugin for Loki on your validator node:
docker plugin install grafana/loki-docker-driver:latest --alias loki --grant-all-permissions
- Start a lighthouse node (beacon or validator) with Docker
- If using
docker runset the log-driver tolokiand set theloki-url. Example:docker run --name validator \ --log-driver=loki \ --log-opt loki-url="http://localhost:3100/loki/api/v1/push" \ - If using Docker Compose it would look something like this:
logging:
    driver: loki
    options:
        loki-url: "http://localhost:3100/loki/api/v1/push"
- Note: The
--metricsflag is required in both cases for Prometheus metrics.
- If using
- Bring the environment up with
$ docker-compose up --build -d. - Ensure that Prometheus can access your Lighthouse node by ensuring it is in
the
UPstate at http://localhost:9090/targets. - Browse to http://localhost:3000
- Username:
admin - Password:
changeme
- Username:
- Add Loki as a new datasource in Grafana. Just set the URL to http://localhost:3100 and click "Save & Test"
- You can now create your own dashboards to show your container logs. See the example /dashboards/ValidatorLogs.json for a starting example or inspiration.
- Import some other dashboards from the
dashboardsdirectory in this repo:- In the Grafana UI, go to
Dashboards->Manage->Import->Upload .json file. - The
Summary.jsondashboard is a good place to start.
- In the Grafana UI, go to
By default Prometheus and Grafana will only bind to localhost (127.0.0.1), in
order to protect you from accidentally exposing them to the public internet. If
you would like to change this you must edit the http_addr in grafana.ini.
Feel free to create your own dashboards, export them and submit them here as PRs.