This software is intended to show how it is possible to integrate Splunk with Greenplum database. It exercises splunk java api
to make searches or to take all logs stored in Splunk and be able to query them also from Greenplum using external tables
This software continues the experiment done here:
https://github.com/DanielePalaia/gpss-splunk
A java script is created, this script is connecting to splunk and printing in consolle splunk logs. The idea is that every host search for a different date range in order to work in parallel.
Then, the script can be embedded in a external web table definition.
I used a DBMS to bring some data into Splunk. I used DBConnect to bring some Greenplum/Postgresql into Splunk. Here you can follow the istructions:
https://subscription.packtpub.com/book/big_data_and_business_intelligence/9781788835237/1/ch01lvl1sec18/getting-data-from-databases-using-db-connect
The data I put into Splunk are of this type:
dashboard=# select * from services limit 5;
id | version | environment | service_level | company_id | top_service | name
------+---------+--------------+------------------------+------------+-------------+------------------------------
2052 | 0 | Production | DC - Basic | 7 | NO | IE-PCAT PRODUCTION-PROD
2053 | 0 | Unknown-null | DC - Mission Critical | 45 | NO | ARCOR SERVERHOUSING
2054 | 0 | Production | DC - Business Standard | 37 | NO | DE-NSS ATOLL-BE DB SYBASE
2055 | 0 | Unknown-null | DC - Business Standard | 49 | NO | VFUK INFRASTRUCTURE SECURITY
2056 | 0 | Unknown-null | DC - Business Standard | 42 | NO | SHARED KPI MEASURING
Once loaded into splunk it will start to generate events and you will start to see logs like this:

Taking in account all informations contained in a splunk log, create an external web table like this:
CREATE EXTERNAL WEB TABLE log_output
(_bkt text, _cd text, serial text, id text, version text, environment text, service_level text, comapany_id text, top_service text, name text, splunk_server text, index text, source text, indextime text, subsecond text, linecount text, si text, hostname text, ip text, source_type text, sourceType text, time text)
EXECUTE '/home/gpadmin/splunk_data.sh' ON HOST
FORMAT 'CSV';
For semplicity I put all fields as text but you can put the data type you want accodingly to the info received
Java needs to be installed on every host of the Greenplum distributed system
In every segment host, you need also to create a .splunkrc in your home directory specifying connection parameters like:
host=localhost
#Splunk admin port (default: 8089)
port=8089
#Splunk username
username=daniele
#Splunk password
password=XXXXXX
#Access scheme (default: https)
scheme=https
#Splunk version number
version=7.2.6
In every segment host you need to specify a segment.properties file where you specify this parameters:
earliest:2019-05-21T00:00:00
latest:2019-05-21T23:59:00
The idea is to specify different time range in different hosts.
Copy the .jar /target/splunk-0.0.1-SNAPSHOT.jar in /home/gpadmin
Create a /home/gpadmin/splunk_data.sh where you simply call the .jar
java -jar /home/gpadmin/splunk-0.0.1-SNAPSHOT.jar "search * | head 100"
In this case will take just the first 100 elements but you can specify more
Just do a SELECT * FROM log_output;
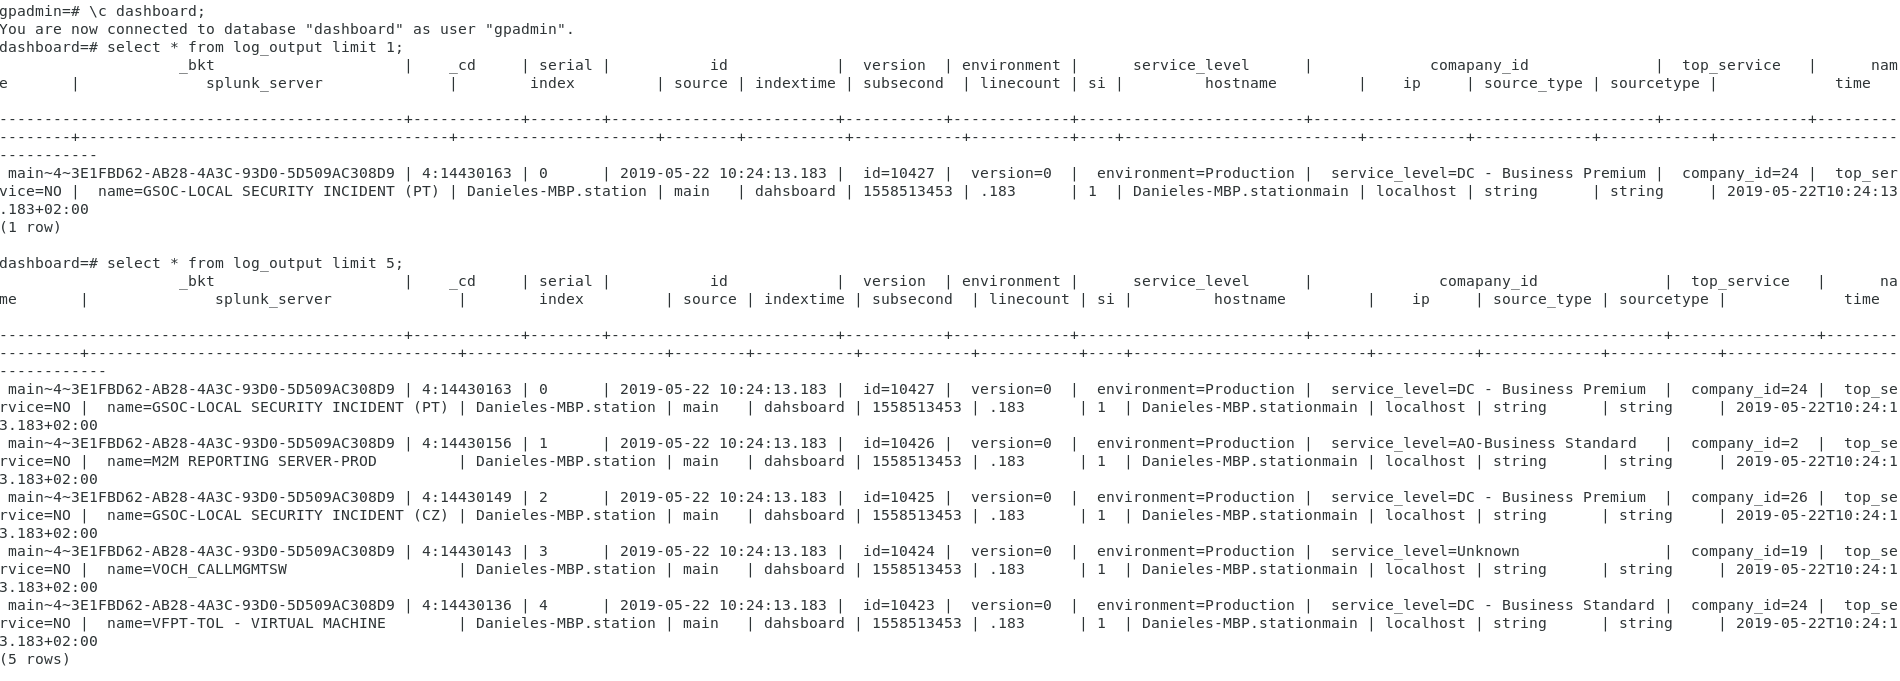
Then the /home/gpadmin/splunk_data.sh which is connecting to splunk and display csv lines will be invoked in order to see in a structured way:
dashboard=# select * from log_output limit 5;
Currently just one segment per host will work. Not fully tested on multiple segments.
If you wish to compile the software you can just mvn install on the root directory
Jar file will be produced inside /target
