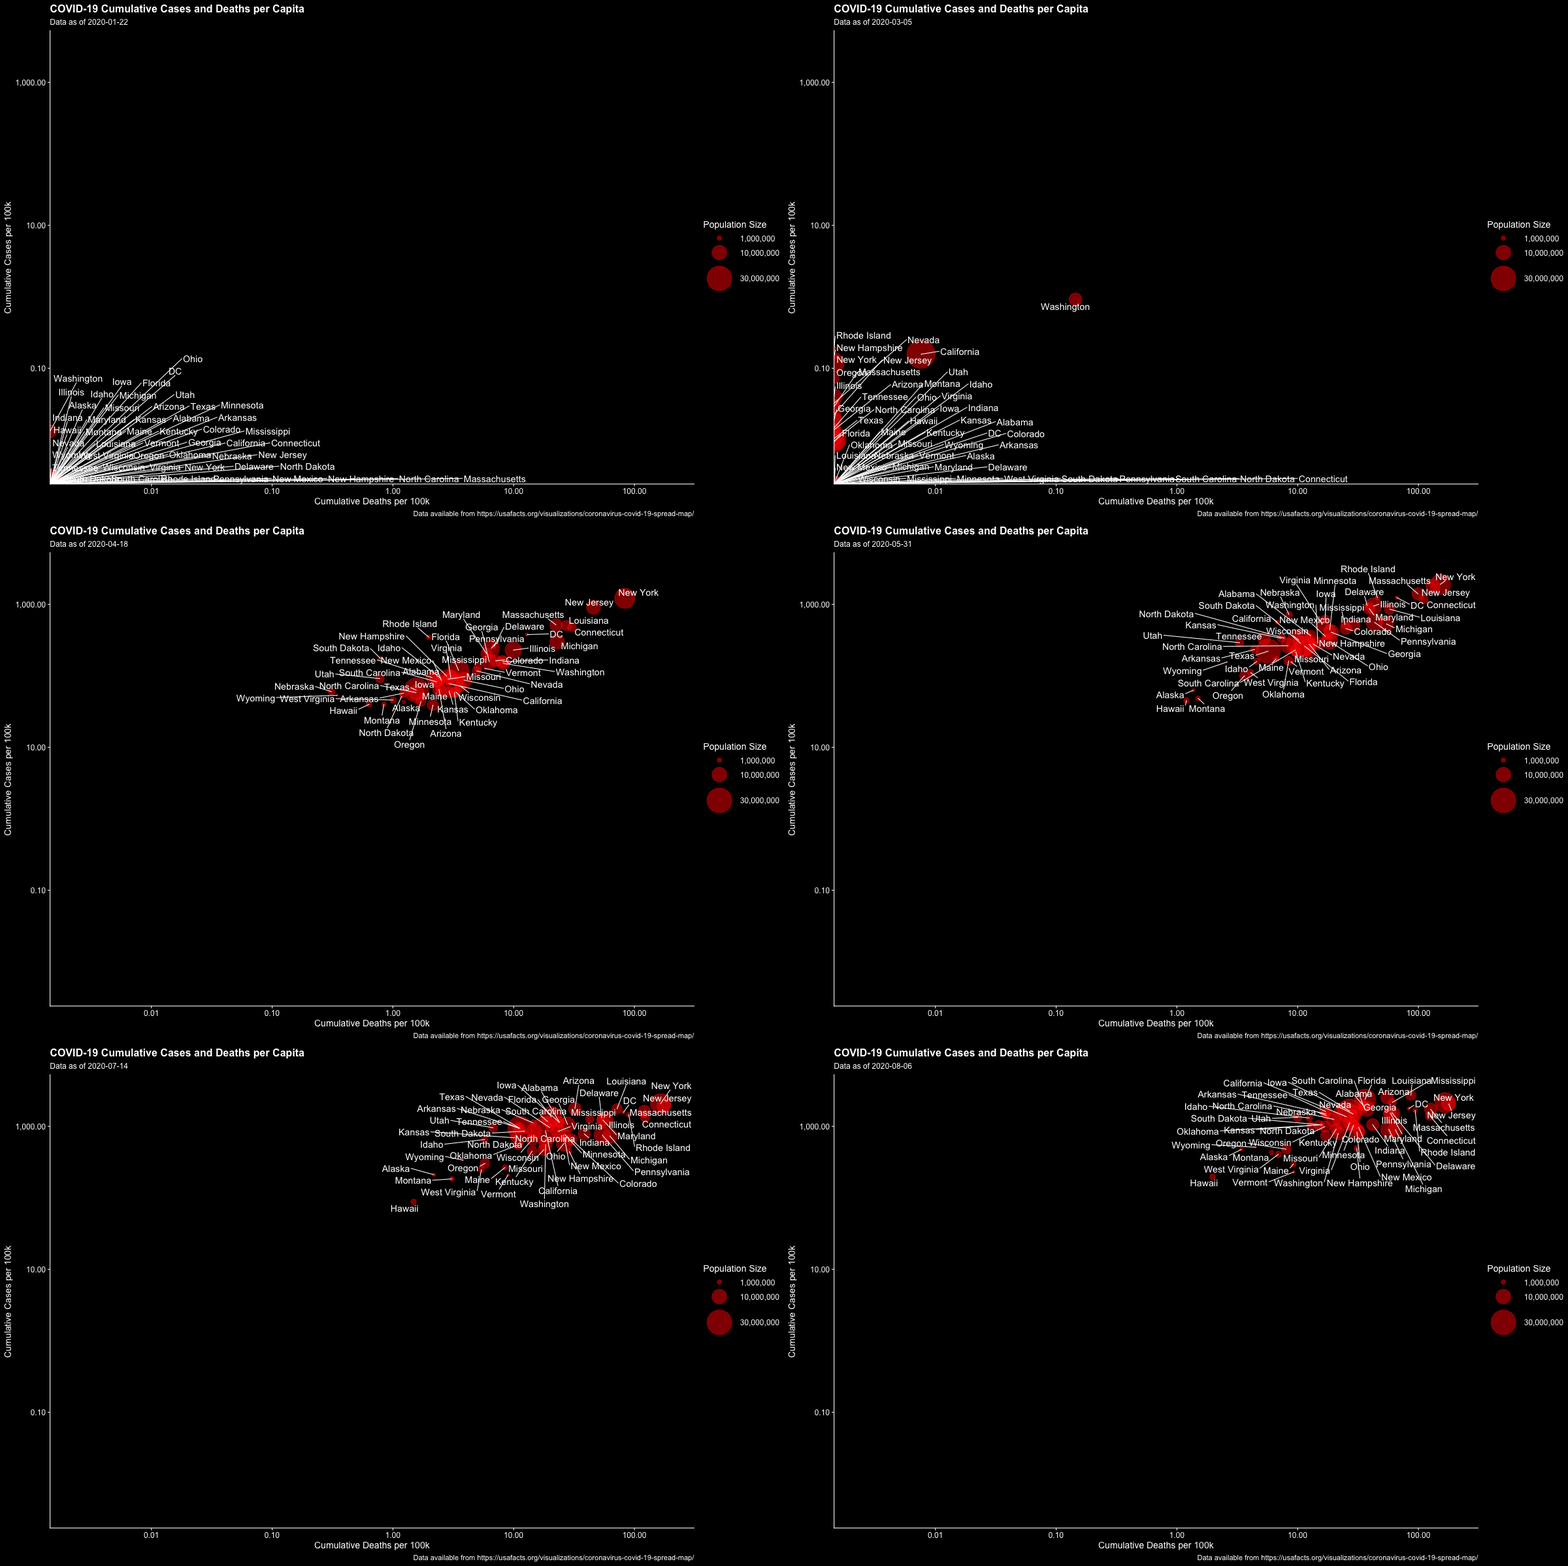
This repository contains the code to produce the following visualizations, based on the USA Facts COVID-19 data.
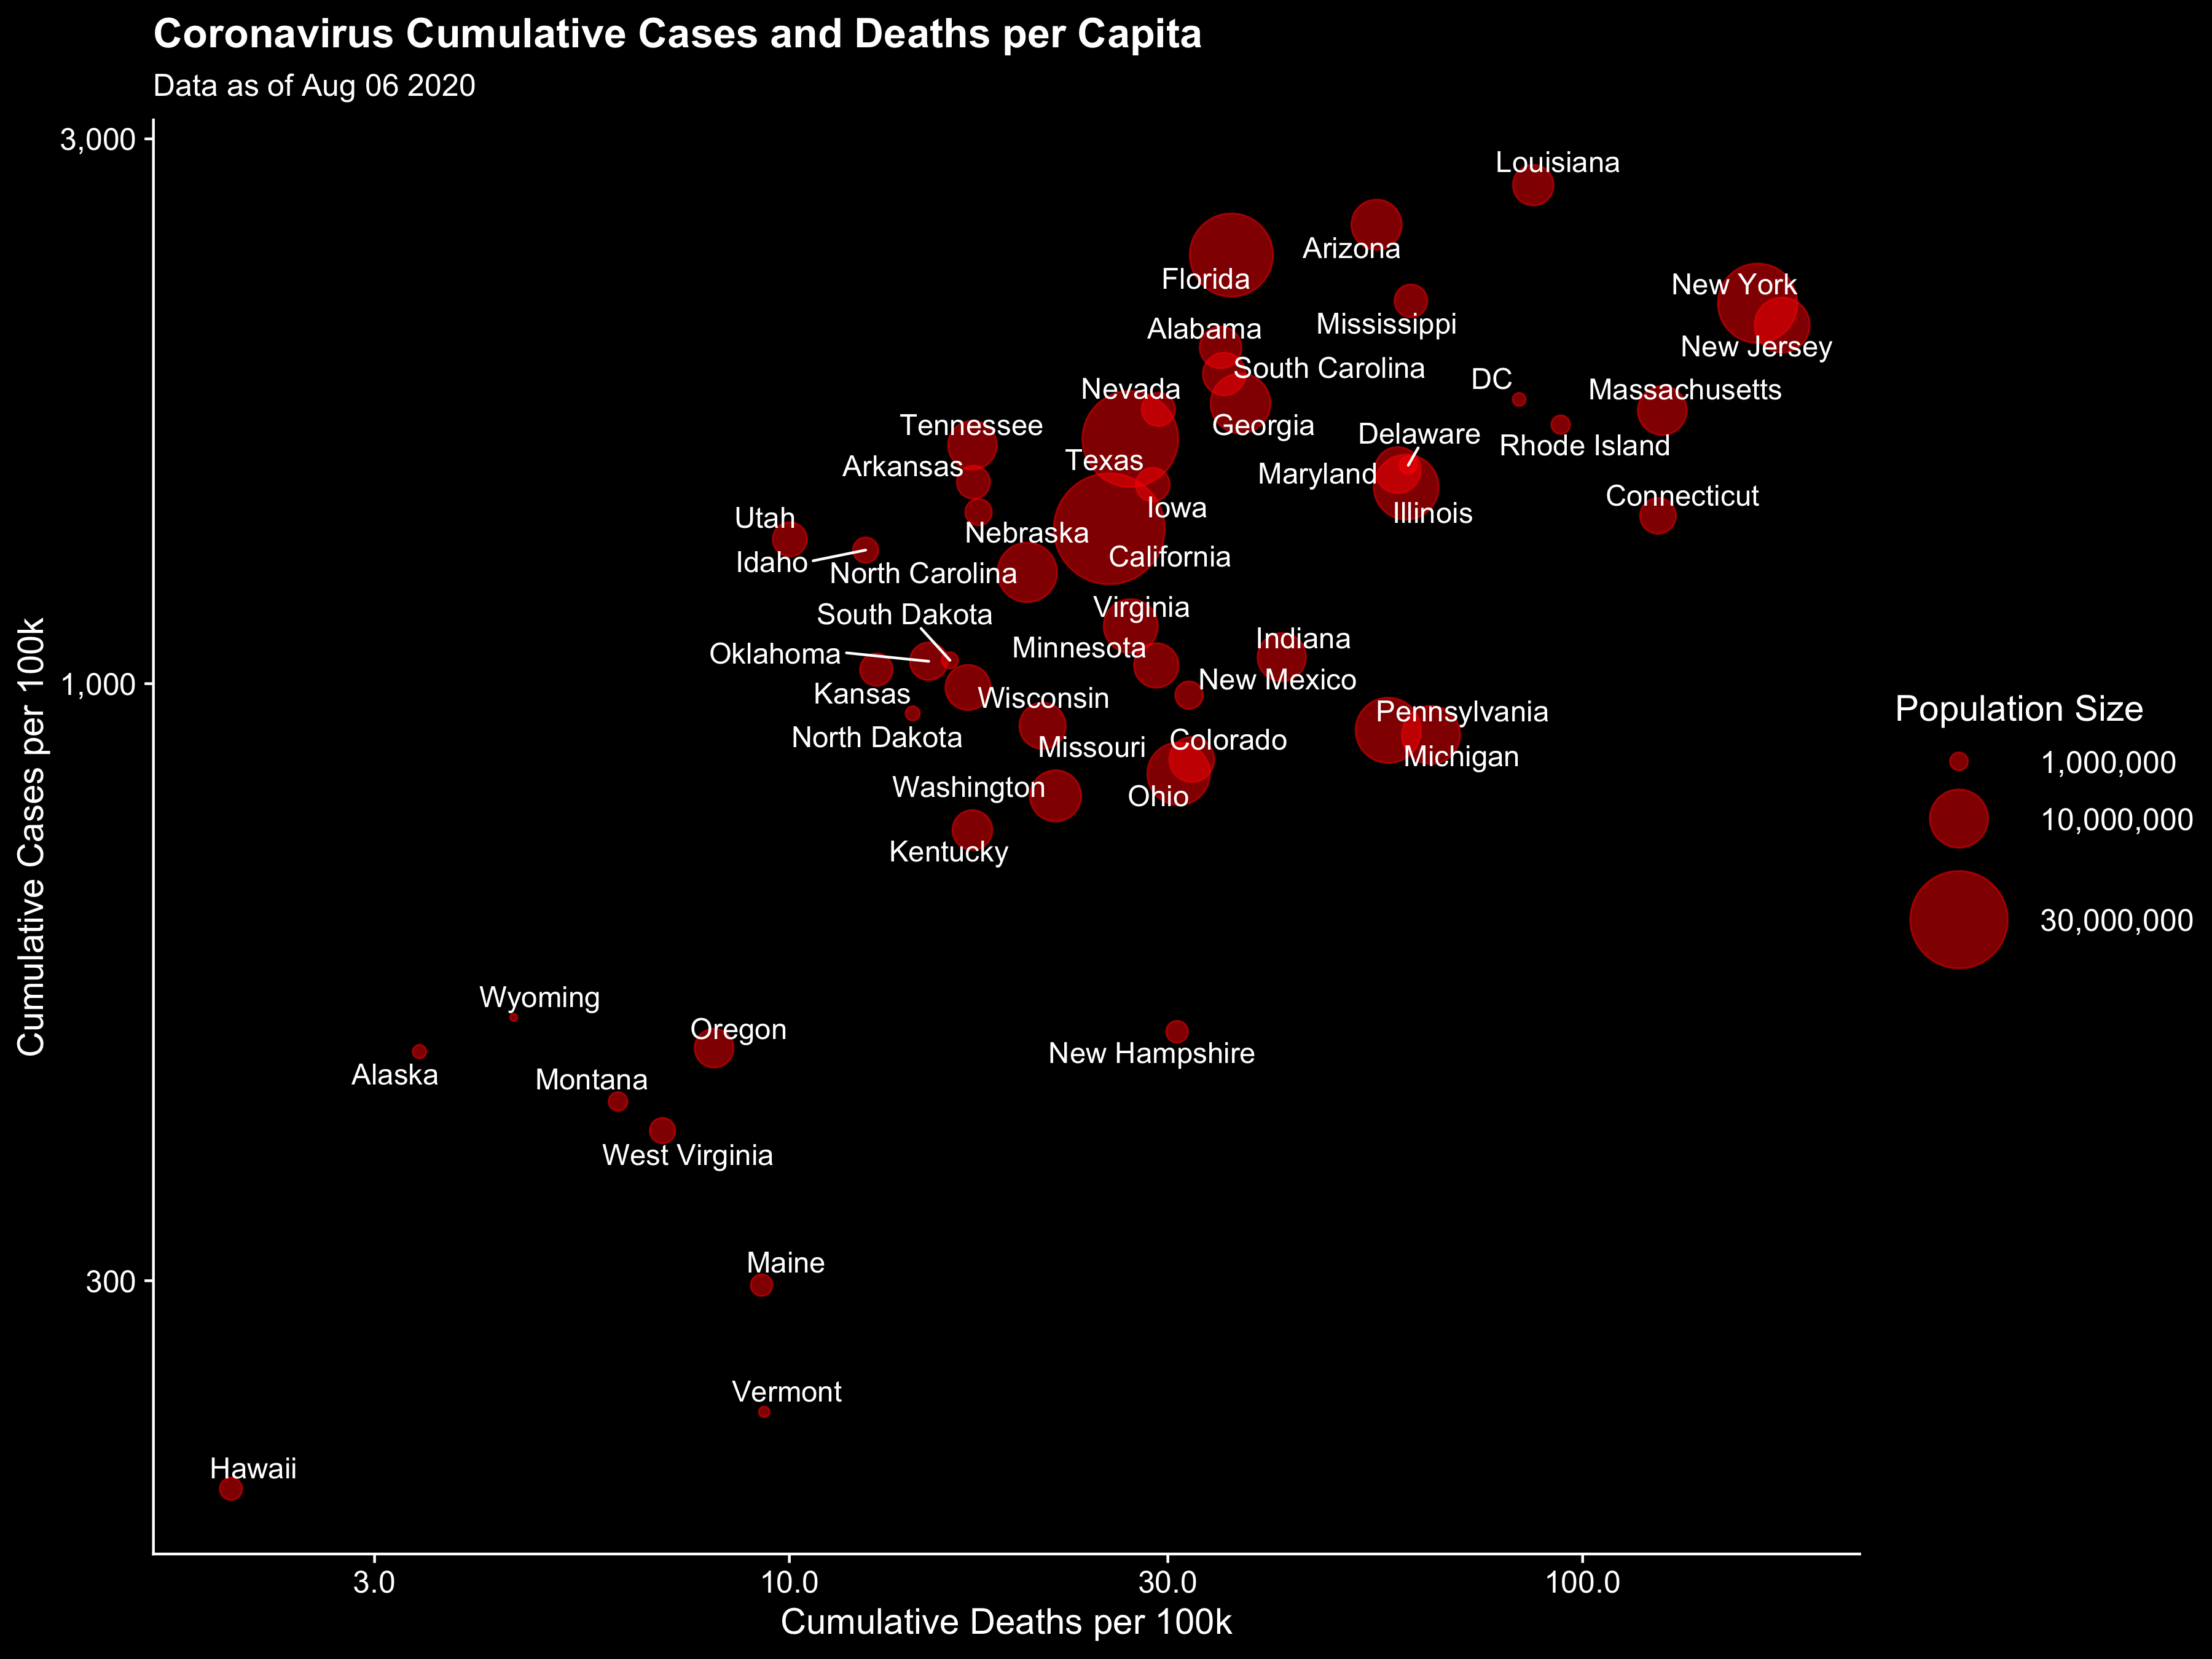
Here's a static version of the data on the last date available:
The code to reproduce the visualization is in the animation_script.R file, along with the code to read in the USA Facts dataset in load_usafacts_data.R.
The animation was rendered using the most recent available data on July 9th 2020.

