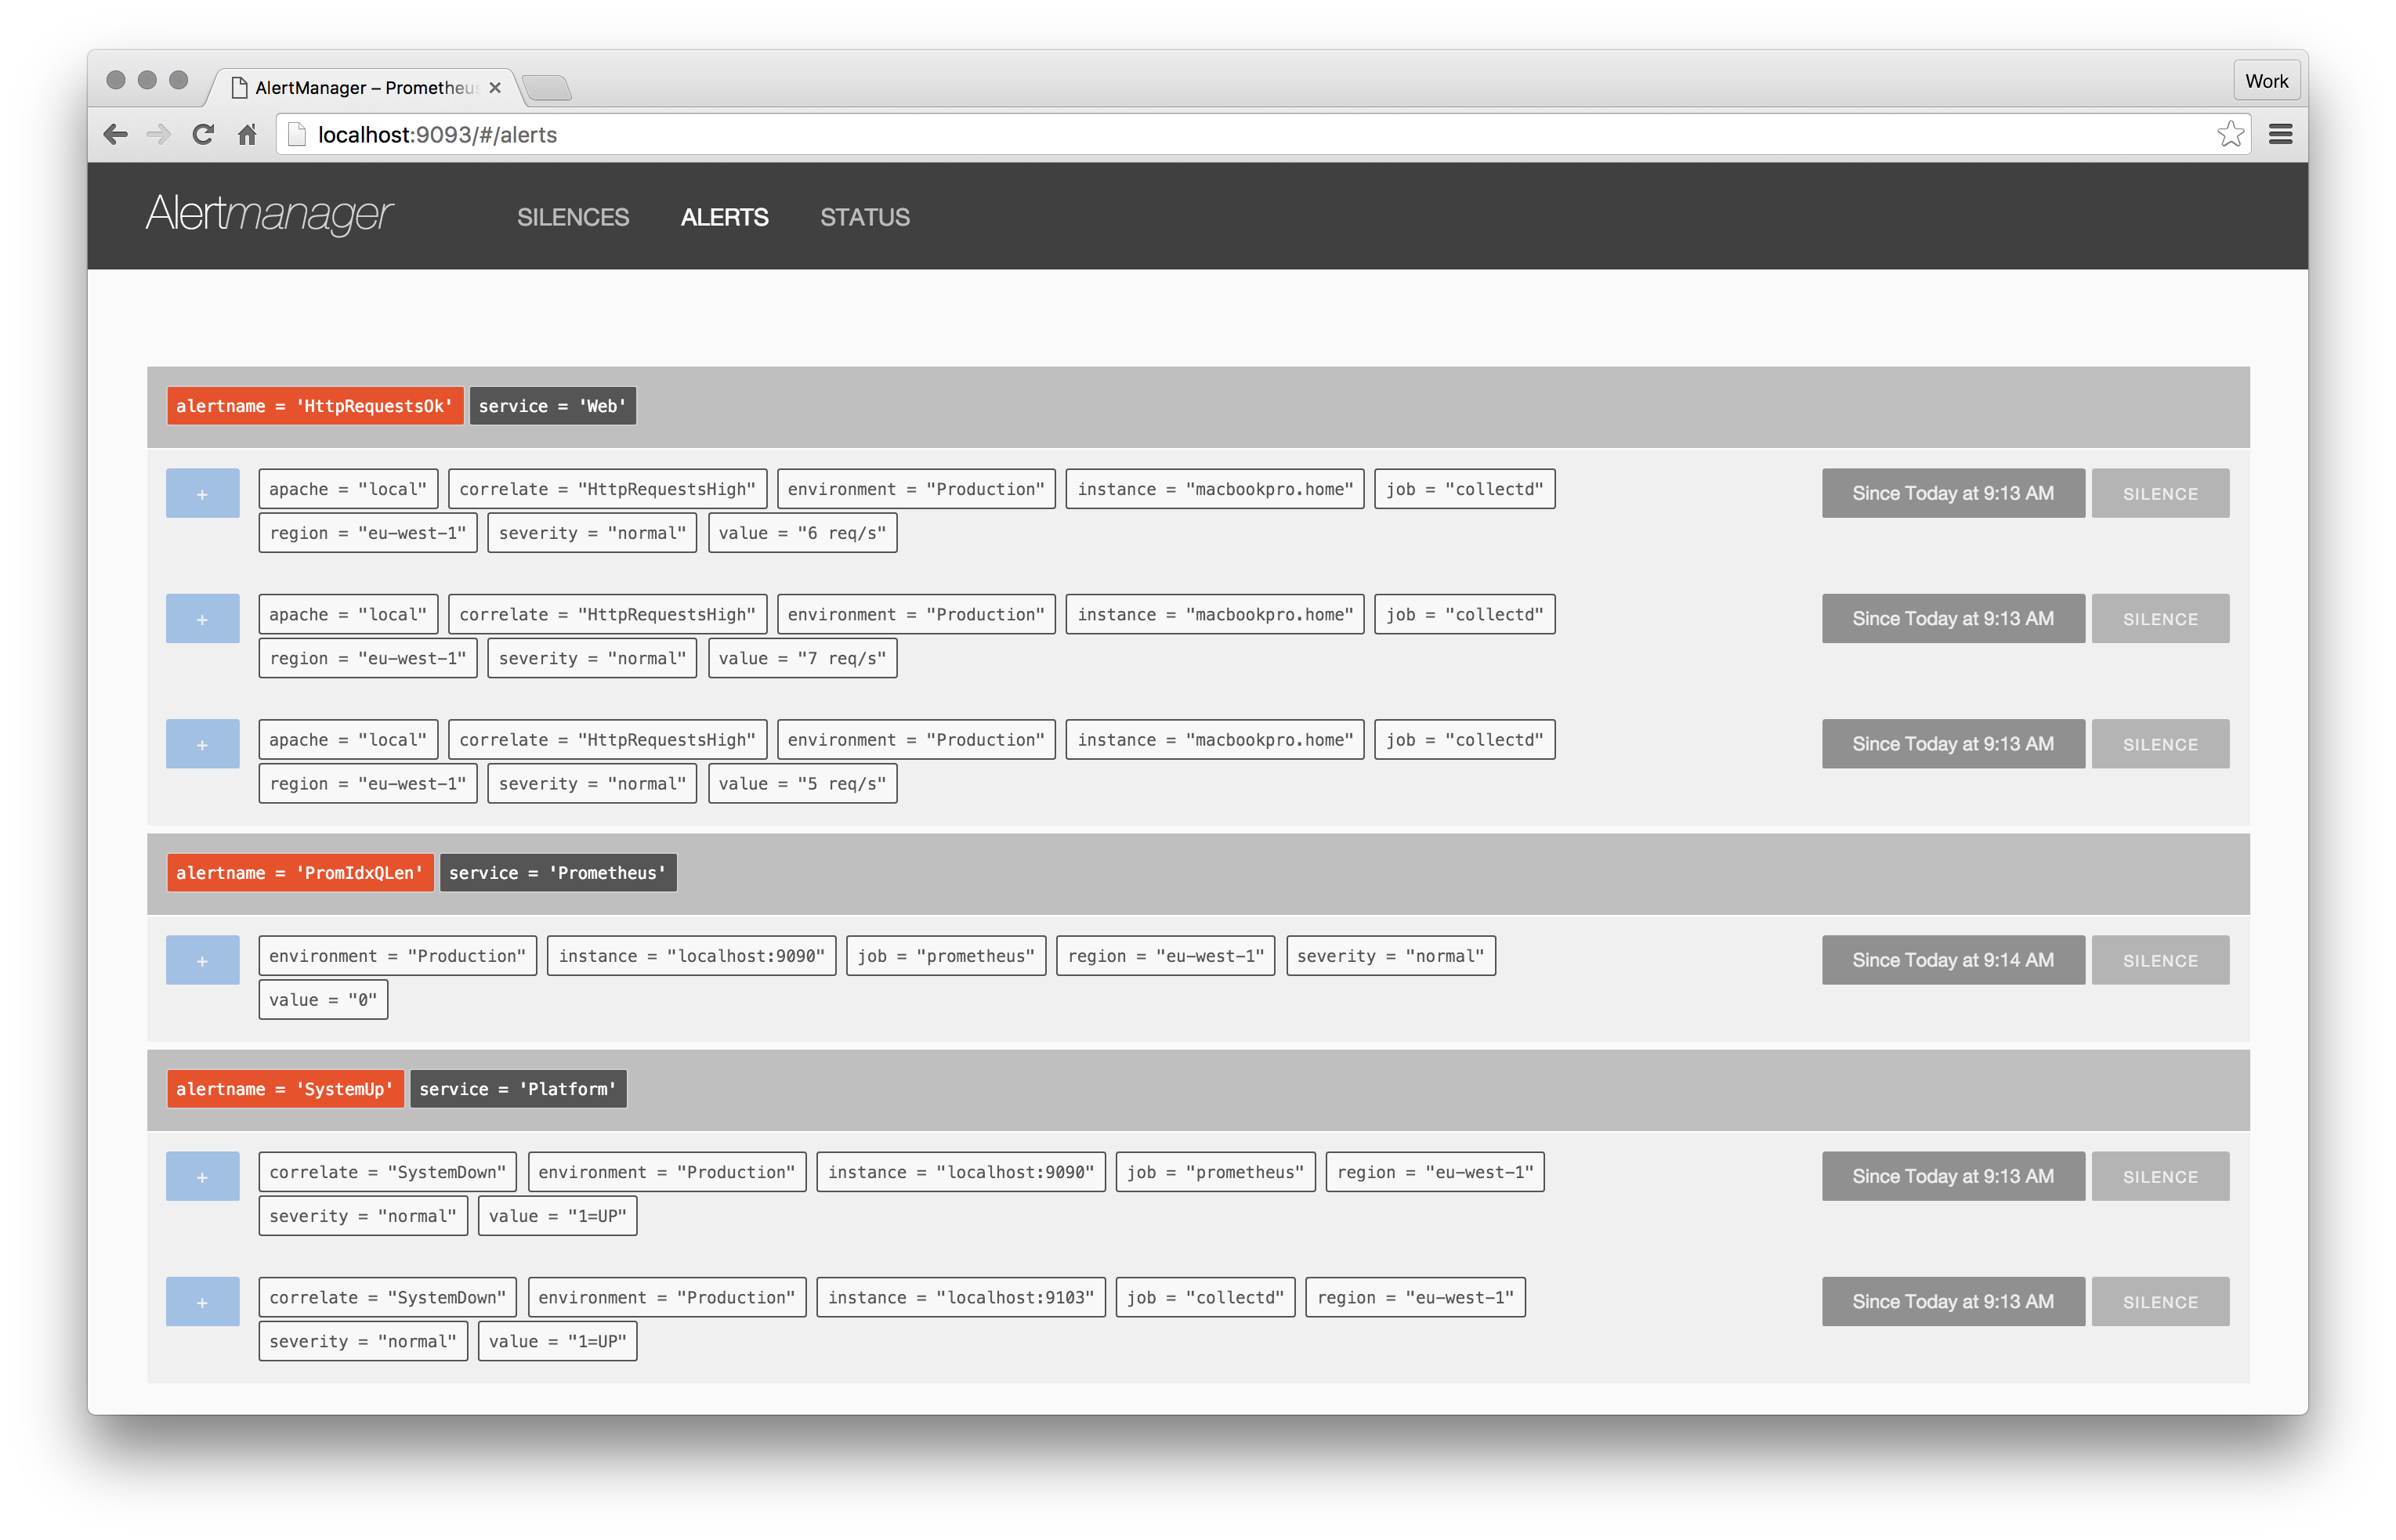
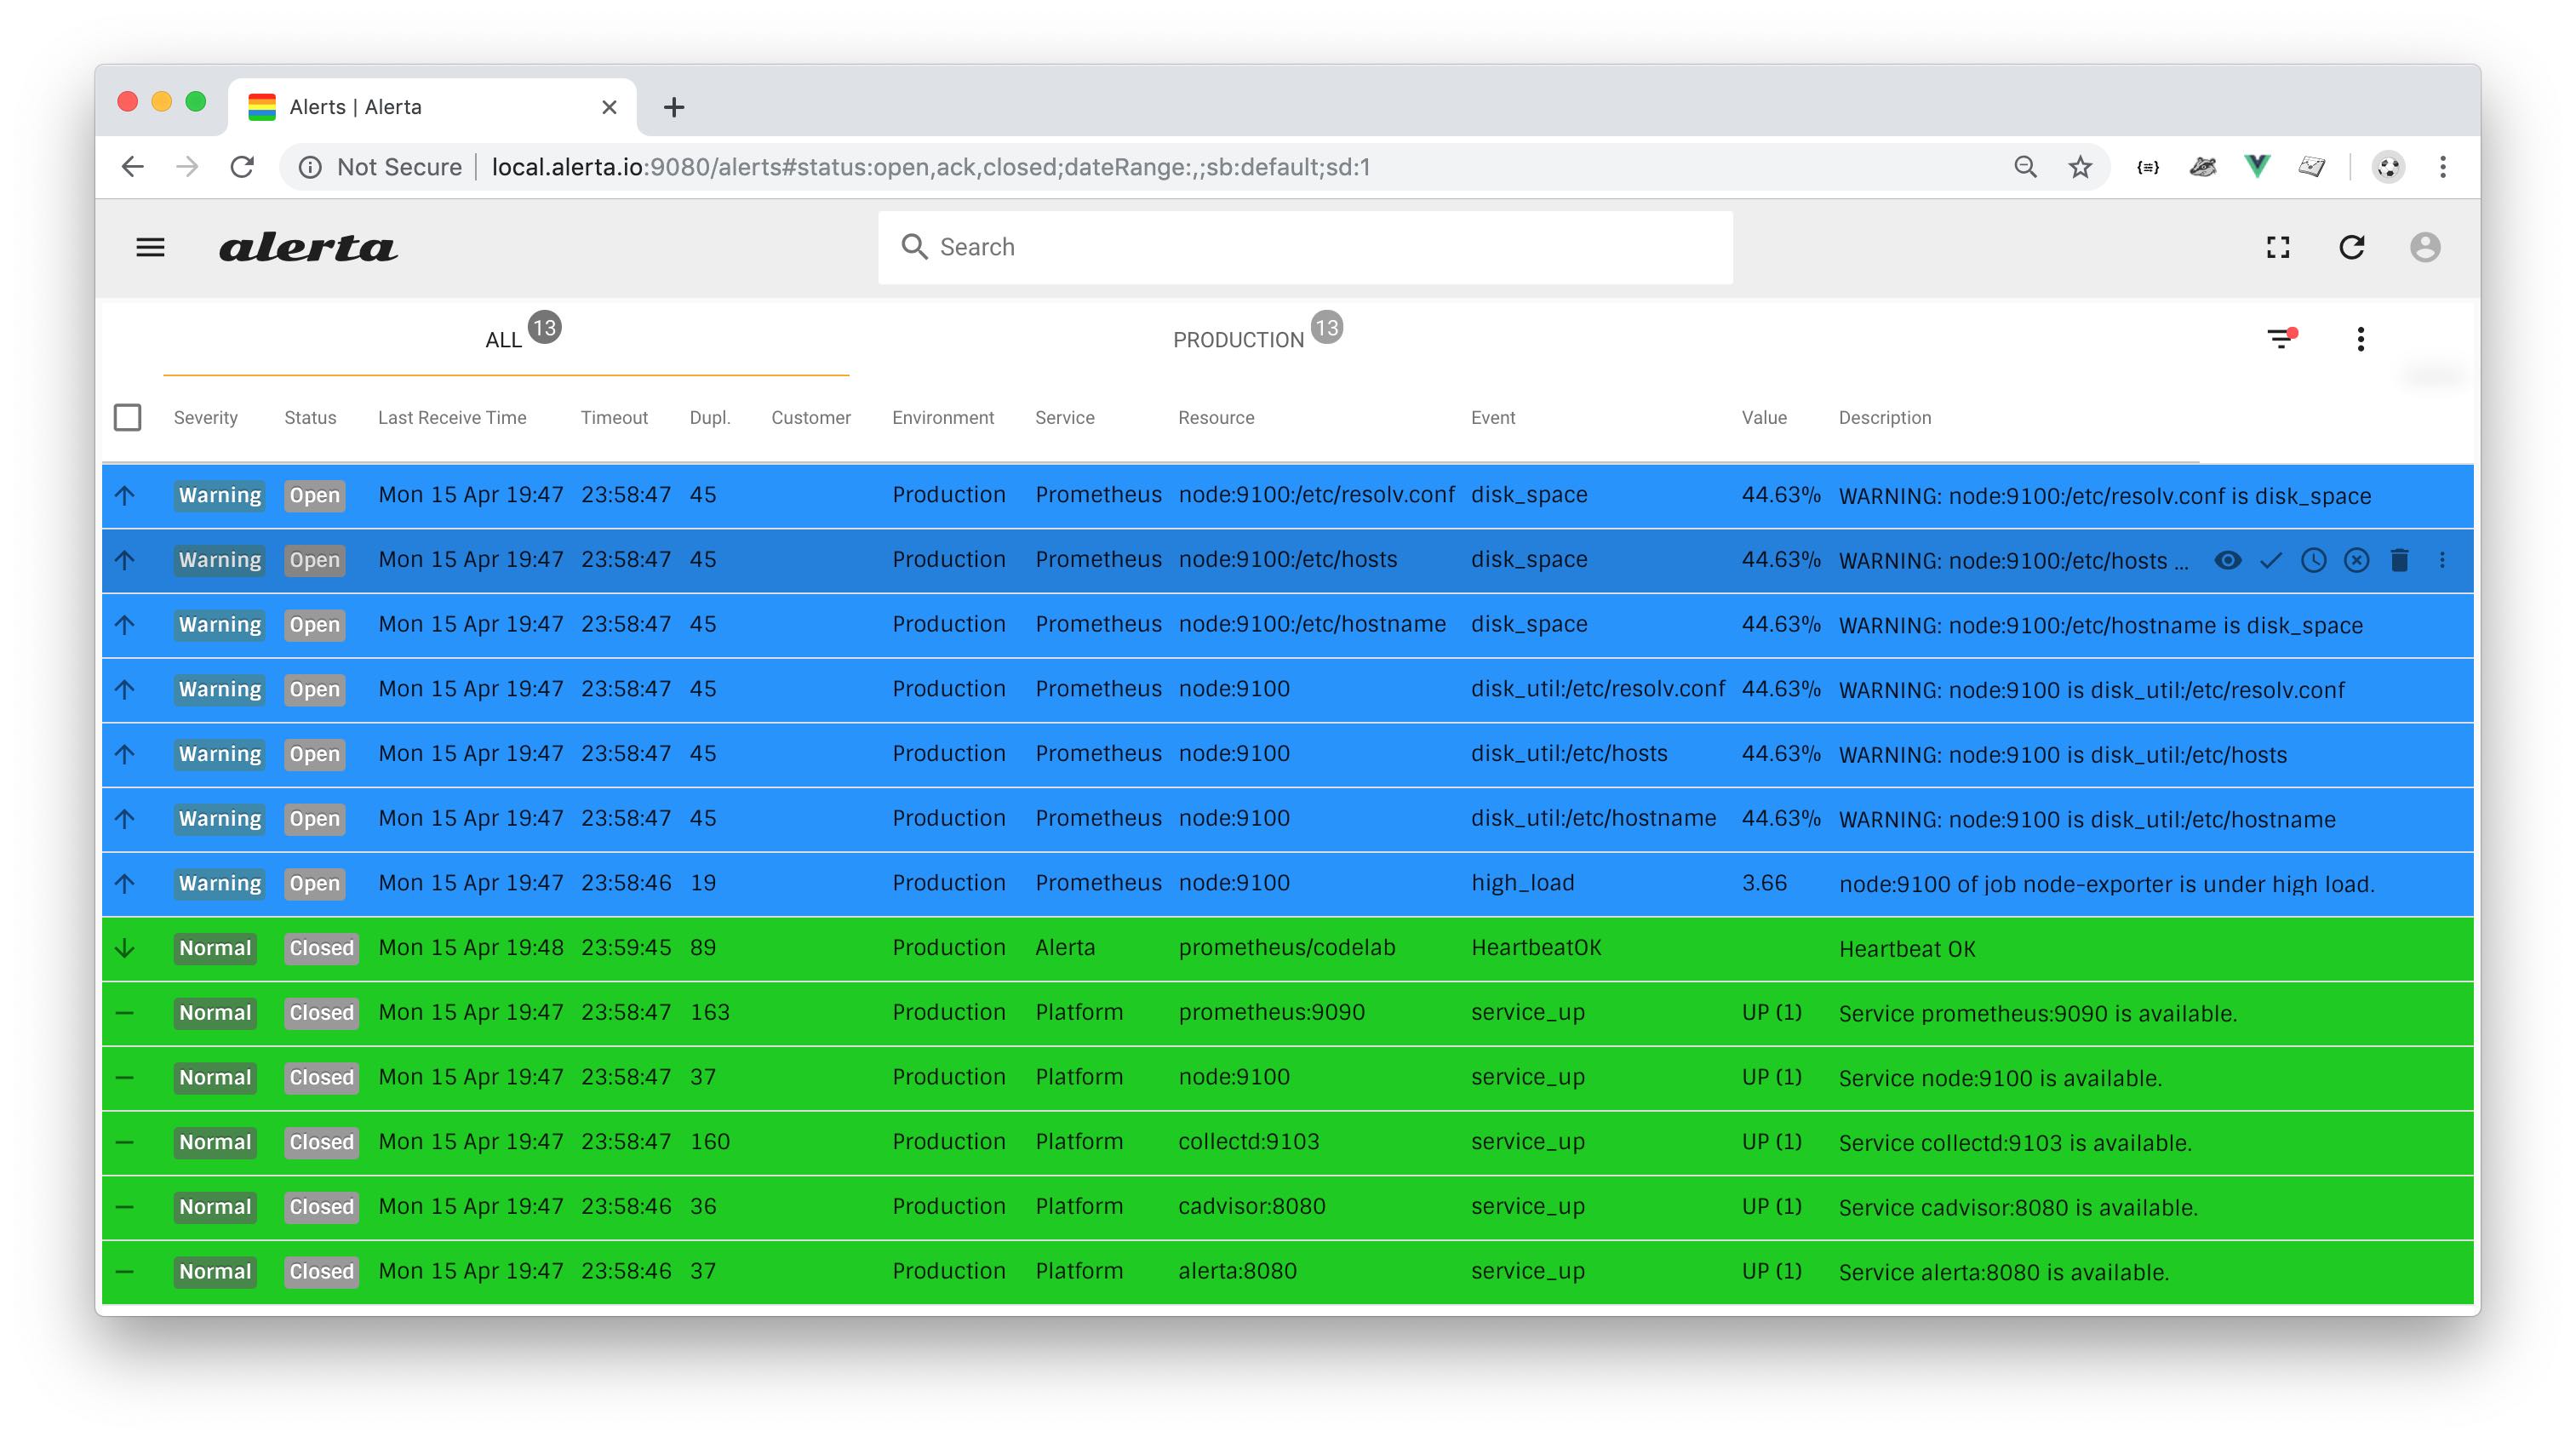
Consolidate alerts from Prometheus and other tools (like Nagios or Zabbix) into a single "at-a-glance" console.
Transform this ...
Into this ...
Install the following:
- Prometheus 2.0
- Prometheus Alertmanager
- Alerta
This integration takes advantage of configurable webhooks available with Prometheus Alertmanager.
Support for Prometheus is built-in to Alerta so no special configuration is required other than to ensure the webhook URL is correct in the Alertmanager config file.
Example alertmanager.yml receivers section
receivers:
- name: "alerta"
  webhook_configs:
  - url: 'http://localhost:8080/webhooks/prometheus'
    send_resolved: true
Note: If the Docker container for Alerta
is used then the webhook URL will use a host and port specific to
your environment and the URL path will be /api/webhooks/prometheus.
If Alerta is configured to enforce authentication then the receivers section should define BasicAuth username and password or the webhook URL should include an API key. Bearer tokens are not recommended for authenticating external systems with Alerta.
Example alertmanager.yml receivers section with BasicAuth
receivers:
- name: "alerta"
  webhook_configs:
  - url: 'http://alerta:8080/api/webhooks/prometheus'
    send_resolved: true
    http_config:
      basic_auth:
        username: [email protected]
        password: alerta
Example alertmanager.yml receivers section with API Key
receivers:
- name: "alerta"
  webhook_configs:
  - url: 'http://localhost:8080/webhooks/prometheus?api-key=QBPALlsFSkokm-XiOSupkbpK4SJdFBtStfrOjcdG'
    send_resolved: true
Prometheus rules define thresholds at which alerts should be triggered. The following table illustrates how Prometheus notification data is used to populate Alerta attributes in those triggered alerts:
| Prometheus | Type | Alerta |
|---|---|---|
| instance (*) | internal | resource |
| event or alertname (*) | label/internal | event |
| environment | label | environment |
| customer | label | customer |
| severity | label | severity (+) |
| correlate | label | correlate |
| service | label | service |
| group or job (*) | label/internal | group |
| value | annotation | value |
| description or summary | annotation | text |
| unassigned labels | label | tags |
| unassigned annotations | annotation | attributes |
| monitor (*) | label | origin |
| externalURL (*) | internal | externalUrl |
| generatorlURL (*) | internal | moreInfo |
| "prometheusAlert" | n/a | type |
| raw notification | n/a | rawData |
| timeout (**) | label | timeout |
Note: value has changed from a label to an annotation.
Prometheus labels marked with a star (*) are built-in and assignment to Alerta attributes happens automatically. All other labels or annotations are user-defined and completely optional as they have sensible defaults.
Prometheus label timeout use default value 0 if not exists.
Note that during configuration of complex alarms with sum
and rate function the instance and exported_instance labels can
be missed from an alarm. These will need to be setup manually with:
- alert: rate_too_low
  expr: sum by(host) (rate(foo[5m])) < 10
  for: 2m
  labels:
    environment: Production
    instance: '{{$labels.host}}'  # <== instance added to labels manually
  annotations:
    value: '{{$value}}'
By default the alertname label is used to populate the event attribute. However,
there are times where this simple 1-to-1 mapping is not sufficient and the event
needs to include other information, like filesystem mountpoints, to ensure that
alerts for different resources aren't incorrectly deduplicated.
It is therefore possible to define an event label which will be used instead of
the alertname. The event label can include the alertname plus other
information if required.
Regretably it isn't possible to refer to alertname[1],
external labels [2], or labels in annotations [3]
[4]. These limitations are due to design decisions which
are not going to change in the forseeable future
yet make integration with Prometheus via generic webhooks very difficult
beyond extremely simple use cases [6] [7] [8] [9].
The work-around developed for Alerta is to allow Prometheus rules to contain python format syntax that can refer to labels anywhere in a rule, ie. in either another label or an annotation, and then pre-parse the labels and annotations when receiving a Prometheus alert before processing it as normal. Like so:
  labels:
    foo: bar
    baz: {foo}
  annotations:
    quux: the foo is {foo} and the baz is {baz}
This will be interpreted as:
  labels:
    foo: bar
    baz: bar
  annotations:
    quux: the foo is bar and the baz is bar
This makes refering to labels in annotations to create things like dynamic "runbook" URLs very straight-forward. An example the does this can be found under the heading "Python Format Template Example" below.
Many Prometheus values can be used to populate attributes in Alerta alerts to enrich the available alert information if reasonable values are assigned where possible.
This is demonstrated in the example alert rules below, which become increasingly more informative.
Use the provided prometheus.yml, prometheus.rules.yml and alertmanager.yml
files in the /example directory to start with and run prometheus and
alertmanager as follows:
$ ./prometheus -config.file=prometheus.yml -alertmanager.url=http://localhost:9093
$ ./alertmanager -config.file=alertmanager.yml
Or if you have Docker installed run:
$ docker-compose up -d
Prometheus Web => http://localhost:9090
Alertmanager Web => http://localhost:9093
The example rule below is the absolute minimum required to trigger a "warning" alert and a corresponding "normal" alert for forwarding to Alerta.
- alert: MinimalAlert
  expr: metric > 0
This example sets the severity to major and defines a description to
be used as the alert text.
- alert: SimpleAlert
  expr: metric > 0
  labels:
    severity: major
  annotations:
    description: simple alert triggered at {{$value}}
This example uses python string format syntax
(ie. curly braces {}) to template the values for app (in runbook) and alertname (in event and runbook).
- alert: TemplateAlert
  expr: metric > 0
  labels:
    event: {alertname}:{{ $labels.mountpoint }}
    severity: major
  annotations:
    description: simple alert triggered at {{$value}}
    runbook: https://internal.myorg.net/wiki/alerts/{app}/{alertname}
A more complex example where external_labels defined globally
are used to populate common alert attributes like environment,
service and monitor (used by origin). The alert value is set
using the $value label.
global:
  external_labels:
    environment: Production
    service: Prometheus
    monitor: codelab
- alert: CompleteAlert
  expr: metric > 0
  labels:
    severity: minor
  annotations:
    description: complete alert triggered at {{$value}}
    value: '{{ humanize $value }} req/s'
- alert: NodeDown
  expr: up == 0
  labels:
    severity: minor
    correlate: NodeUp,NodeDown
  annotations:
    description: Node is down.
- alert: NodeUp
  expr: up == 1
  labels:
    severity: ok
    correlate: NodeUp,NodeDown
  annotations:
    description: Node is up.
It is desirable that the prometheus.yml and prometheus.rules.yml
configuration files conform to an expected format but this is not
mandatory.
It is possible to set global labels which will be used for all alerts that are sent to Alerta. For instance, you can label your server with 'Production' or 'Development'. You can also describe the service, like 'Prometheus'.
Example prometheus.yml Global section:
global:
  external_labels:
    environment: Production
    service: Prometheus
    monitor: codelab
Example alertmanager.yml with send_resolve disabled
receivers:
- name: "alerta"
  webhook_configs:
  - url: 'http://alerta:8080/api/webhooks/prometheus'
    send_resolved: false
    http_config:
      basic_auth:
        username: [email protected]
        password: alerta
Example prometheus.rules.yml with explicit "normal" rule
  # system load alert
  - alert: load_vhigh
    expr: node_load1 >= 0.7
    labels:
      severity: major
      correlate: load_vhigh,load_high,load_ok
    annotations:
      description: '{{ $labels.instance }} of job {{ $labels.job }} is under very high load.'
      value: '{{ $value }}'
  - alert: load_high
    expr: node_load1 >= 0.5 and node_load1 < 0.7
    labels:
      severity: warning
      correlate: load_vhigh,load_high,load_ok
    annotations:
      description: '{{ $labels.instance }} of job {{ $labels.job }} is under high load.'
      value: '{{ $value }}'
  - alert: load_ok
    expr: node_load1 < 0.5
    labels:
      severity: normal
      correlate: load_vhigh,load_high,load_ok
    annotations:
      description: '{{ $labels.instance }} of job {{ $labels.job }} is under normal load.'
      value: '{{ $value }}'
Note: The "load_high" rule expression needs to bracket the
node_load1 metric value between the "load_vhigh" and the "load_ok"
values ie. expr: node_load1 >= 0.5 and node_load1 < 0.7
Alerta exposes prometheus metrics natively on /management/metrics so
alerts can be generated based on Alerta performance.
Counter, Gauge and Summary metrics
are exposed and all use alerta as the application prefix. Metrics are
created lazily, so for example, a summary metric for the number of deleted
alerts will not be present in the metric output if an alert has never
been deleted. Note that counters and summaries are not reset when
Alerta restarts.
Example Metrics
# HELP alerta_alerts_total Total number of alerts in the database
# TYPE alerta_alerts_total gauge
alerta_alerts_total 1
# HELP alerta_alerts_rejected Number of rejected alerts
# TYPE alerta_alerts_rejected counter
alerta_alerts_rejected_total 3
# HELP alerta_alerts_duplicate Total time to process number of duplicate alerts
# TYPE alerta_alerts_duplicate summary
alerta_alerts_duplicate_count 339
alerta_alerts_duplicate_sum 1378
# HELP alerta_alerts_received Total time to process number of received alerts
# TYPE alerta_alerts_received summary
alerta_alerts_received_count 20
alerta_alerts_received_sum 201
# HELP alerta_plugins_prereceive Total number of pre-receive plugins
# TYPE alerta_plugins_prereceive summary
alerta_plugins_prereceive_count 390
alerta_plugins_prereceive_sum 10
# HELP alerta_plugins_postreceive Total number of post-receive plugins
# TYPE alerta_plugins_postreceive summary
alerta_plugins_postreceive_count 387
alerta_plugins_postreceive_sum 3
# HELP alerta_alerts_create Total time to process number of new alerts
# TYPE alerta_alerts_create summary
alerta_alerts_create_count 26
alerta_alerts_create_sum 85
# HELP alerta_alerts_queries Total time to process number of alert queries
# TYPE alerta_alerts_queries summary
alerta_alerts_queries_count 57357
alerta_alerts_queries_sum 195402
# HELP alerta_alerts_deleted Total time to process number of deleted alerts
# TYPE alerta_alerts_deleted summary
alerta_alerts_deleted_count 32
alerta_alerts_deleted_sum 59
# HELP alerta_alerts_tagged Total time to tag number of alerts
# TYPE alerta_alerts_tagged summary
alerta_alerts_tagged_count 1
alerta_alerts_tagged_sum 4
# HELP alerta_alerts_untagged Total time to un-tag number of alerts
# TYPE alerta_alerts_untagged summary
alerta_alerts_untagged_count 1
alerta_alerts_untagged_sum 1
# HELP alerta_alerts_status Total time and number of alerts with status changed
# TYPE alerta_alerts_status summary
alerta_alerts_status_count 2
alerta_alerts_status_sum 3
# HELP alerta_alerts_webhook Total time to process number of web hook alerts
# TYPE alerta_alerts_webhook summary
alerta_alerts_webhook_count 344
alerta_alerts_webhook_sum 3081
# HELP alerta_alerts_correlate Total time to process number of correlated alerts
# TYPE alerta_alerts_correlate summary
alerta_alerts_correlate_count 23
alerta_alerts_correlate_sum 69
- Kubernetes namespaces
- Kubernetes labels
- Kubernetes annotations
- Kubernetes metadata
Copyright (c) 2016-2018 Nick Satterly. Available under the MIT License.

