Tensor의 정의, Tensor간 add,mul,sub등 연산을 수행하는 방법
supervised learning : linear regression을 수행.
- trainning data set : X,Y 를 정의
- hypothesis : trainning data set을 기반으로하는 linear function Model, H(x) = W*X +b
- cost(W,b) = tf.reduce_mean(tf.square(hypothesis-Y)) 이며, 이를 최소화시키는것이 목적
- optimizer 를 GradientDescentOptimizer 사용 > cost를 minimize
- Conduct trainning
for step in range(2001):
	cost_val, W_val,b_val,_ = sess.run([cost,W,b,train],feed_dict={X:[1,2,3,4,5],Y:[2.1,3.1,4.1,5.1,6.1]})
	if(step %20 ==0):
		print(step,cost_val,W_val,b_val)
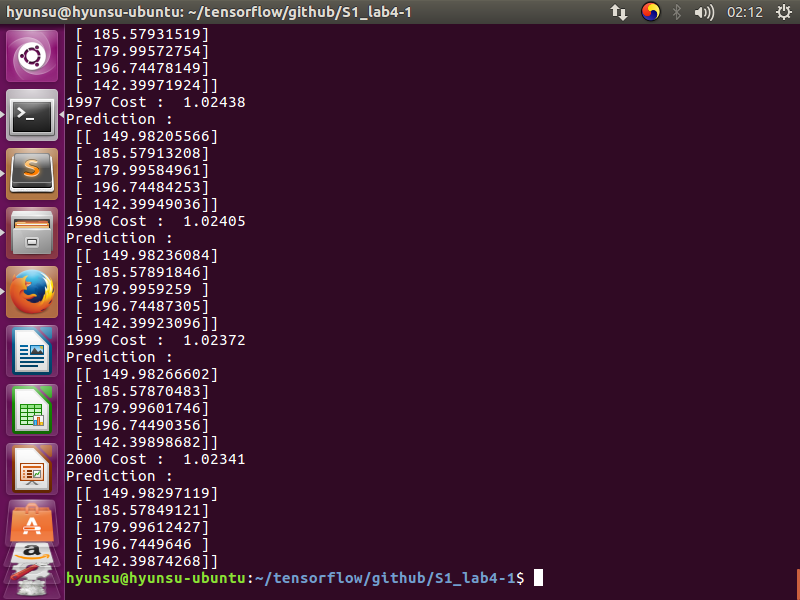
- result
tensorflow optimizer의 동작원리
learing_rate = 0.1
gradient = tf.reduce_mean(X * (W*X - Y))
descent = W - learing_rate * gradient
update = W.assign(descent)
- cost(W)를 미분하여 기울기를 얻는다.
- W := W - learning_rate * 기울기로 변경된다.
즉, cost(W),cost function의 기울기가 점차 감소되는 방향으로 W값이 이동한다. 기울기의 값이 0이 되는지점. 즉, cost(W)를 미분한 값이 0이 되는지점에서 optimal value를 얻는다.
Multi-variable linear regression
-
원하는 데이터 Y가 여러개의 변수에 의해 결정되는 경우. 즉, Y = f(x1,x2,x3)와 같은 형태
-
이러한 경우 hypothesis = x1w1 + x2w2 + x3w3 +b 꼴로 나타낸다.
-
위 솔루션과 동일한 방법으로 multi-variable 문제를 해결할 수는 있지만 다음과 같이 코드가 정적이며 dynamic한 input에 대해 프로그램이 유연하지 못하다.
-
솔루션--1
x1_data = [73.,93.,89.,96.,73.]
x2_data  = [80.,88.,91.,98.,66.]
x3_data = [75.,93.,90.,100.,70.]

X1 = tf.placeholder(tf.float32)
X2 = tf.placeholder(tf.float32)
X3 = tf.placeholder(tf.float32)

y_data = [152.,185.,180.,196.,142.]
Y = tf.placeholder(tf.float32)

W1 = tf.Variable(tf.random_normal([1]),name="weight1")
W2 = tf.Variable(tf.random_normal([1]),name="weight2")
W3 = tf.Variable(tf.random_normal([1]),name="weight3")
b = tf.Variable(tf.random_normal([1]),name="bias")

hypothesis = X1 * W1 + X2 * W2 + X3 * W3 +b
따라서,
- Input variable로써 N개의 multi-variable,
- Output variable로써 M개의 multi-variable,
- H개의 # of instance 가 주어진 경우
x_data = [
	[73,80,75],
	[93,88,93],
	[89,91,90],
	[96,98,100],
	[73,66,70]
]

y_data = [[152],[185],[180],[196],[142]]

X = tf.placeholder(tf.float32,shape=[None,3])
Y = tf.placeholder(tf.float32,shape=[None,1])

W = tf.Variable(tf.random_normal([3,1]),name="weight")
b = tf.Variable(tf.random_normal([1]),name="bias")
이를 (MxN) * (NxM) = (HxM) 꼴의 행렬연산으로 표현할 수 있다.
- H(X) = XW +b
hypothesis = tf.matmul(X,W)+b
그러므로, 각 multi-variable에 대한 weight matrix ,W는 Shape[N,M] 의 Tensor로써 나타내야 한다.
- Example
W = tf.Variable(tf.random_normal([3,1]),name="weight")
b = tf.Variable(tf.random_normal([1]),name="bias")
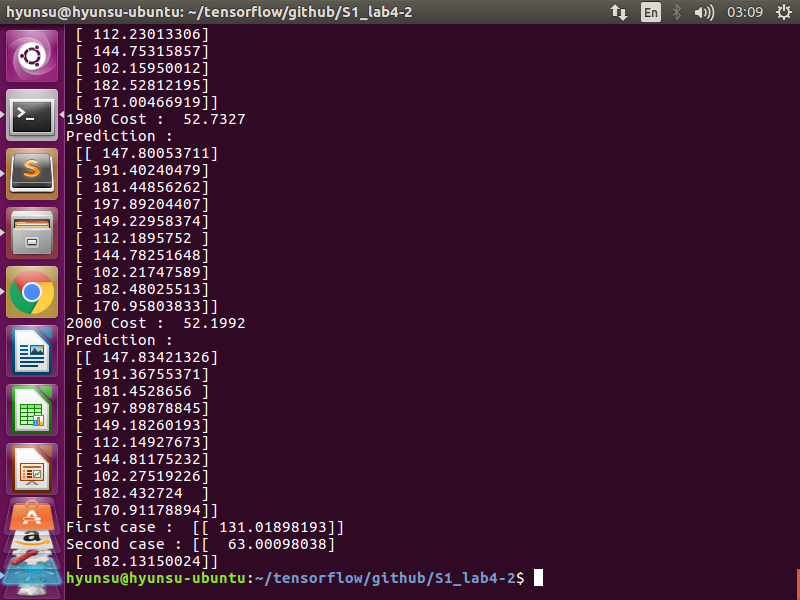
위와 같은 형식을 이용해서 multi-variable에 대한 linear regression을 유연하게 구현하여 insteresting value인 1) cost 2) hypothesis 를 다음과 같이 얻을 수 있다.
- result
Loading Data from File
- 일반적으로 .csv 형식 파일으로부터 데이터를 읽어들이고자 하는 경우 numpy lib 이용해 XY matrix을 만들고 여기서 부터 input data : X , Output data : Y 를 정의한다.
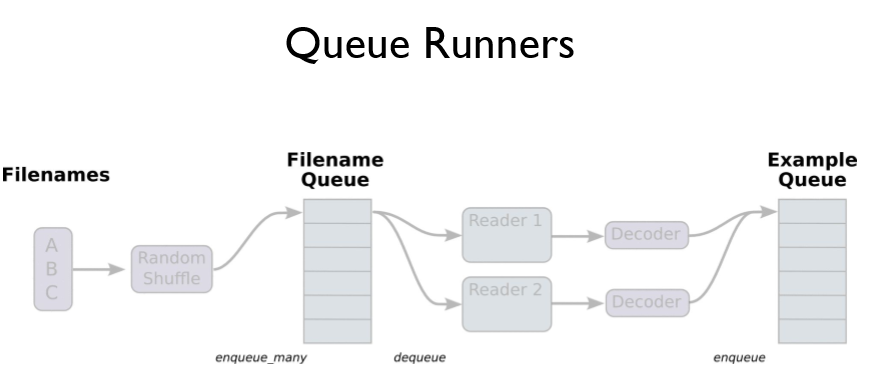
- 그러나, 읽어들어야 할 .csv 파일이 너무 많아 파일을 모두 읽어들이기 위해 요구되는 메모리가 부족한 상황이 생긴 경우, 다음과 같은 Queue Running 을 이용한다
- A,B,C,... 등의 대용량의 데이터를 읽어 들인다.(셔플가능)
- 읽어들인 데이터를 Queue에 저장한다.
- Reader를 이용해 큐에 접근하여 한개씩 데이터를 읽어들인다.
- 여기서 읽어들일 데이터 형식을 다음과 같이 지정한다.
record_defaults = [[0.],[0.],[0.],[0.]]
xy = tf.decode_csv(value,record_defaults=record_defaults)
- Decoder에 의해 파싱된 데이터는 별도의 Queue에 다시 저장된다.
- 저장된 데이터는 batch에 의해 임의의 size만큼 data를 뽑아낸다.
- 트레이닝훈련을 진행한 후, 아래의 코드로 결과데이터를 예측한다.
hypo1 = sess.run(hypothesis,feed_dict={
	X : [[70,60,50]]
	})
hypo2 = sess.run(hypothesis,feed_dict={
	X : [[40,30,10],[90,95,92]]
	})

print("First case : ",hypo1)
print("Second case :",hypo2)
Logistic(regression) classifier 주어진 supervised leaning이 Input variables X1,X2,...Xn에 대한 Binary Classification인 경우, 다음과 같은 방법으로 모델을 구현할 수 있다.
- linear regression인 경우, hypothesis, 예측값을 다음과 같이 구현하였다.
hypothesis = tf.matmul(X,W)+b
그런데, classifier에 경우는 위 수식이 적절치 않은데 그 이유는 다음과 같다. output의 결과인 Y가 0,1로 Binary한 데 반해, X값은 범위가 매우 다양하다. 따라서, (X,Y)가 (3,1) (100,1) (1000,1) 이 성립할 수 있다. 이 때, linear regression에서 사용하는 hypothesis를 사용하면 lienar하게 함수가 그려지기 때문에 Y를 예측하기 위한 적절한 X가 구해지지 않는다. 2. 따라서, 다음과 같은 sigmod 꼴의 hypothesis를 구현한다.
hypothesis = tf.sigmoid(tf.matmul(X,W)+b)
이 모델은 z = W*X , hypothesis,g(z) = 1 / 1+ e^-z 꼴로 표현되며 0 < g(z) <1 의 값을 가진다. 3. 따라서, 위 hypothesis를 통해 다음과 같은 cost function을 도출할 수 있다. cost function은 실제값,Y 와 예측값,hypothesis간의 difference를 의미하는 것인데, Y =1 인경우 cost(g(z)) = -log(g(z)) , Y = 0인 경우 cost(g(z)) = -log(1-g(z))로써 표현 할 수있다. 위 수식은 그래프를 그려봄으로써 왜 이 모습을 띄게 되었는지 이해할 수 있다.
cost = -tf.reduce_mean(Y * tf.log(hypothesis) + (1-Y)*tf.log(1-hypothesis))
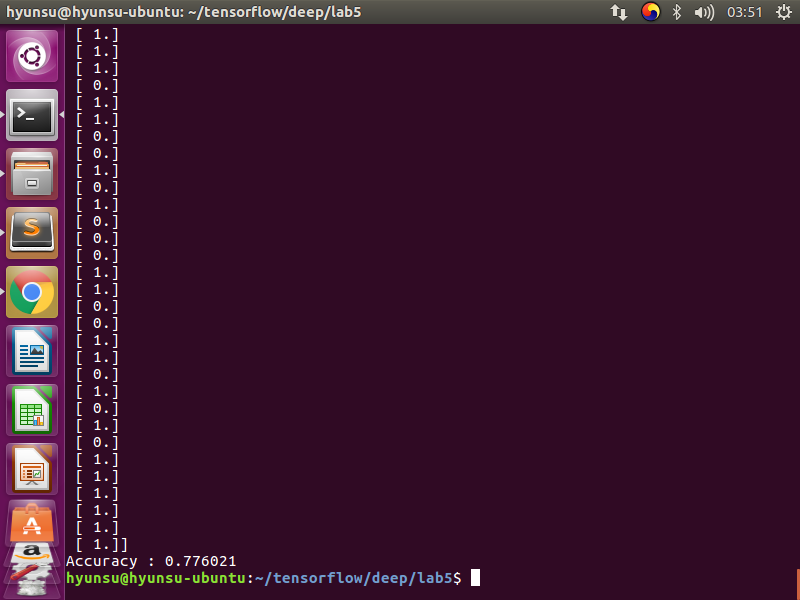
- 모델의 학습정도를 파악하기 위해 다음과 같은 파라미터를 정의하고 trainning data set를 입력했다.(.csv형식 파일)
predicted = tf.cast(hypothesis > 0.5,dtype=tf.float32)
accuracy = tf.reduce_mean(tf.cast( tf.equal(predicted,Y) ,dtype=tf.float32))
h , c, a = sess.run([hypothesis,predicted,accuracy],feed_dict={
		X : x_data,
		Y: y_data
		})
Multinomial Classifier 위와 같은 P Or F 로 구분되는 Binary classifier가 아니라 a,b,c,d와 같이 구분되는 classification을 multinomial classifier라고 한다.binary가 아니므로 ouput의 결과인 Y는 1차원 vector를 띄게된다. 이를 위해 vector의 길이만큼 binary경우에서 처럼 sigmoid(X or not)를 구해도 해결이 되지만 복잡하다. 이를 위해 softmax라는 방법을 아래와 같이 적용한다.
- hypothesis
hypothesis = tf.nn.softmax(tf.matmul(X,W) +b)
이 방법으로, Z = WX로 구해진 상수 Z는 ex) 2.0 1.0 0 다음과 같이 softmax된다. [1,0,0] ,one_hot
- cost function D(L,S) = Mean of -( L * logS )
cost = tf.reduce_mean(-tf.reduce_sum(Y * tf.log(hypothesis) , axis=1))
- 실행결과 예측
a = sess.run(hypothesis,feed_dict={
		X : [[1,11,7,9],[1,3,4,3],[1,1,0,1]]
		})
	print(a,sess.run(tf.argmax(a,axis=1)))
Fancy Softmax classifier multinomial classifier에서 tensorflow 라이브러리를 사용하여 tensor의 shape을 조작하는 법과 cost function을 간단히 조작하는 방법에 대해 알아보자.
- softmax_cross_entropy cross_entropy 방법의 cost function을 D(L,S) = Mean of L * -log(S) 으로 구하지 않고, 라이브러리를 활용한다.
logits = tf.matmul(X,W) + b # z = WX
hypothesis = tf.nn.softmax(logits) # predict

cost_i = tf.nn.softmax_cross_entropy_with_logits(logits=logits,labels=Y_one_hot)
cost = tf.reduce_mean(cost_i)
- .csv형식 파일에서 로드한 y_data를 Y_one_hot으로 변경시킨다.
Y =tf.placeholder(tf.int32,shape=[None,1])
# transformation : Y to one_hot
Y_one_hot = tf.one_hot(Y,nb_classes) # [ [0],[1]] > [[[10000000]], [[0100000]]]
Y_one_hot = tf.reshape(Y_one_hot,[-1,nb_classes])
Training data set 과 Test data set 간 구별.
머신러닝과정은 두개의 step인 Training과 Test로 나뉘는데, 트레이닝 데이타로 모델을 Test하는 경우 모델은 트레이닝 데이터에 overfitting 되어있을 가능성이 높으므로 테스트 결과를 신뢰 할 수 없다. 따라서, 다음 코드와 같이 머신러닝과정에 사용하는 트레이닝데이터, 테스트 데이터를 명확히 구분지어야 한다.
x_data = [[1,2,1],[1,3,2],[1,3,4],[1,5,5],[1,7,5],[1,2,5],[1,6,6],[1,7,7]]
y_data = [[0,0,1],[0,0,1],[0,0,1],[0,1,0],[0,1,0],[0,1,0],[1,0,0],[1,0,0]]

x_test = [[2,1,1],[3,1,2],[3,3,4]]
y_test = [[0,0,1],[0,0,1],[0,0,1]]
# ... 생략 ...
print('Prediction : ',sess.run(prediction,feed_dict={
                    X : x_test
               }))
    print('Accuracy : ',sess.run(accuracy,feed_dict={
                X : x_test,
                Y : y_test
            }))
- Leaning rate GradientDescentOptimizer인 경우, Cost function의 기울기를 통해 Cost가 극소값을 갖게하는 W(weight)를 다음과 같은 식으로 구해낸다. W := W - learning_rate * d/dw cost(W) learing_rate은 Model이 학습하는 정도를 나타내는 지표로써 학습속도와 성능에 영향을 끼친다
- learing_rate가 지나치게 큰 경우 learing_rate가 지나치게 크면, 학습과정에서 W가 cost fucntion의 범위를 벗어나는 overshooting현상이 발생할 수 있어, 학습이 불가능해 질 수 있다.
- learing_rate가 지나치게 작으면, 학습속도가 굉장히 오래걸리며, cost function이 linear regression 경우와 같이 Convex 꼴이 아니면 학습 도중 local optimum에 stuck되어 학습이 일어나지 않을 수 있다.
-
data preprocessiong class labels를 결정하는 Input attribute, X1,X2,X3,...,Xn이라 할때, 임의의 attribute Xk의 절대량이 다른 attribute의 절대량을 dominate하는 경우(크기의 차가 매우 큰 경우), 이 데이터를 기반으로 GradientDescentOptimizer를 이용하는 경우, 학습 도중 절대량이 작은 attribute의 weight축으로 overshooting 될 가능성이 매우 크므로, 이런 경우 학습 전에 trainning data를 preprocessing(정규화,normalization,standardization). (Normalization : Xj = (Xj -MEANj) / 표준편차j)
-
overfitting 머신러닝의 고질적인 문제로써, 학습모델이 training data set에 너무 치중하게 학습한 나머지, 실제 테스트 데이터에 대해서 낮은 성능을 보이는 경우를 말한다. 이것을 해결하기 위해서 트레이닝 데이터의 수를 늘리거나 Regularization 방법을 사용하여 문제를 최소화한다.
- Regularization Optimizer는 결국 cost를 최소하 하는 것이므로, training data에 overfitting하는 것을 막기 위해 다음과 같이 cost function을 수정한다.
regular_st = 0.0001 * tf.square(W) # regularization strength
cost = tf.reduce_mean(-tf.reduce_sum(Y * tf.log(hypothesis))) + regular_st
즉, cost function에 가중치를 두어 overfitting을 막는다. regularization_strength값이 클 수록 overfitting 되는 정도가 적으나, 학습이 정확히 이루어지지 않을 수 있다. 일반적으로, 가중치 설정을 안하는 경우(앞선 예제)regularization_strength가 0 임을 뜻한다.
MNIST data MINIST data는 불규칙적인 0-9를 나타내는 손글씨를 정확한 0-9로 인식하는 머신러닝 예제이다. 이 과정에서 training data set과 test data set를 별도로 분리하여 학습과 테스트를 진행하며, 다음과 같은 단어들에 대한 개념이 필요하다.
- epoch
one forward pass and one backward pass of all the training examples
- batch size
the number of training examples in one forward/backward pass. The higher the batch size, the more memory space you'll need.
- iterations
number of passes, each pass using batch size number of examples.
if you have 1000 training examples, and your batch size is 500, then it will take 2 iterations to complete 1 epoch.
- 주요 소스코드
with tf.Session() as sess:
    sess.run(tf.global_variables_initializer())

    # training cycle
    for epoch in range(training_epochs):
        avg_cost = 0
        total_batch = int(mnist.train.num_examples / batch_size) # batch를 수행해야하는 횟수

        for i in range(total_batch):
            batch_xs, batch_ys = mnist.train.next_batch(batch_size) # dataSet에서 batch만큼의 데이터를 가져옴
#            cost_val, _ = sess.run([cost,optimizer],feed_dict={
                    X : batch_xs,
                    Y : batch_ys
                })
            avg_cost += cost_val / total_batch

        print('Epoch:',epoch+1,'\ncost: ',avg_cost)

    ## END training

    print('Accuracy : ',accuracy.eval(session=sess,feed_dict={
                X : mnist.test.images,
                Y : mnist.test.labels
            }))


