Vue JS assignment for 2-3 hours.
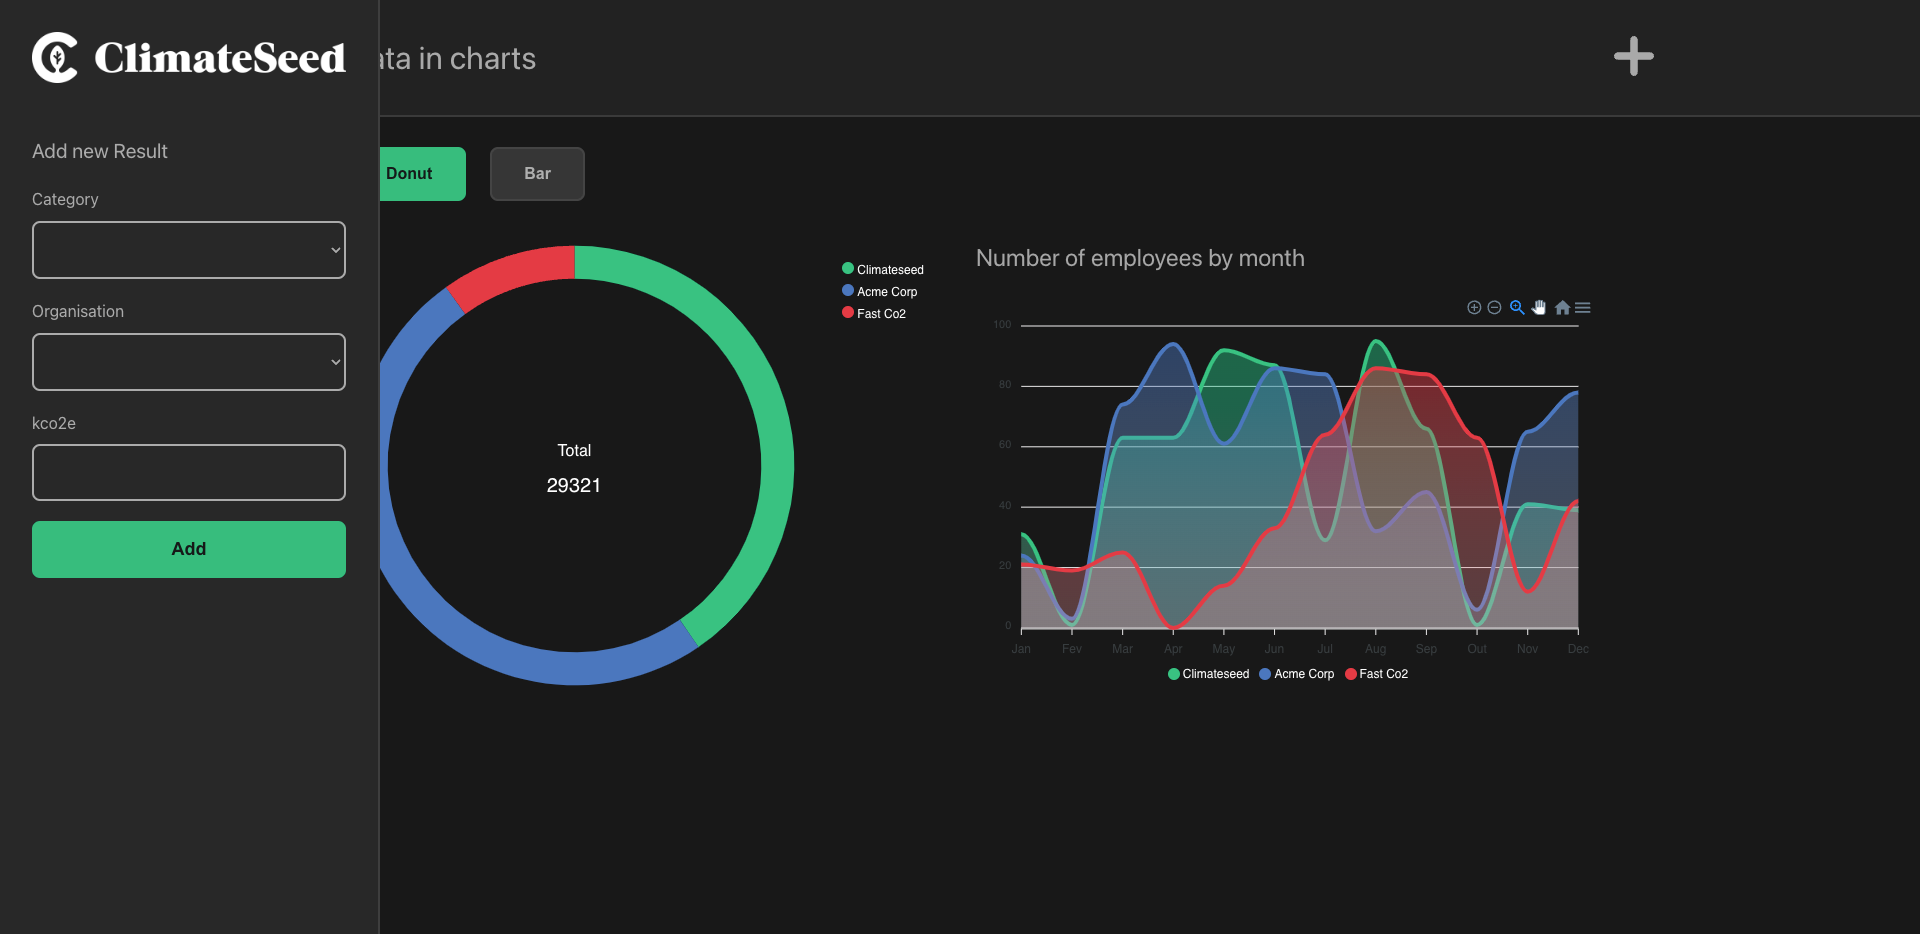
Preview ✅
Preview With Form✅
Config ✅
Change the port to localhost 3000Refactoring ✅
-> Improve the quality of the code of this small app, as an example we set on purpose everything in one store and in one layoutData manipulation ✅
***For this current block please refer to this documentation https://apexcharts.com/docs/chart-types/***
-> Add a switch button to display either the current graph as type donut or bar chart
-> Add a small form for the ***result*** object with the following inputs: selects of **a** category and **an** organisation displaying the name of the object but the value should be its **id** + an input of type number for kco2e. On submit the newly added ***result*** must be provided to the graphs
Creativity ✅
-> Add a graph of your choice with existing data (we have created a graph based on organisation and kco2e but perhaps there are other graphs available) ✅
-> Add some basic styling: the graphs could be in cards with a title related to the output of the graph (Bootstrap, Tailwind or whatever you feel good) ✅
Optional ✅
-> Add some unit tests
-> Add some Typescript interfaces ✅npm installnpm run devnpm run buildRun Unit Tests with Vitest
npm run test:unitLint with ESLint
npm run lint
