How to Enable Dark theme or any other themes in Jupyter Notebook
Python Library to Enable Themes
At first download you should have python installed in your system
- Python 3.4, 3.5, 3.6, 3.7
- Jupyter (Anaconda recommended)
- matplotlib library
# install jupyterthemes
pip install jupyterthemes

# upgrade to latest version
pip install --upgrade jupyterthemes
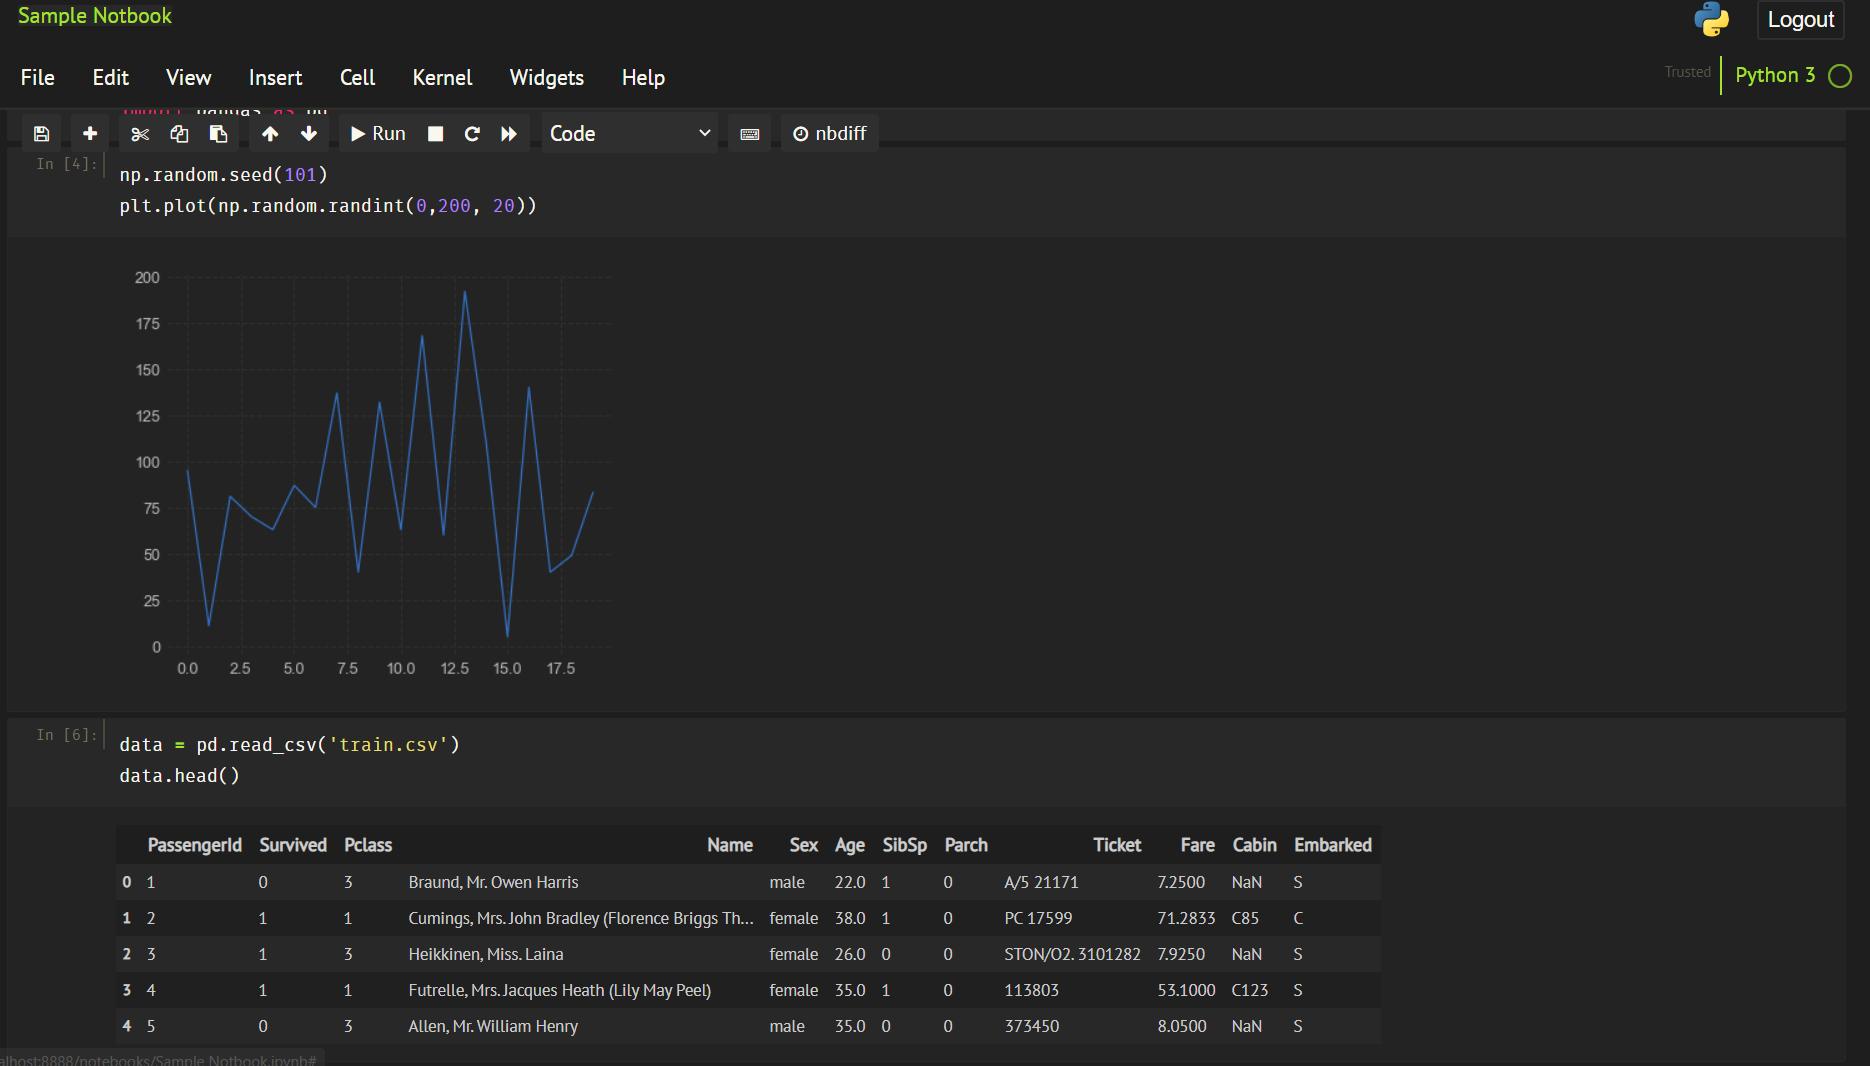
!jt -t monokai -f fira -fs 11 -nf ptsans -nfs 13 -N -kl -cursw 2 -cursc r -cellw 97% -T -dfs 10 -ofs 10

# You can find more details in the Package Github link
# What are the arguments and whats its for

# Like above we have used
# -t        Theme Name to Install
# -f        Code Font
# -fs       Code Font-Size
# -nf       Notebook Font
# -nfs      Notebook Font Size
# -N        Name & Logo Visible
# -cursw    Cursor Width
# -cursc    Cursor Color
# -cellw    Cell Width
# -T        Toolbar Visible
# -dfs      Pandas DF Fontsize
# -ofs Output Area Fontsizejtplot.style() makes changes to matplotlib's rcParams dictionary so that figure aesthetics match those of a chosen jupyterthemes style.
# import jtplot module in notebook
from jupyterthemes import jtplot

# choose which theme to inherit plotting style from
# onedork | grade3 | oceans16 | chesterish | monokai | solarizedl | solarizedd
jtplot.style(theme='onedork')

# set "context" (paper, notebook, talk, poster)
# scale font-size of ticklabels, legend, etc.
# remove spines from x and y axes and make grid dashed
jtplot.style(context='talk', fscale=1.4, spines=False, gridlines='--')

# turn on X- and Y-axis tick marks (default=False)
# turn off the axis grid lines (default=True)
# and set the default figure size
jtplot.style(ticks=True, grid=False, figsize=(6, 4.5))

# reset default matplotlib rcParams
jtplot.reset()
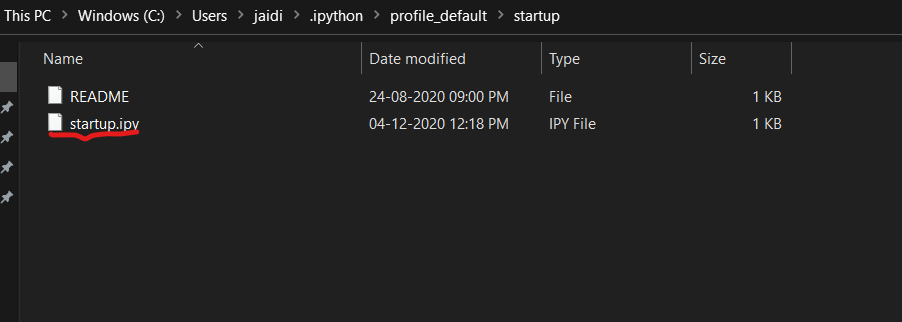
Pro-tip: Include the following two lines in ~/.ipython/profile_default/startup/startup.ipy file to set plotting style automatically whenever you start a notebook, so need of writing these lines on every startup:
# in my case
# import jtplot submodule from jupyterthemes
from jupyterthemes import jtplot

# set the parameters what you need
jtplot.style(theme='monokai',spines=False, gridlines='--')
