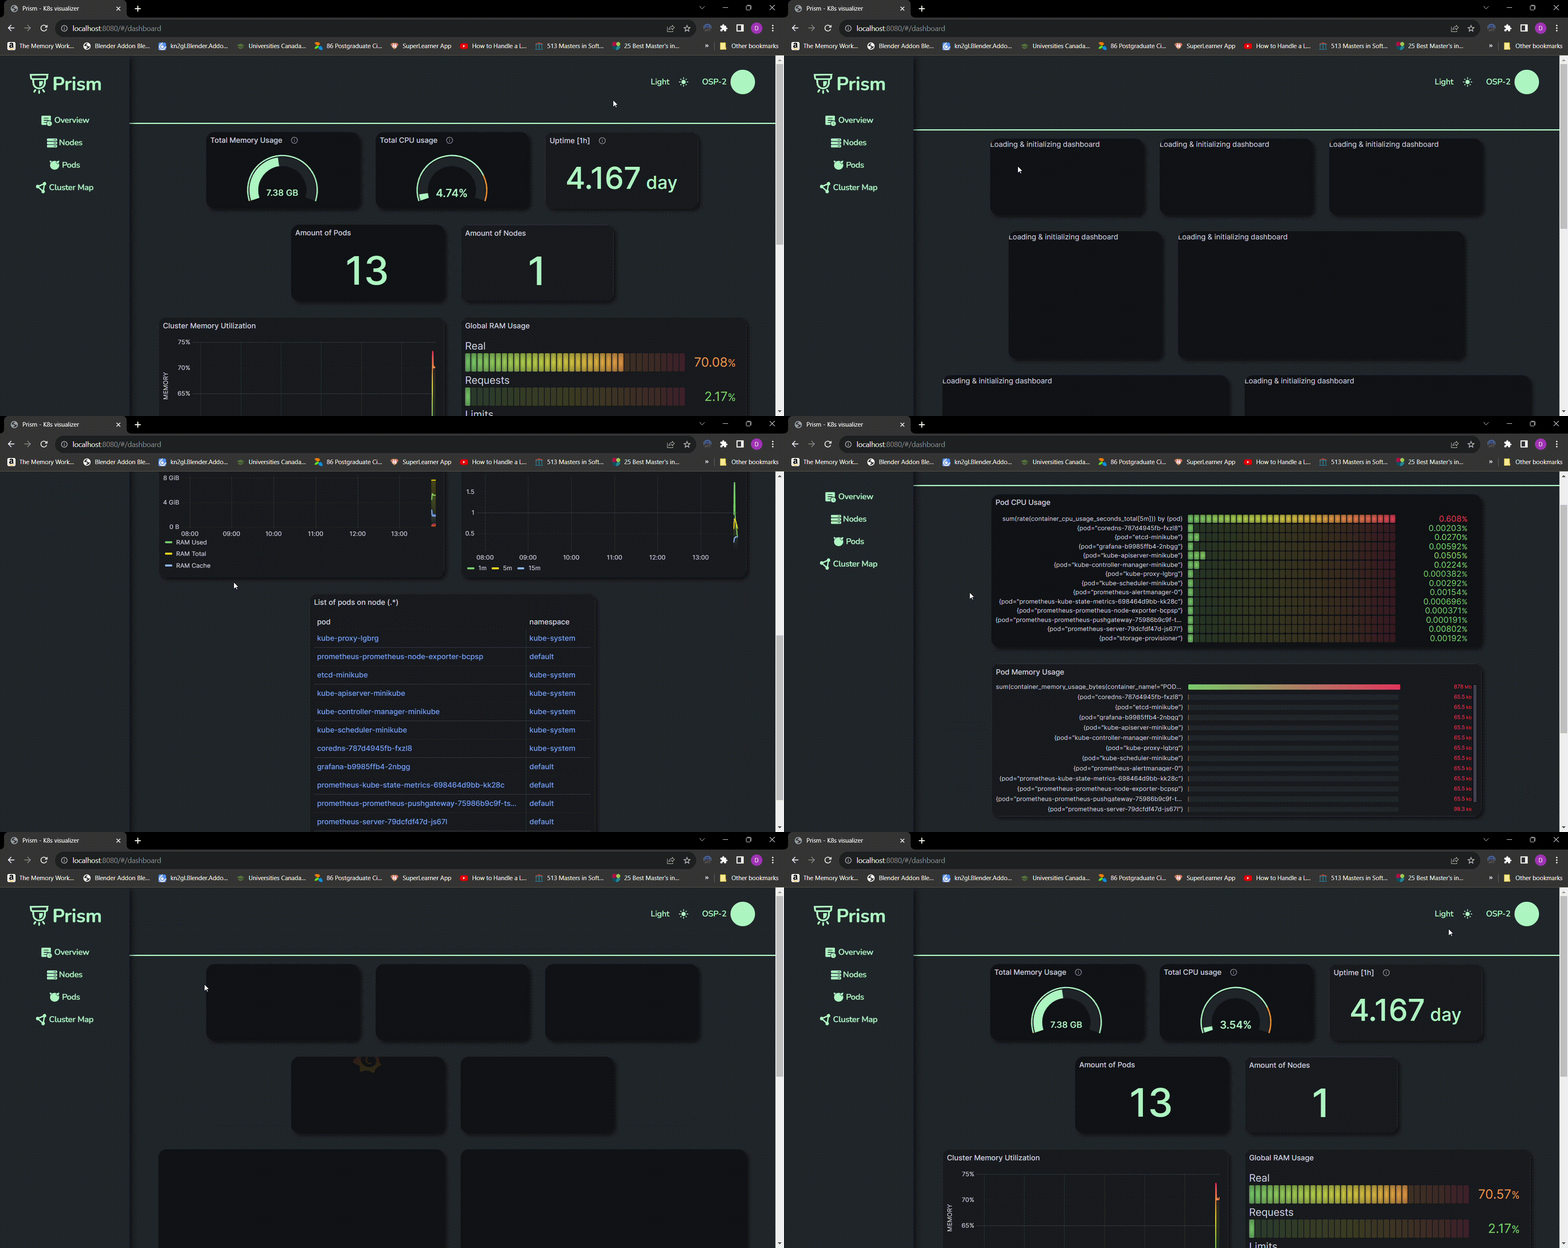
Prism is a Kubernetes and Docker visualizer that helps users understand the status of and relationships between their nodes, pods, services, and containers. It will help developers quickly view their server status and identify problem areas with live metrics and pod health statistics. Our goal for this project was to provide the best possible user experience while minimizing the code a user has to write (everything launches with a single command).
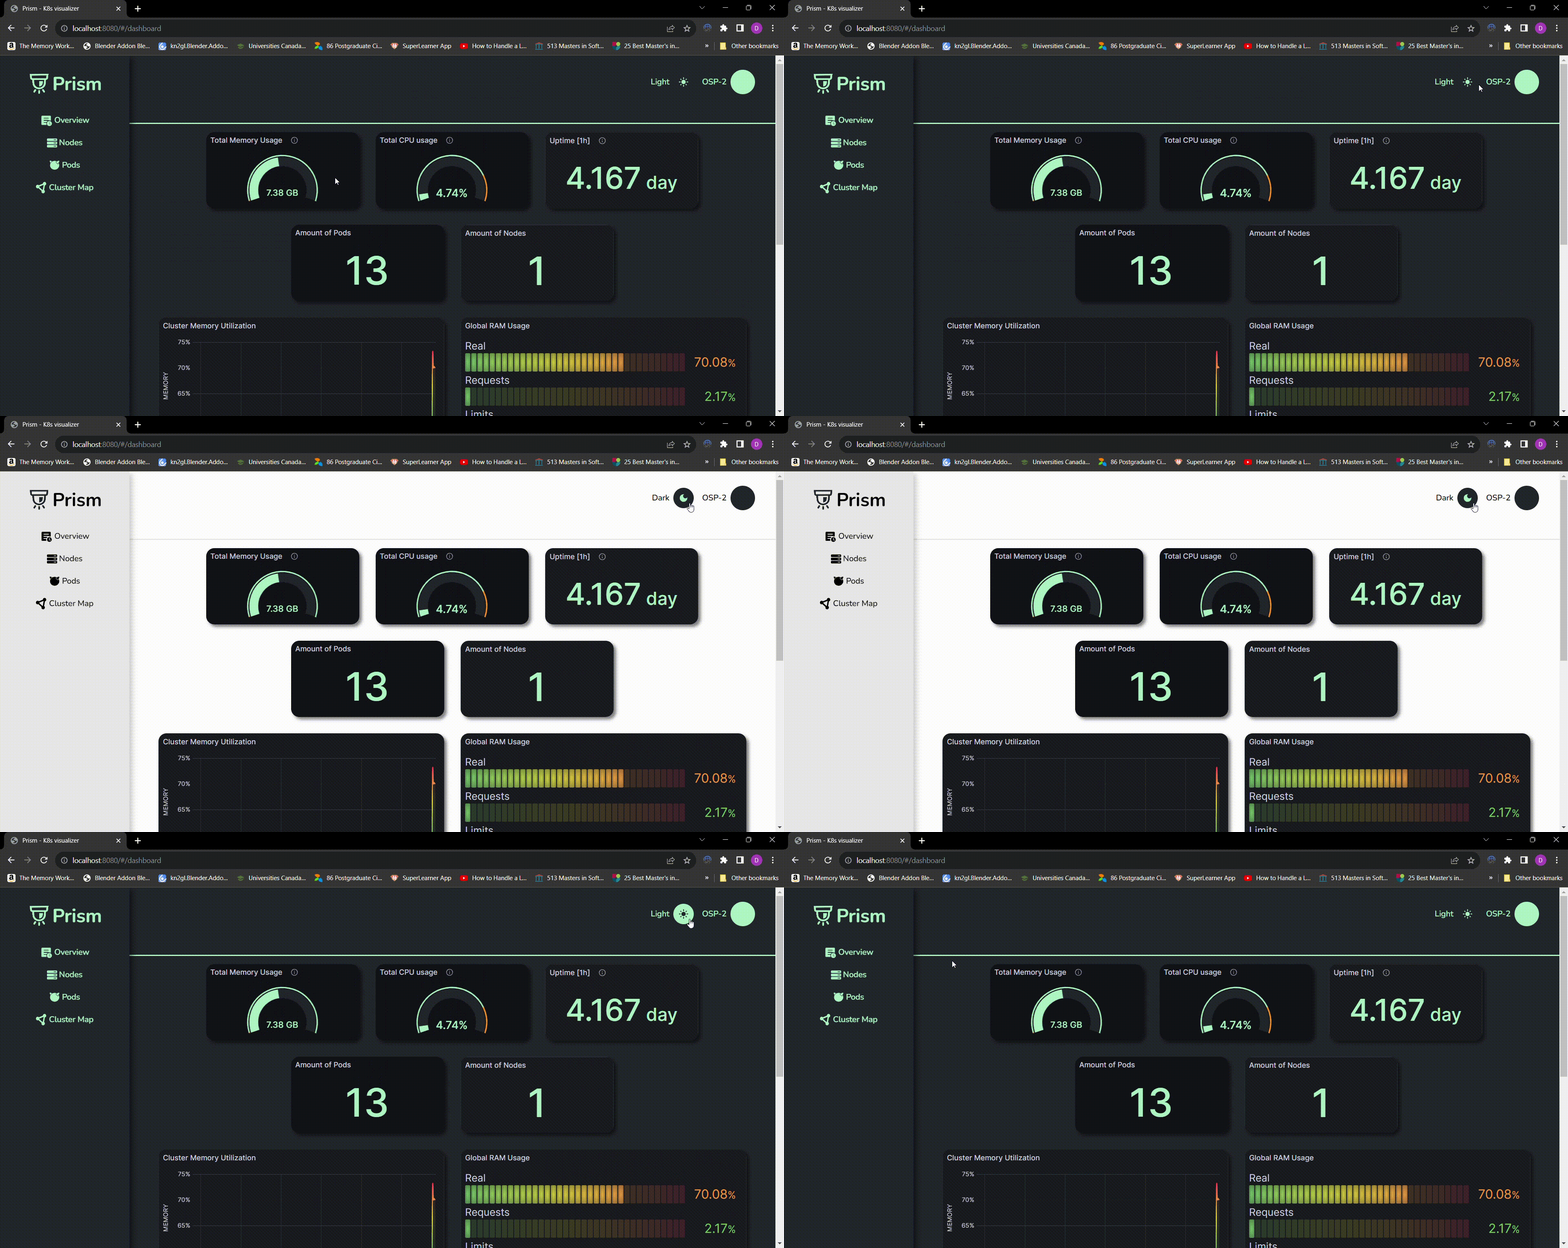
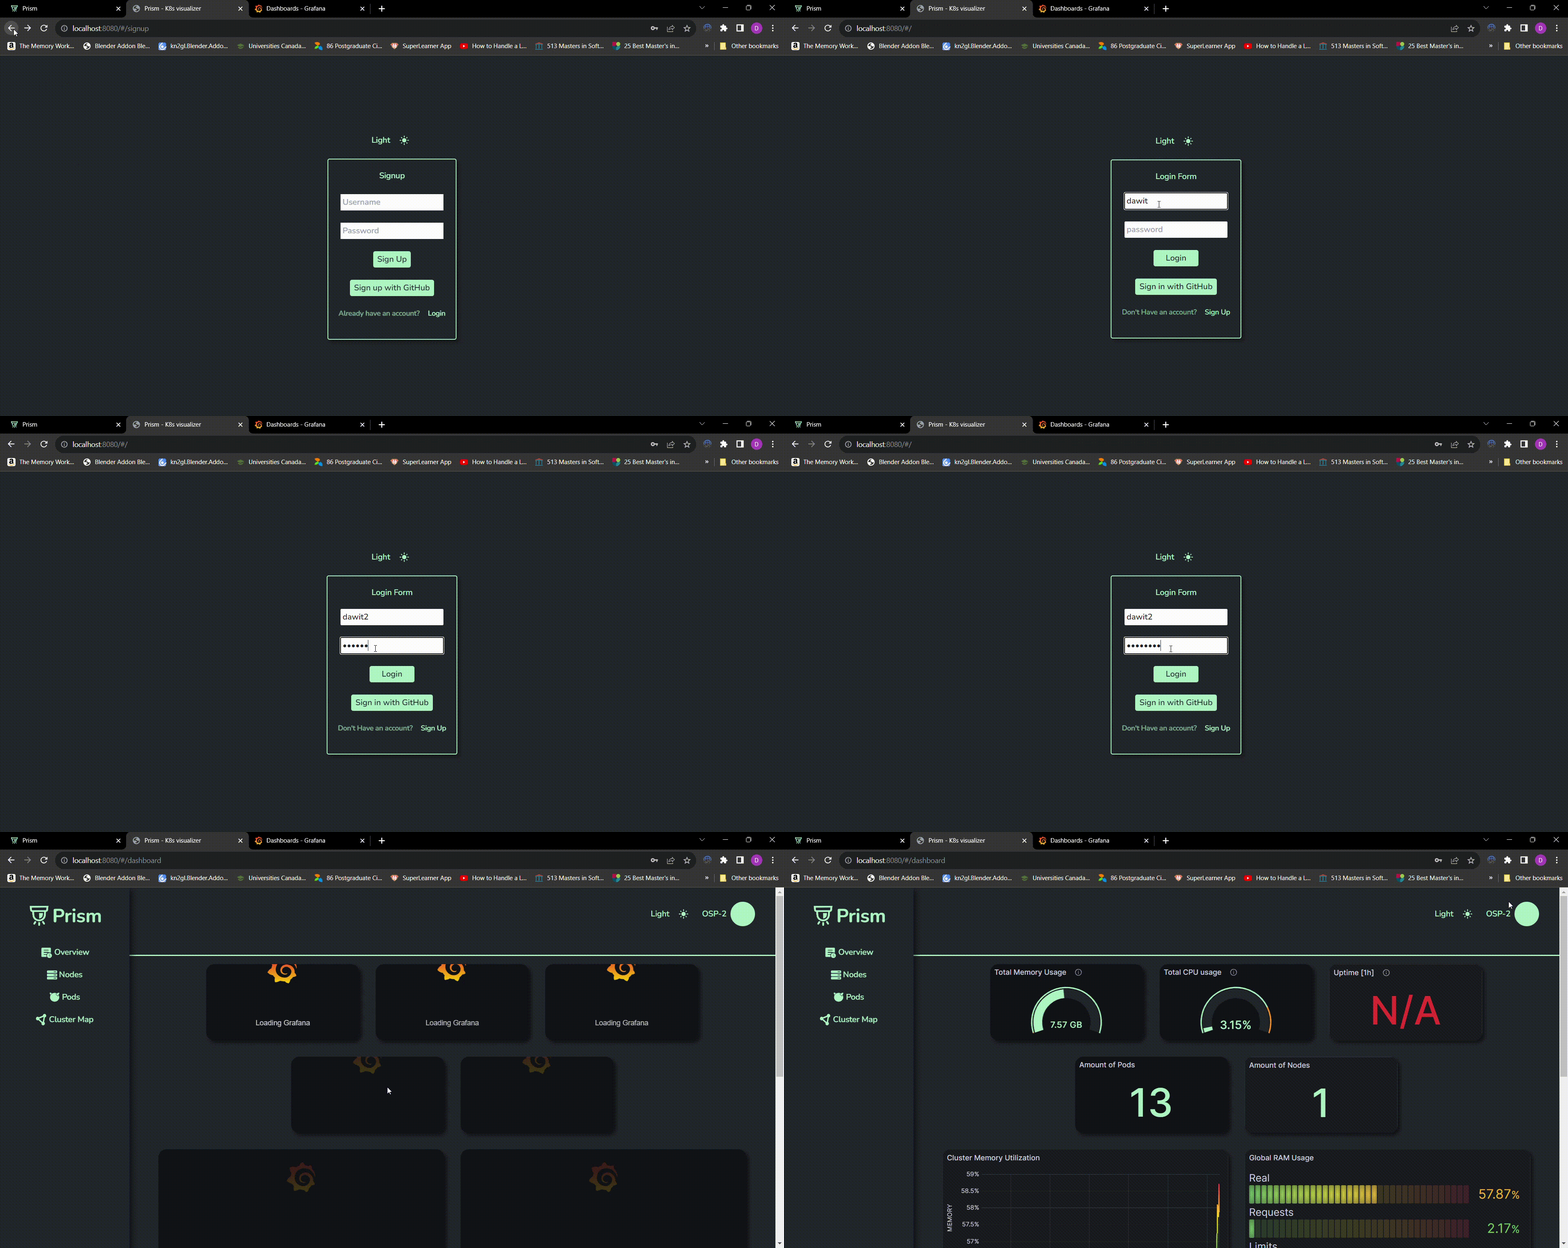
Login to Prism to see your clusters, nodes, and pods automatically. And with a dark/light mode, you can enjoy it how you want.
| Feature | Status |
|---|---|
| Prometheus and Grafana Intergration | ✅ |
| Custom Dashboard | ✅ |
| an Overview, Pods view and Node view of metrics | ✅ |
| SASS and Tailwind CSS | ✅ |
| Typescript conversion | ✅ |
| Testing (React Testing Library/Jest front-end, Supertest backend) | ⏳ |
| Fully intergrated OAuth/User authentication | ⏳ |
| Customizable Dashboards | 🙏🏻 |
| Historcial Data and Trends | 🙏🏻 |
Done = ✅
In Progress = ⏳
Looking for contributors = 🙏🏻
- Running cluster in Kubernetes/ Minikube
- The following ports must be free:
- 8080 ( where the application will be located)
- 3333 (used by the backend of the application)
- 3000 (used by Grafana)
-
Fork the repository and clone to your local machine
-
Set up authentication: Create a
.envfile in the root directory with the following:- (optional) Private auth database: Your MongoDB URI (key
MONGO_URI) - (optional) GitHub OAuth: A client ID and secret key (keys
CLIENT_ID,CLIENT_SECRET) - A secret of your choice for json web tokens (key
JWT_SECRET)
- (optional) Private auth database: Your MongoDB URI (key
-
Execute the startup shell script (run
./startup.zsh) - this will:- Install necessary dependencies for the web application
- Install Prometheus 🔥 and Grafana 📊 onto your cluster with our custom configuration
- Start up the web application
-
Go to
http://localhost:8080and view metrics to your heart's desire 🤩
Once you've done the steps above you'll be able to quickly view live metrics and pod health statistics with ease.
- View our Contributor README
Check out our article on Medium!
- list of all people and our links
- Beserat Tafesse
- Dawit Merid
- James Li
- Josh Hall
- Paul Glenn


