fastKDE calculates a kernel density estimate of arbitrarily dimensioned data; it does so rapidly and robustly using recently developed KDE techniques. It does so with statistical skill that is as good as state-of-the-science 'R' KDE packages, and it does so 10,000 times faster for bivariate data (even better improvements for higher dimensionality).
Please cite the following papers when using this method:
- O’Brien, T. A., Kashinath, K., Cavanaugh, N. R., Collins, W. D. & O’Brien, J. P. A fast and objective multidimensional kernel density estimation method: fastKDE. Comput. Stat. Data Anal. 101, 148–160 (2016). http://dx.doi.org/10.1016/j.csda.2016.02.014
- O’Brien, T. A., Collins, W. D., Rauscher, S. A. & Ringler, T. D. Reducing the computational cost of the ECF using a nuFFT: A fast and objective probability density estimation method. Comput. Stat. Data Anal. 79, 222–234 (2014). http://dx.doi.org/10.1016/j.csda.2014.06.002
For a standard PDF
""" Demonstrate the first README example. """
import numpy as np
import fastkde
import matplotlib.pyplot as plt

#Generate two random variables dataset (representing 100,000 pairs of datapoints)
N = int(1e5)
x = 50*np.random.normal(size=N) + 0.1
y = 0.01*np.random.normal(size=N) - 300

#Do the self-consistent density estimate
PDF = fastkde.pdf(x, y, var_names = ['x', 'y'])

PDF.plot();
For a conditional PDF
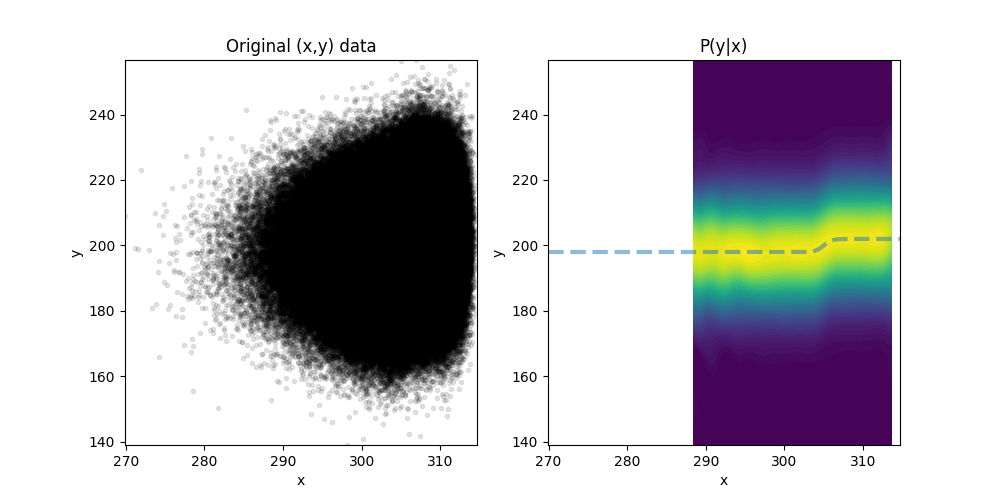
The following code generates samples from a non-trivial joint distribution
#***************************
# Generate random samples
#***************************
# Stochastically sample from the function underlyingFunction() (a sigmoid):
# sample the absicissa values from a gamma distribution
# relate the ordinate values to the sample absicissa values and add
# noise from a normal distribution

#Set the number of samples
numSamples = int(1e6)

#Define a sigmoid function
def underlyingFunction(x,x0=305,y0=200,yrange=4):
        return (yrange/2)*np.tanh(x-x0) + y0

xp1,xp2,xmid = 5,2,305  #Set gamma distribution parameters
yp1,yp2 = 0,12          #Set normal distribution parameters (mean and std)

#Generate random samples of X from the gamma distribution
x = -(np.random.gamma(xp1,xp2,int(numSamples))-xp1*xp2) + xmid
#Generate random samples of y from x and add normally distributed noise
y = underlyingFunction(x) + np.random.normal(loc=yp1,scale=yp2,size=numSamples)
Now that we have the x,y samples, the following code calculates the conditional
#***************************
# Calculate the conditional
#***************************
# note that conditiong variables ('x' in this case) are listed first
# in the var_names argument
cPDF = fastkde.conditional(y, x, var_names = ['x', 'y'])
The following plot shows the results:
#***************************
# Plot the conditional
#***************************
fig,axs = plt.subplots(1,2,figsize=(10,5), sharex=True, sharey=True)

#Plot a scatter plot of the incoming data
axs[0].plot(x,y,'k.',alpha=0.1)
axs[0].set_title('Original (x,y) data')
axs[0].set_xlabel('x')
axs[0].set_ylabel('y')

#Draw a contour plot of the conditional
cPDF.plot(ax = axs[1], add_colorbar = False)
#Overplot the original underlying relationship
axs[1].plot(cPDF.x,underlyingFunction(cPDF.x),linewidth=3,linestyle='--',alpha=0.5)
axs[1].set_title('P(y|x)')

plt.savefig('conditional_demo.png')
plt.show()
Kernel Density Estimate for Specific Points
To see the KDE values at specified points (not necessarily those that were used to generate the KDE):
""" Demonstrate using the pdf_at_points function. """""
import fastkde
train_x = 50*np.random.normal(size=100) + 0.1
train_y = 0.01*np.random.normal(size=100) - 300

test_x = 50*np.random.normal(size=100) + 0.1
test_y = 0.01*np.random.normal(size=100) - 300

test_points = list(zip(test_x, test_y))
test_point_pdf_values = fastkde.pdf_at_points(train_x, train_y, list_of_points = test_points)
Note that this method can be significantly slower than calls to fastkde.pdf() since it does not benefit from using a fast Fourier transform during the final stage in which the PDF estimate is transformed from spectral space into data space, whereas fastkde.pdf() does.
python -m pip install fastkde
See LICENSE.txt

