Based on learning from DoctorK we have created and open sourced Orion, a more capable system for management of Kafka and other distributed systems. Orion addresses the shortcomings of DoctorK and also adds new features like topic management, rolling restarts, rolling upgrades, stuck consumer remediation etc. Orion has been stabily managing our entire kafka fleet for >6months.
DoctorK is a service for Kafka cluster auto healing and workload balancing. DoctorK can automatically detect broker failure and reassign the workload on the failed nodes to other nodes. DoctorK can also perform load balancing based on topic partitions's network usage, and makes sure that broker network usage does not exceed the defined settings. DoctorK sends out alerts when it is not confident on taking actions.
- Automated cluster healing by moving partitions on failed brokers to other brokers
- Workload balancing among brokers
- Centralized management of multiple kafka clusters
Design details are available in docs/DESIGN.md.
git clone [git-repo-url] doctork
cd doctorkmvn package -pl kafkastats -amKafkastats is a kafka broker stats collector that runs on kafka brokers and reports broker stats to some kafka topic based on configuration. The following is the kafkastats usage.
usage: KafkaMetricsCollector
 -broker <arg>                      kafka broker
 -disable_ec2metadata               Disable the collection of host information using ec2metadata
 -jmxport <kafka jmx port number>   kafka jmx port number
 -kafka_config <arg>                kafka server properties file path
 -ostrichport <arg>                 ostrich port
 -pollingintervalinseconds <arg>    polling interval in seconds
 -primary_network_ifacename <arg>   network interface used by kafka
 -producer_config <arg>             kafka_stats producer config
 -topic <arg>                       kafka topic for metric messages
 -tsdhostport <arg>                 tsd host and port, e.g.
                                    localhost:18621
 -uptimeinseconds <arg>             uptime in seconds
 -zookeeper <arg>                   zk url for metrics topic
The following is a sample command line for running kafkastats collector:
java -server \
    -Dlog4j.configurationFile=file:./log4j2.xml \
    -cp lib/*:kafkastats-0.2.4.10.jar \
    com.pinterest.doctork.stats.KafkaStatsMain \
        -broker 127.0.0.1 \
        -jmxport 9999 \
        -topic brokerstats \
        -zookeeper zookeeper001:2181/cluster1 \
        -uptimeinseconds 3600 \
        -pollingintervalinseconds 60 \
        -ostrichport 2051 \
        -tsdhostport localhost:18126 \
        -kafka_config /etc/kafka/server.properties \
        -producer_config /etc/kafka/producer.properties \
        -primary_network_ifacename eth0
Using the above command as an example, after the kafkastats process is up, we can check the process stats using curl -s command, and view the logs under /var/log/kafkastats.
curl -s localhost:2051/stats.txt
The following is a sample upstart scripts for automatically restarting kafkastats if it fails:
   start on runlevel [2345]
   respawn
   respawn limit 20 5

   env NAME=kafkastats
   env JAVA_HOME=/usr/lib/jvm/java-8-oracle
   env STATSCOLLECTOR_HOME=/opt/kafkastats
   env LOG_DIR=/var/log/kafkastats
   env HOSTNAME=$(hostname)

   script
       DAEMON=$JAVA_HOME/bin/java
       CLASSPATH=$STATSCOLLECTOR_HOME:$STATSCOLLECTOR_HOME/*:$STATSCOLLECTOR_HOME/lib/*
       DAEMON_OPTS="-server -Xmx800M -Xms800M -verbosegc -Xloggc:$LOG_DIR/gc.log \
       -XX:+UseGCLogFileRotation -XX:NumberOfGCLogFiles=20 -XX:GCLogFileSize=20M \
       -XX:+UseG1GC -XX:MaxGCPauseMillis=250 -XX:G1ReservePercent=10 -XX:ConcGCThreads=4 \
       -XX:ParallelGCThreads=4 -XX:G1HeapRegionSize=8m -XX:InitiatingHeapOccupancyPercent=70 \
       -XX:ErrorFile=$LOG_DIR/jvm_error.log \
       -cp $CLASSPATH"
       exec $DAEMON $DAEMON_OPTS -Dlog4j.configuration=${LOG_PROPERTIES} \
                    com.pinterest.doctork.stats.KafkaStatsMain \
                    -broker 127.0.0.1 \
                    -jmxport 9999 \
                    -topic brokerstats \
                    -zookeeper zookeeper001:2181/cluster1 \
                    -uptimeinseconds 3600 \
                    -pollingintervalinseconds 60 \
                    -ostrichport 2051 \
                    -tsdhostport localhost:18126 \
                    -kafka_config /etc/kafka/server.properties \
                    -producer_config /etc/kafka/producer.properties \
                    -primary_network_ifacename eth0
Edit doctork/config/*.properties files to specify parameters describing the environment. Those files contain
comments describing the meaning of individual parameters.
mvn package -pl doctork -am
mvn package
mkdir ${DOCTORK_INSTALL_DIR} # directory to place DoctorK binaries in.
tar -zxvf target/doctork-0.2.4.10-bin.tar.gz -C ${DOCTORK_INSTALL_DIR}cd ${DOCTORK_INSTALL_DIR}
java -server \
-cp lib/*:doctork-0.2.4.10.jar \
com.pinterest.doctork.DoctorKMain \
server dropwizard_yaml_fileThe above dropwizard_yaml_file is the path to a standard DropWizard configuration file
that only requires the following line pointing to your doctork.properties path.
config: $doctork_config_properties_file_path
Edit src/main/config/*.properties files to specify parameters describing the environment.
Those files contain comments describing the meaning of individual parameters.
DoctorK comes with a number of tools implementing interactions with the environment.
cd ${DOCTORK_INSTALL_DIR}
java -server \
    -Dlog4j.configurationFile=file:doctork/config/log4j2.xml \
    -cp doctork/target/lib/*:doctork/target/doctork-0.2.4.10.jar \
    com.pinterest.doctork.tools.ClusterLoadBalancer \
        -brokerstatstopic  brokerstats \
        -brokerstatszk zookeeper001:2181/cluster1 \
        -clusterzk zookeeper001:2181,zookeeper002:2181,zookeeper003:2181/cluster2 \
        -config ./doctork/config/doctork.properties \
        -seconds 3600
Cluster load balancer balances the workload among brokers to make sure the broker network usage does not exceed the threshold.
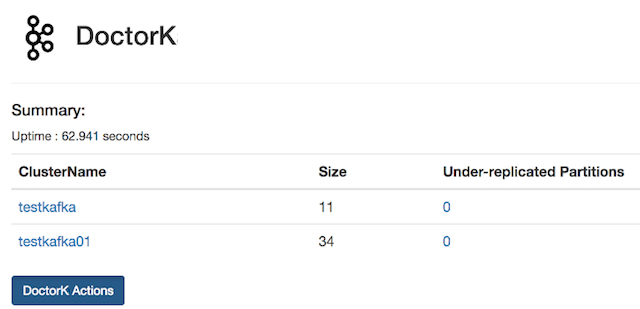
DoctorK uses dropwizard-core module and serving assets to provide a web UI. The following is the screenshot from a demo:
The following APIs are available for DoctorK:
- List Cluster
- Maintenance Mode
Detailed description of APIs can be found docs/APIs.md
DoctorK is distributed under Apache License, Version 2.0.
