- image: image path (string) or image value (numpy array)
- heatmap: 2-D numpy value (no shape restriction)
- (optional) gaussian filter: mosaic smoothing (gaussian_std, default is 10. when set to 0, means no filter apply)
from HeatMap import HeatMap
# input a image path and a numpy array heatmap
hm = HeatMap('demo_image.jpg',heat_map)
# or input a numpy array image and heatmap
hm = HeatMap(image,heat_map,gaussian_std=0)- transparency: define the transparency of heamap overlay (lower -> more transparent, default is 0.7)
- color_map: color map style (default is bwr)
- show_axis: show axis or not (boolean
True/False, default isFalse) - show_original: show original image (boolean
True/False, default isFalse) - show_colorbar: show color bar (boolean
True/False, default isFalse) - width_pad: the width padding (default is 0, set to negative value for reducing the space between figures)
#simple default plot
hm.plot()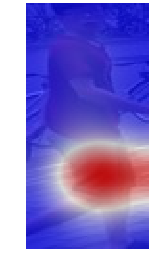
#customised plot
hm.plot(transparency=0.6,
        color_map='seismic',
        show_axis=True,
        show_original=True,
        show_colorbar=True,
        width_pad=-10)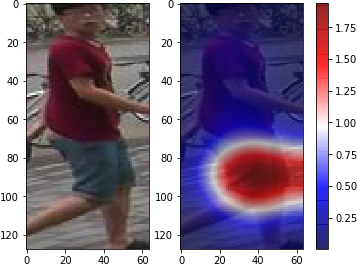
- filename: filename for saved figure (string)
- save_path: figure saving directory (default is the current working directory)
- formate: figure saving fomate (jpg, jpeg, png, pdf, ps, eps and svg), default is 'png'
- transparency: define the transparency of heamap overlay (lower -> more transparent, default is 0.7)
- color_map: color map style (default is bwr)
- show_axis: show axis or not (boolean
True/False, default isFalse) - show_original: show original image (boolean
True/False, default isFalse) - show_colorbar: show color bar (boolean
True/False, default isFalse) - width_pad: the width padding (default is 0, set to negative value for reducing the space between figures)
- other parameters from pyplot.savefig can be used here
# simple save
hm.save('heatmap_result_1')
# customised save
hm.save('heatmap_result_2','png',
transparency=0.6,
color_map='seismic',
show_axis=True,
show_original=True,
show_colorbar=True,
width_pad=-10)