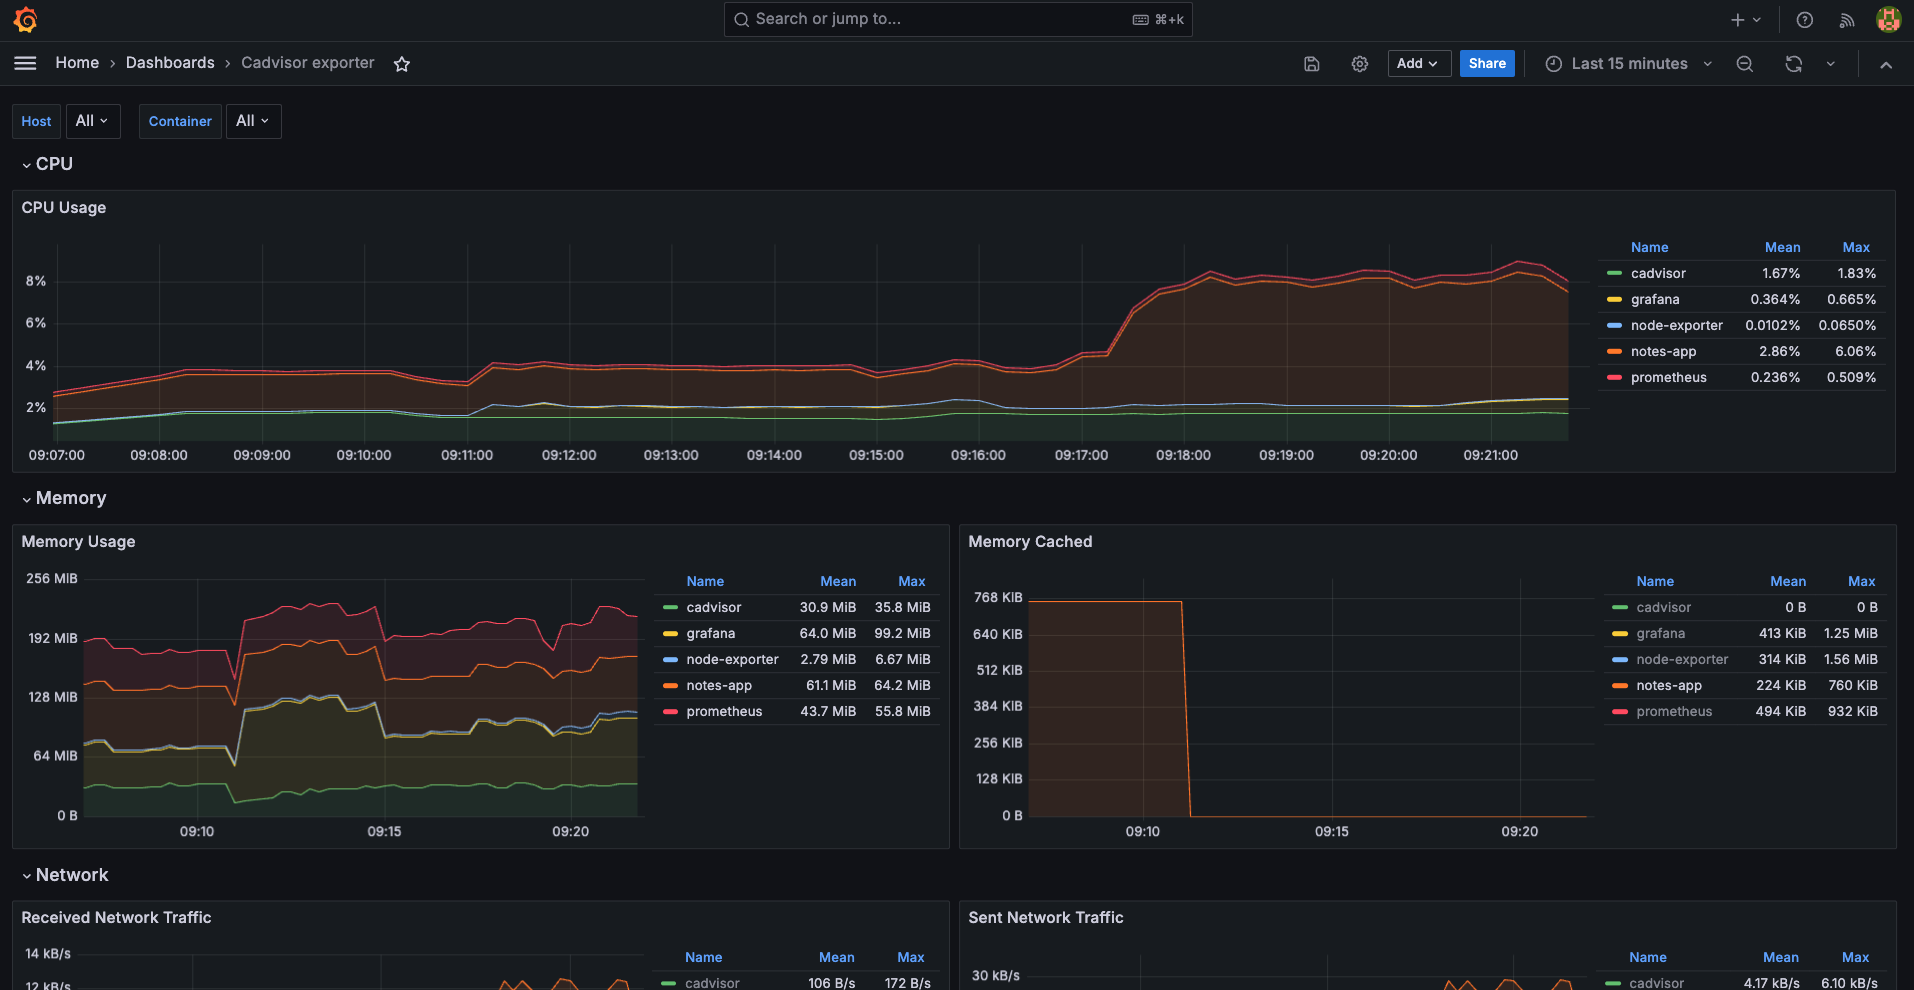
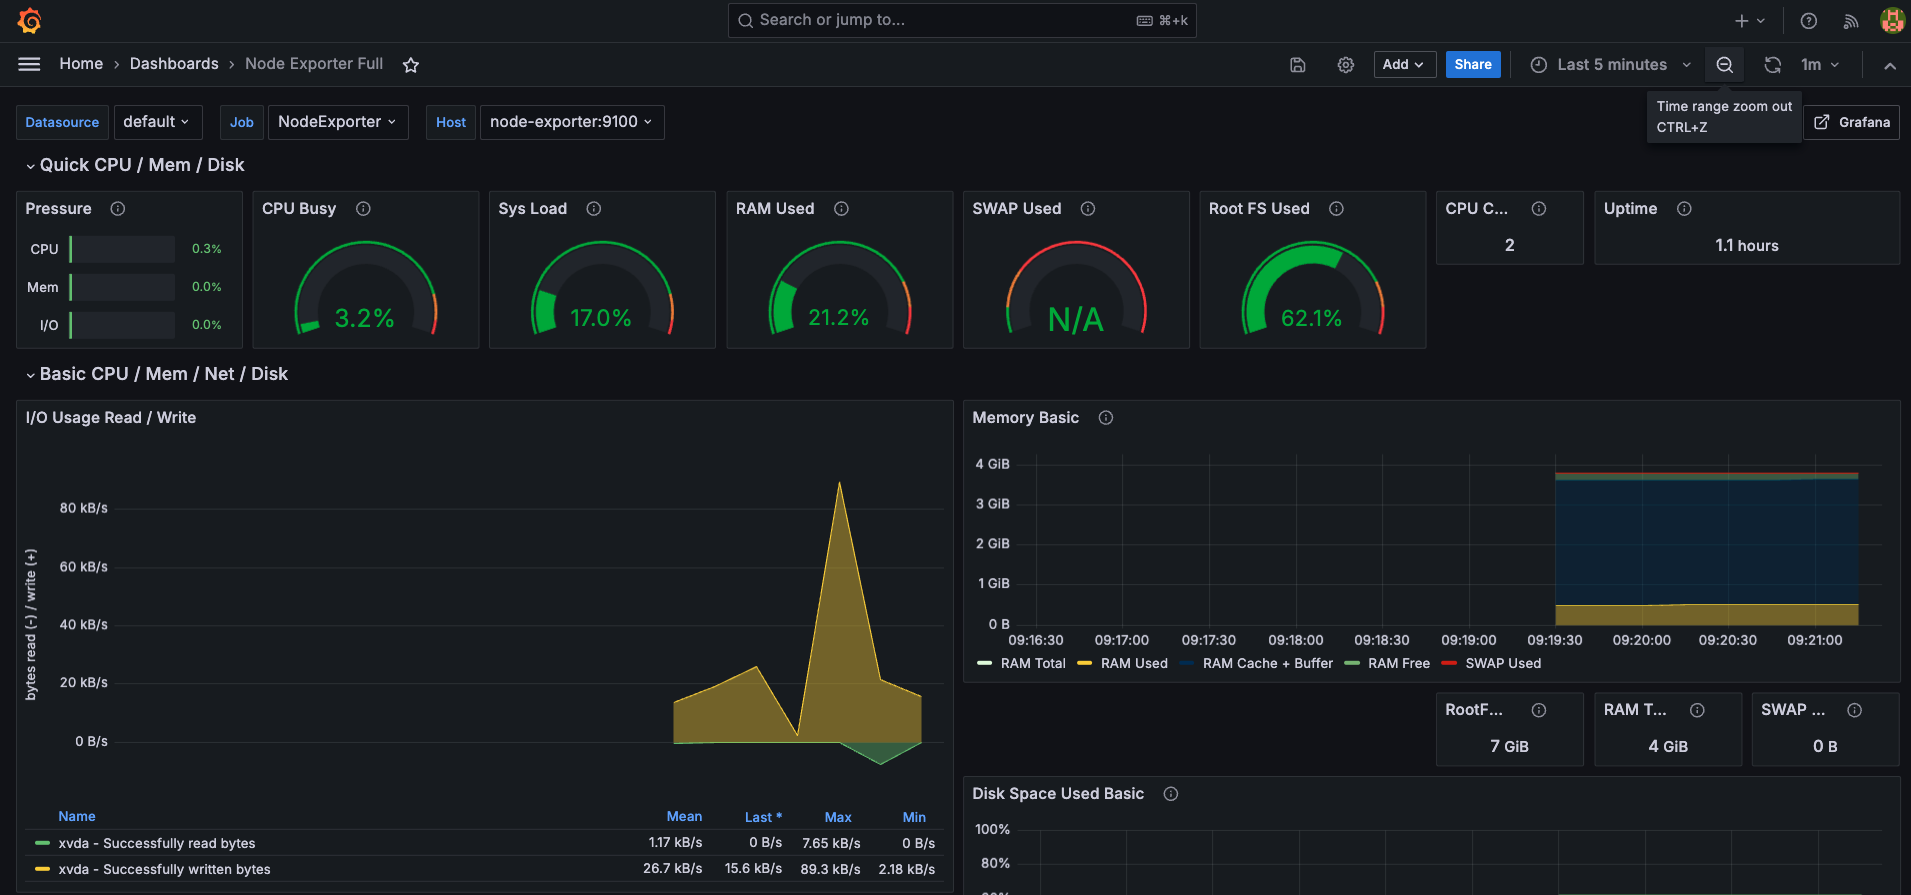
This repository provides a comprehensive observability stack tailored for DevOps engineers. It integrates key tools like Prometheus, Grafana, cAdvisor, and Node Exporter to monitor, visualize, and manage your infrastructure and applications. Additionally, it includes a custom Notes App to demonstrate the observability stack in action.
- Overview
- Tech Stack
- Features
- Installation
- Usage
- Services
- Volumes
- Network
- Monitoring Setup
- Contributing
- License
In modern DevOps, observability is key to ensuring the health and performance of your applications and infrastructure. This repository sets up an observability stack that includes metrics collection, container monitoring, and real-time visualization.
- Docker & Docker Compose: Containerization and orchestration.
- Prometheus: Metrics collection and monitoring.
- Grafana: Data visualization and dashboard creation.
- cAdvisor: Container resource monitoring.
- Node Exporter: Hardware and OS metrics exporter.
- Notes App: A custom service to demonstrate monitoring.
- Real-time monitoring of container metrics with Prometheus.
- Visualize metrics using Grafana dashboards.
- Monitor hardware, OS metrics, and custom application performance.
- Easily extendable for additional services and metrics.
- Persistent data storage for Prometheus and Grafana.
-
Clone the repository:
git clone https://github.com/yourusername/Observability-For-DevOps.git cd Observability-For-DevOps -
Ensure Docker and Docker Compose are installed:
-
Download Prometheus config file:
wget https://raw.githubusercontent.com/prometheus/prometheus/main/documentation/examples/prometheus.yml
-
Run the stack:
docker compose up -d
- Access Grafana at
http://localhost:3000- Default credentials:
admin/admin(you'll be prompted to change this)
- Default credentials:
- Access Prometheus at
http://localhost:9090 - Access cAdvisor at
http://localhost:8080 - Node Exporter metrics will be available at
http://localhost:9100/metrics - Access Notes App at
http://localhost:8000
- Grafana: Visualization tool for Prometheus data.
- Prometheus: Collects and stores metrics.
- Node Exporter: Exports hardware and OS-level metrics.
- cAdvisor: Provides container resource usage and performance metrics.
- Notes App: Sample application to demonstrate monitoring.
prometheus_data: Stores Prometheus data persistently.grafana_data: Stores Grafana dashboards and data persistently.
- monitoring: Custom bridge network to ensure isolation and communication between services.
- Grafana Dashboards: Pre-configured to visualize data from Prometheus.
- Prometheus Configuration: Configured to scrape metrics from Node Exporter, cAdvisor, and Notes App.
Contributions are welcome! Please submit a pull request or open an issue for any changes or improvements.
This project is licensed under the MIT License - see the LICENSE file for details.

