This project aims to study presence of global warming and analyse key factors that may contribute to it through analysis of Data obtained from NASA and NOAA sources.
- Extraction of data from multiple FTP sources ( NASA, NOAA) in csv, JSON and .NAS formats
- Data cleaning using Pandas involved - filtering data only after 1975 - Interpolating missing values with row-wise mean for numerical values - Correcting data formats( eg. number string to floats etc.,) - Finally, cleaned Data was grouped and summarized
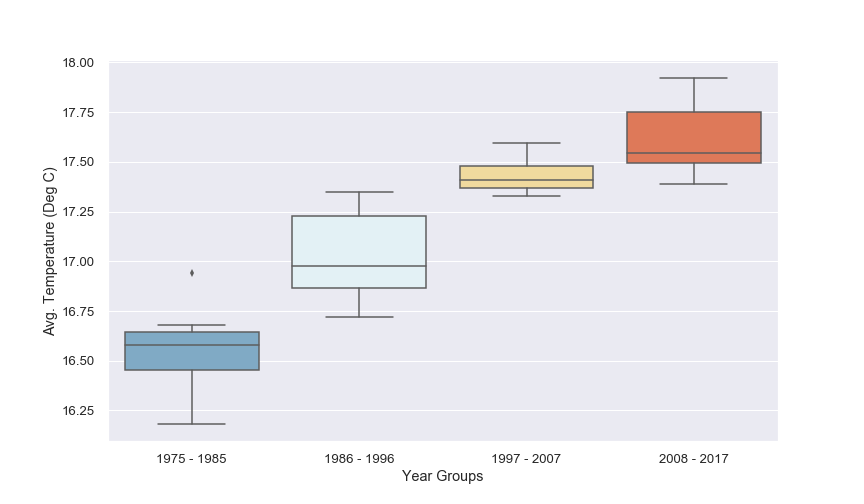
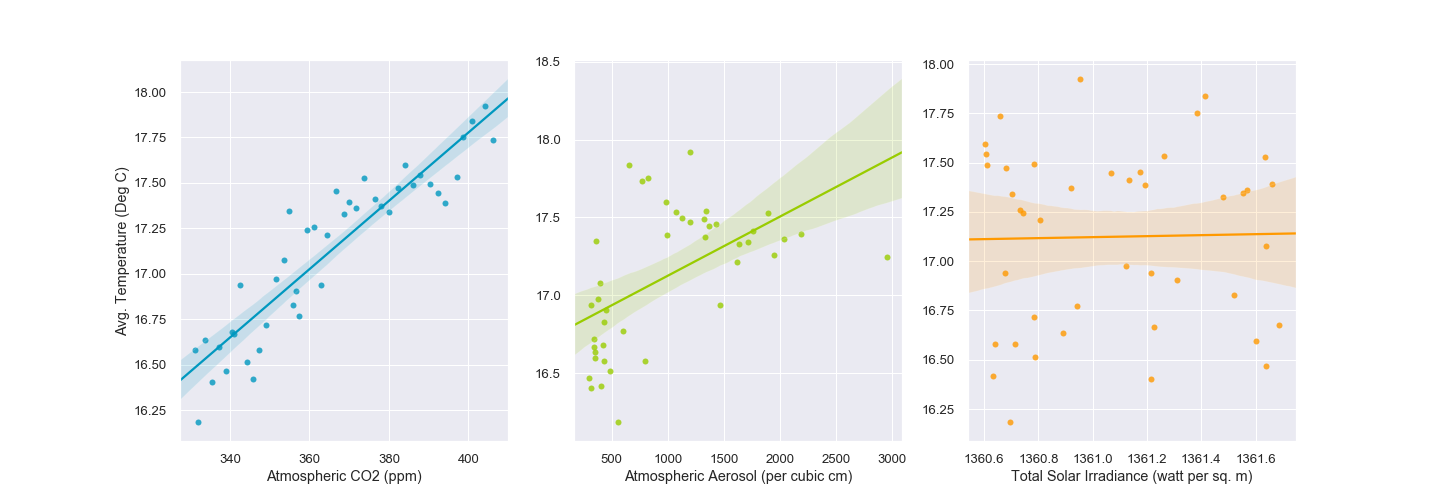
- First level of analysis was conducted by visualizing data using Seaborn Library.
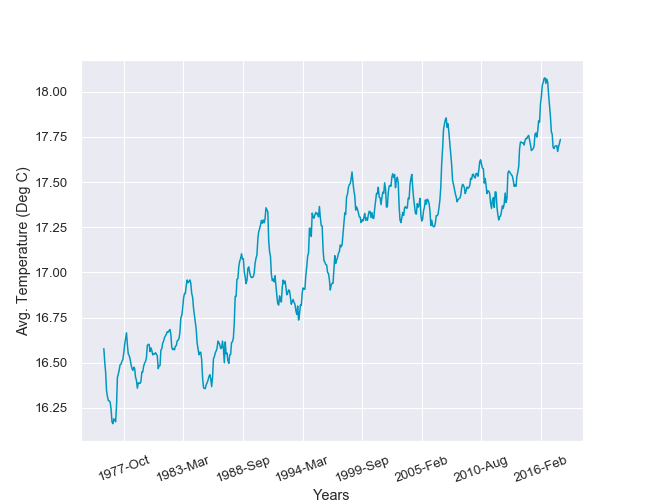
- Simple time-series plots and scatter plots were created to understand global temperature trends.
- The resulting plot is as below


