- Main Blurb
- Target Audience
- User Experience
- Design Choices
- Features
- Images
- Testing
- Encountered Bugs
- My Algorithm's
- Languages
- Deployment
- Credits
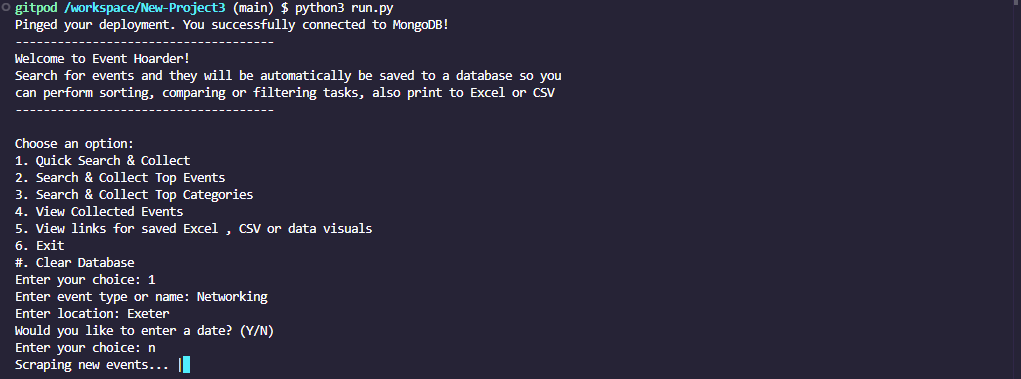
This project is led with the idea of collecting event data as you search, saved automatically to a wipeable database, to then perform various data manipulation tasks on this user-collected data, with no request restrictions either. The main data features are:
- Sort Events
- Free events
- Cheapest events
- Most expensive events
- Events happening soon
- Closest distance events
- Compare Events
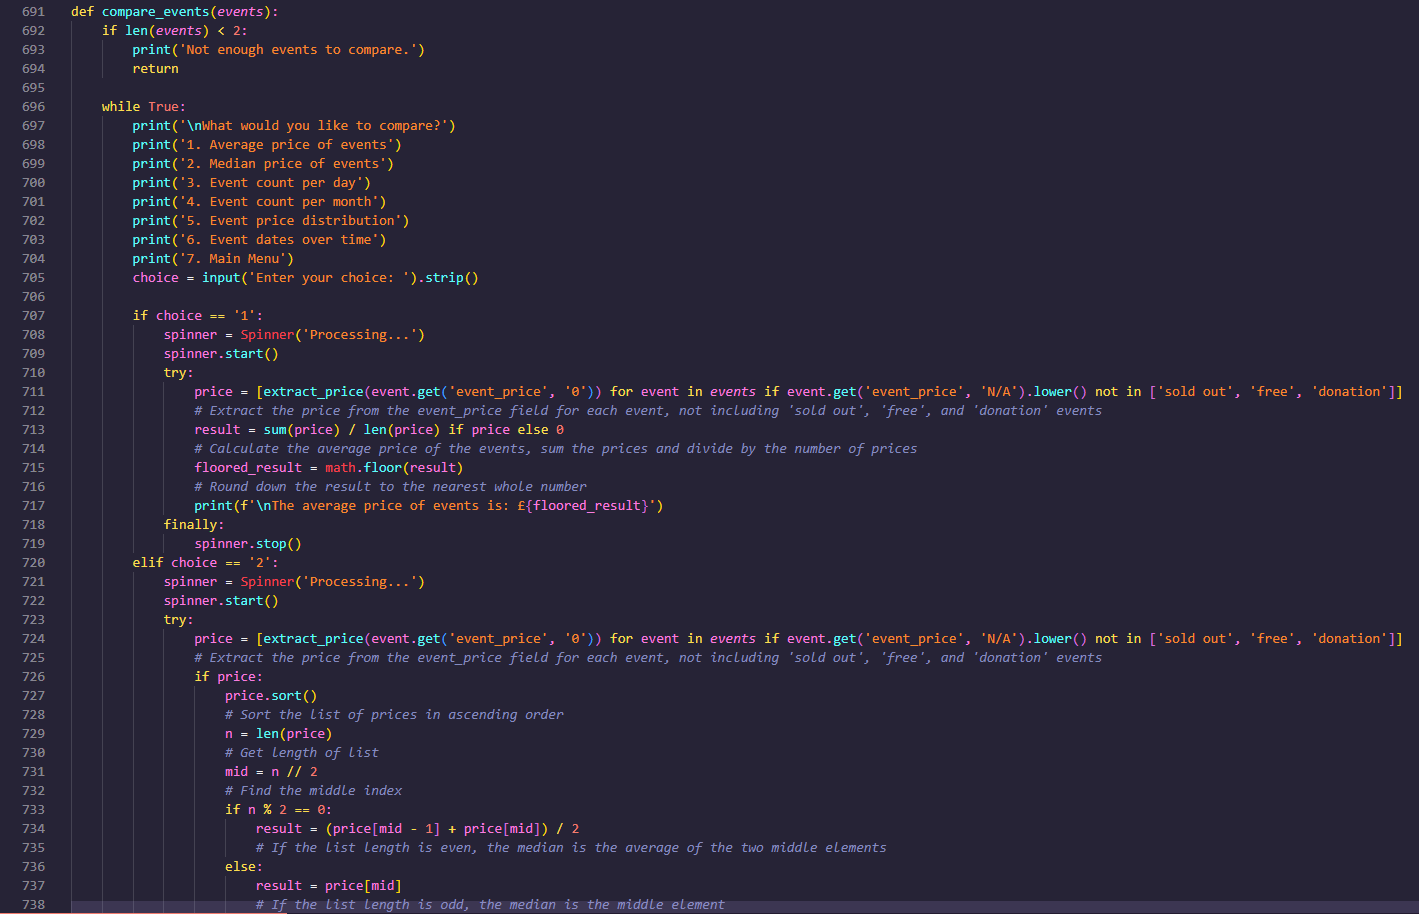
- Average price of events
- Median price of events
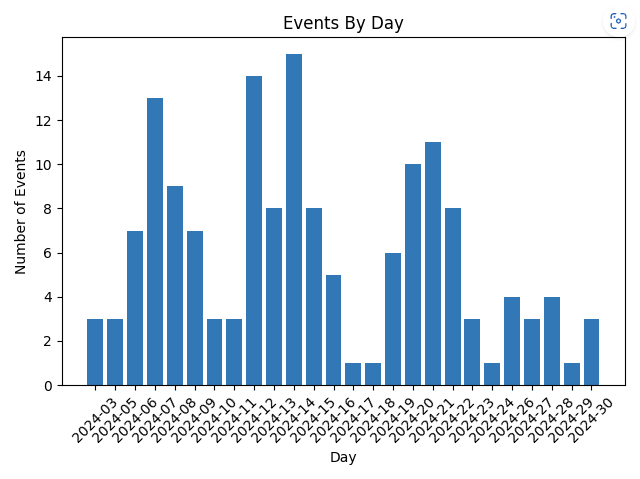
- Event count per day
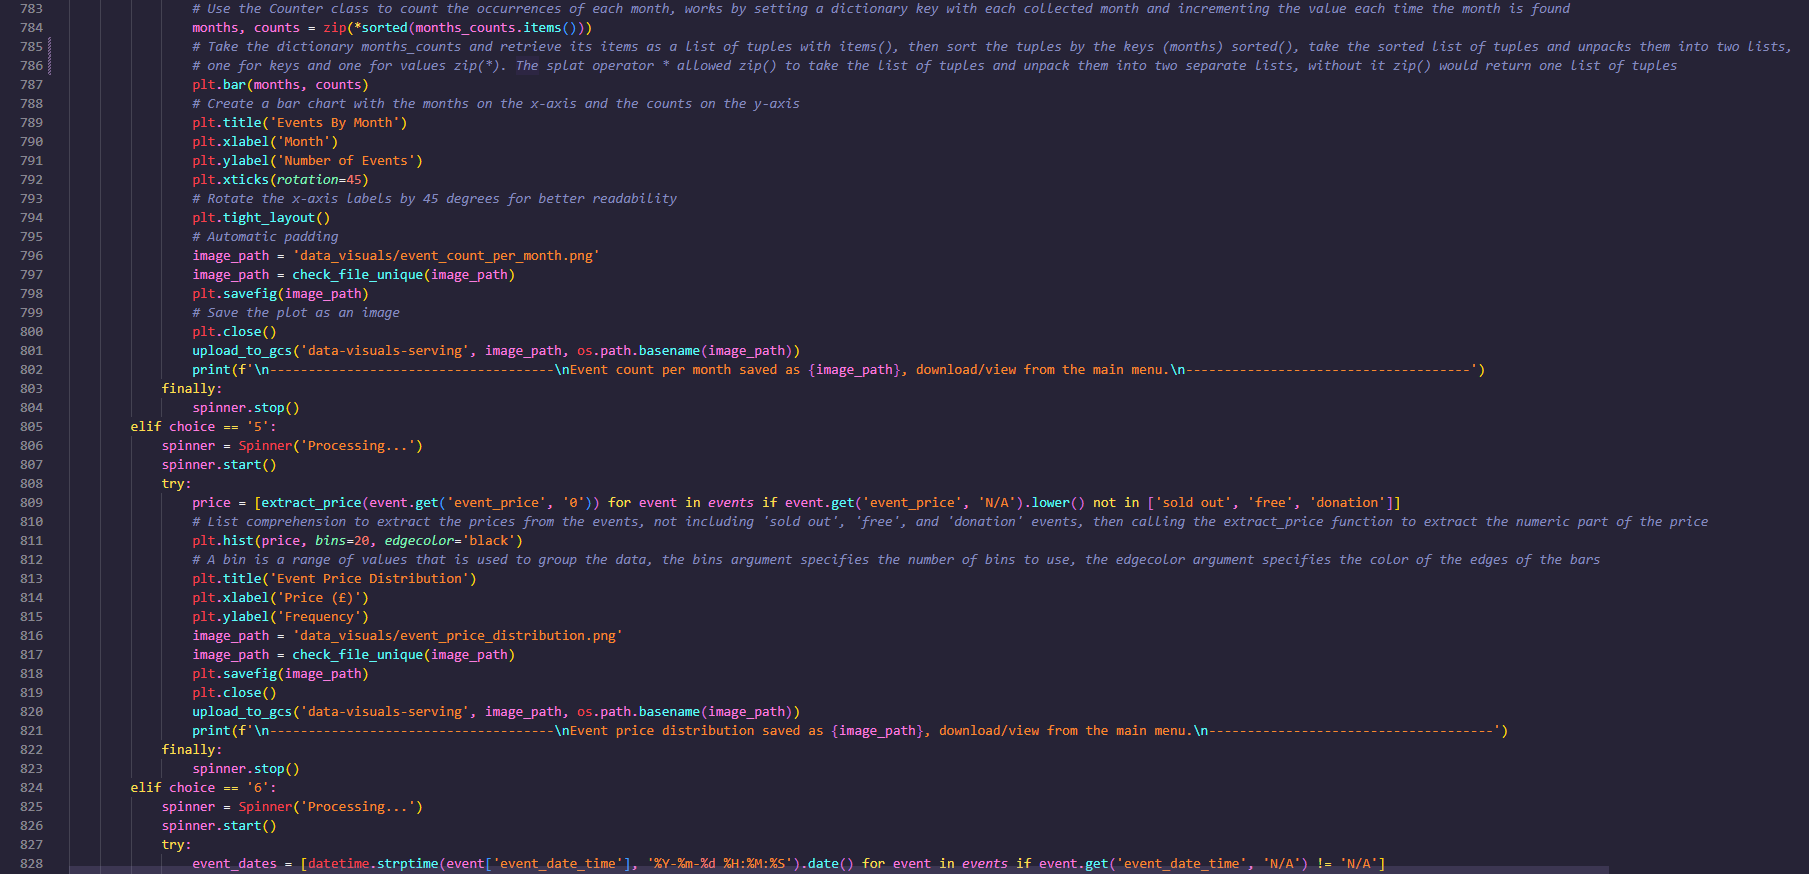
- Event count per month
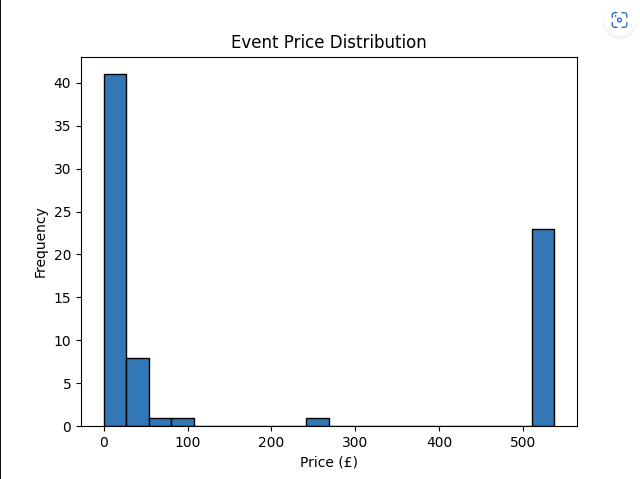
- Event price distribution
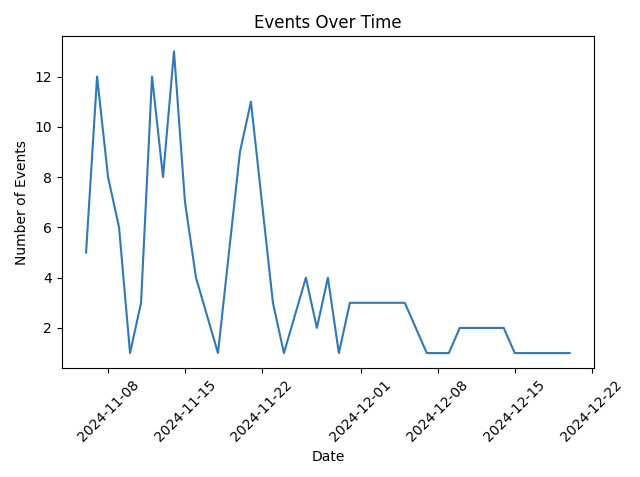
- Event dates over time
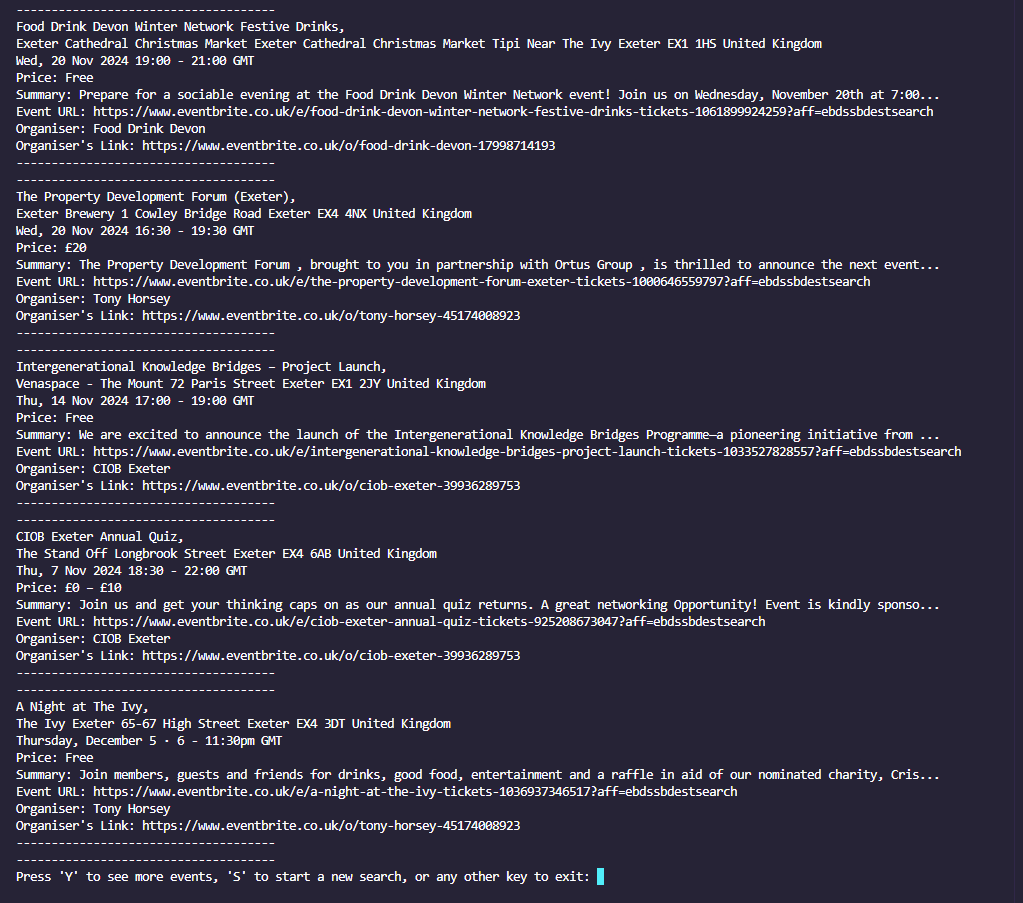
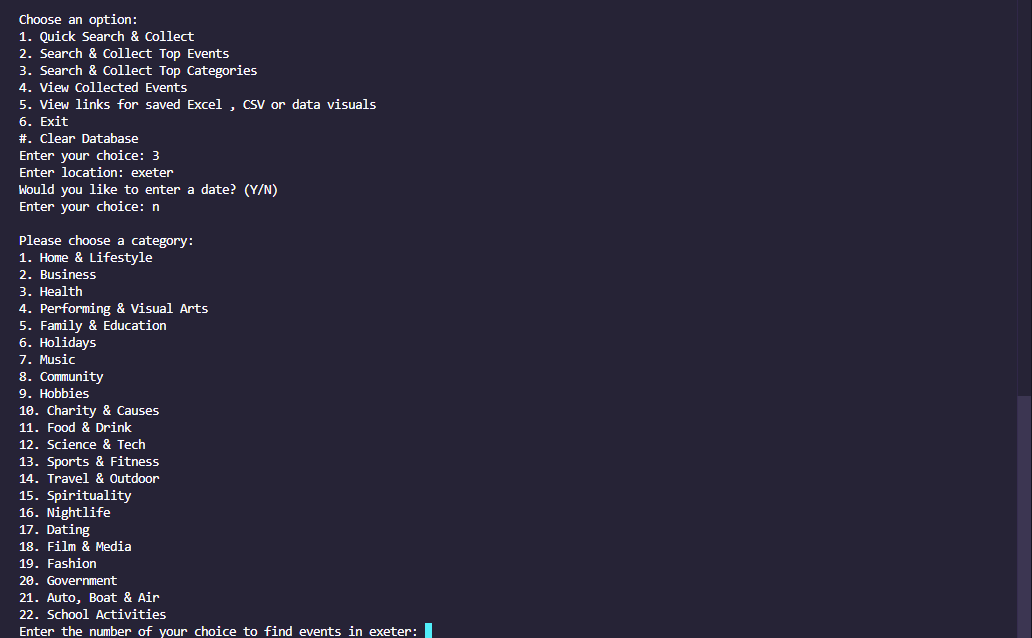
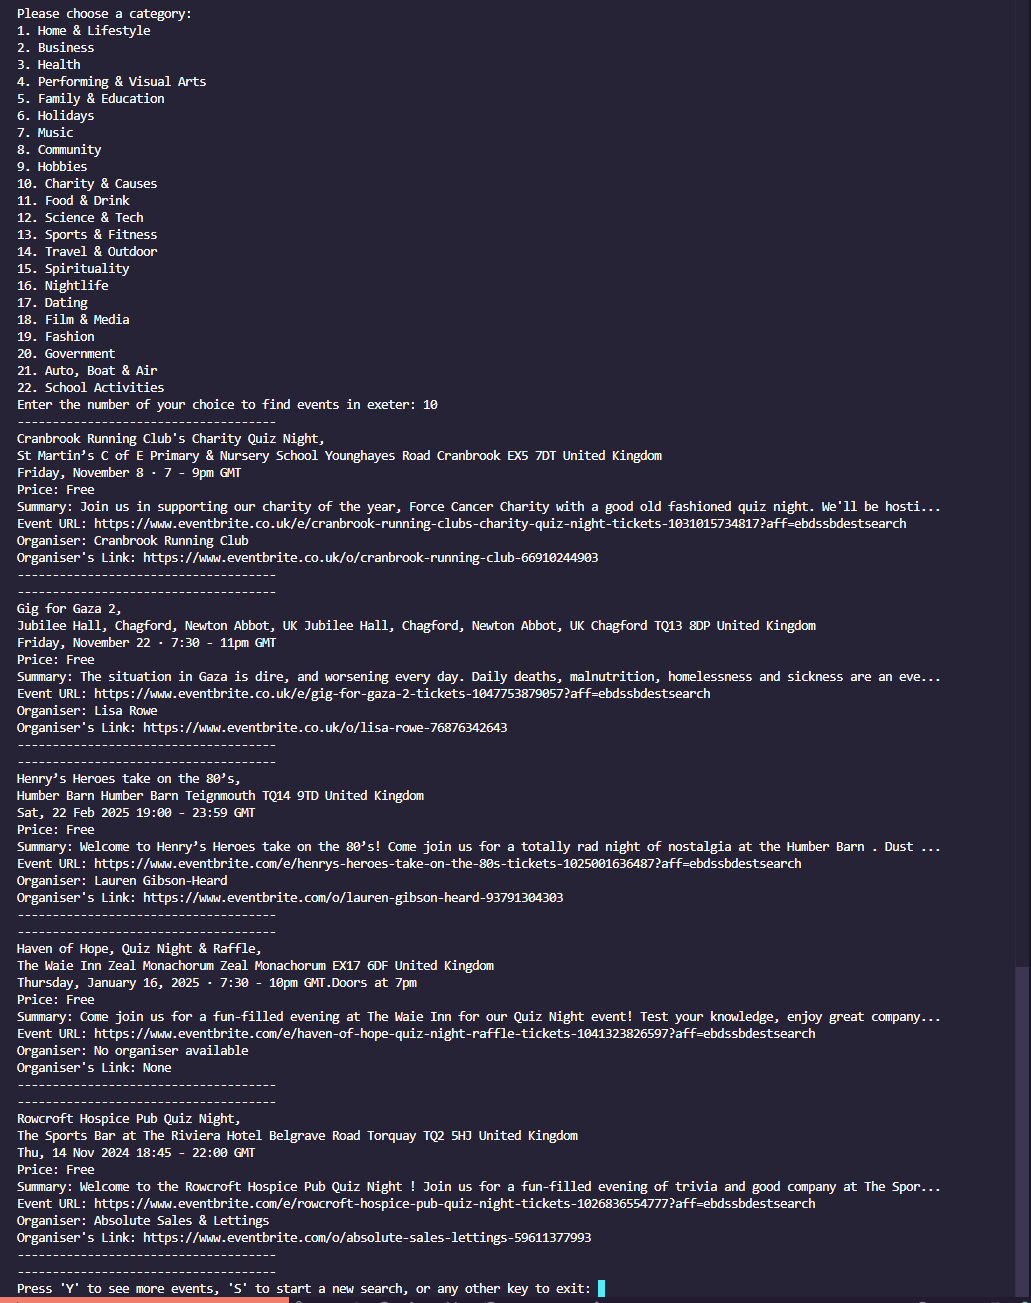
You may scrape for events by specific dates and top event categories, or just search for top events in your area.
My target audience would ideally be a wide range of age groups between 13 and 65. Events cater to a wide range of age groups and my application includes searching for almost anything, and also within any date optionally specified.
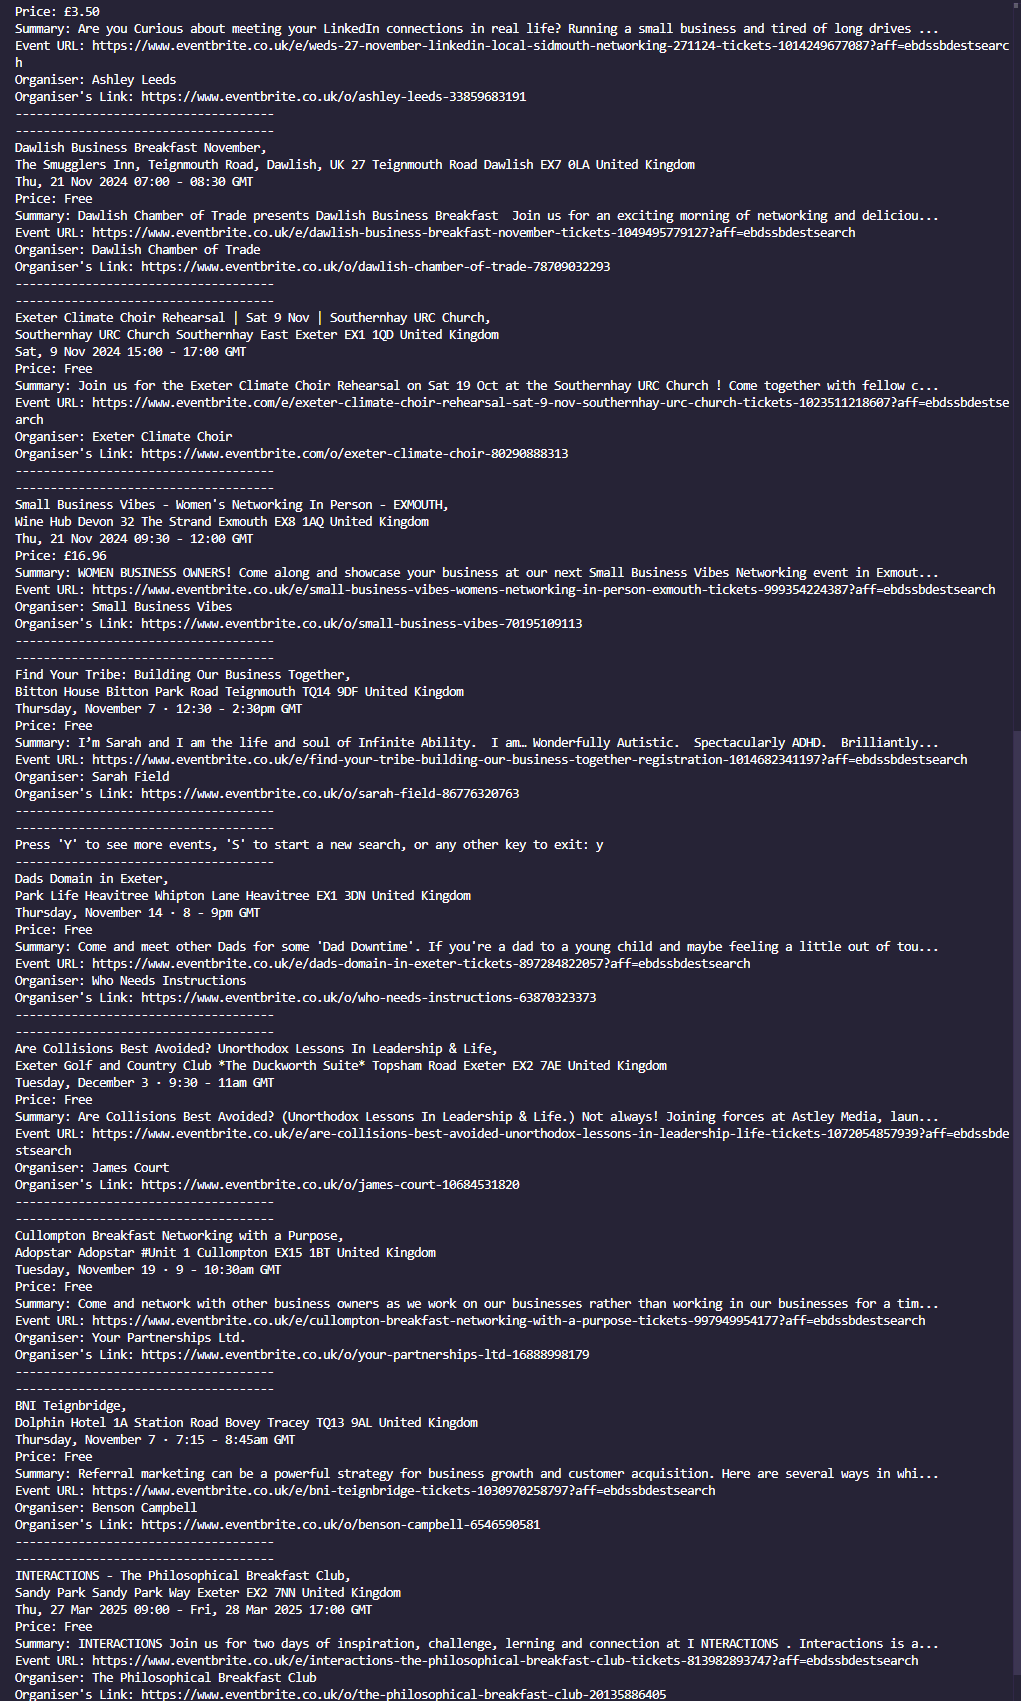
Event-Hoarder is designed to be user-friendly and efficient. Users can quickly search for events based on various criteria and have the data automatically saved for further analysis. The console-based interface ensures a straightforward experience, while the backend handles data storage and processing seamlessly.
This is a console-based Python application that includes 24 modules and libraries. Event data is stored in a MongoDB and user-created CSV/Excel or data graph/visualizations are stored in Google Cloud Storage (GCS) with links being provided to access and download this content. Event data is stored indefinitely until wiped, although CSV/Excel or data graph/visualizations are deleted on program exit, so do view or save these before you close. I chose Eventbrite.co.uk to be selected to scrape from after trying out multiple other websites (Ticketmaster, TicketWeb, Universe) I found that Eventbrite was very relaxed on bots on their site and found it very interesting looking through their web code. Graph visualizations are generated with the help from the matplotlib.pyplot library. I was attracted to this library as it offered easy customization of generated visualizations. BeautifulSoup was used as my scraper tool and I loved its easy to understand commands such as 'get_text()' or 'find()' & 'find_all()'. Geopy library has been very usefull for calculating distances between the user and events, it does this with the geodesic distance which is more accurate than the haversine formula for calculating distance between two points on the earths surface as it accounts for the earths ellipsoidal shape.
- Event Sorting: Easily find free, cheapest, most expensive, soonest, and closest events.
- Event Comparison: Analyze average and median prices, event counts by day or month, price distribution, and event dates over time.
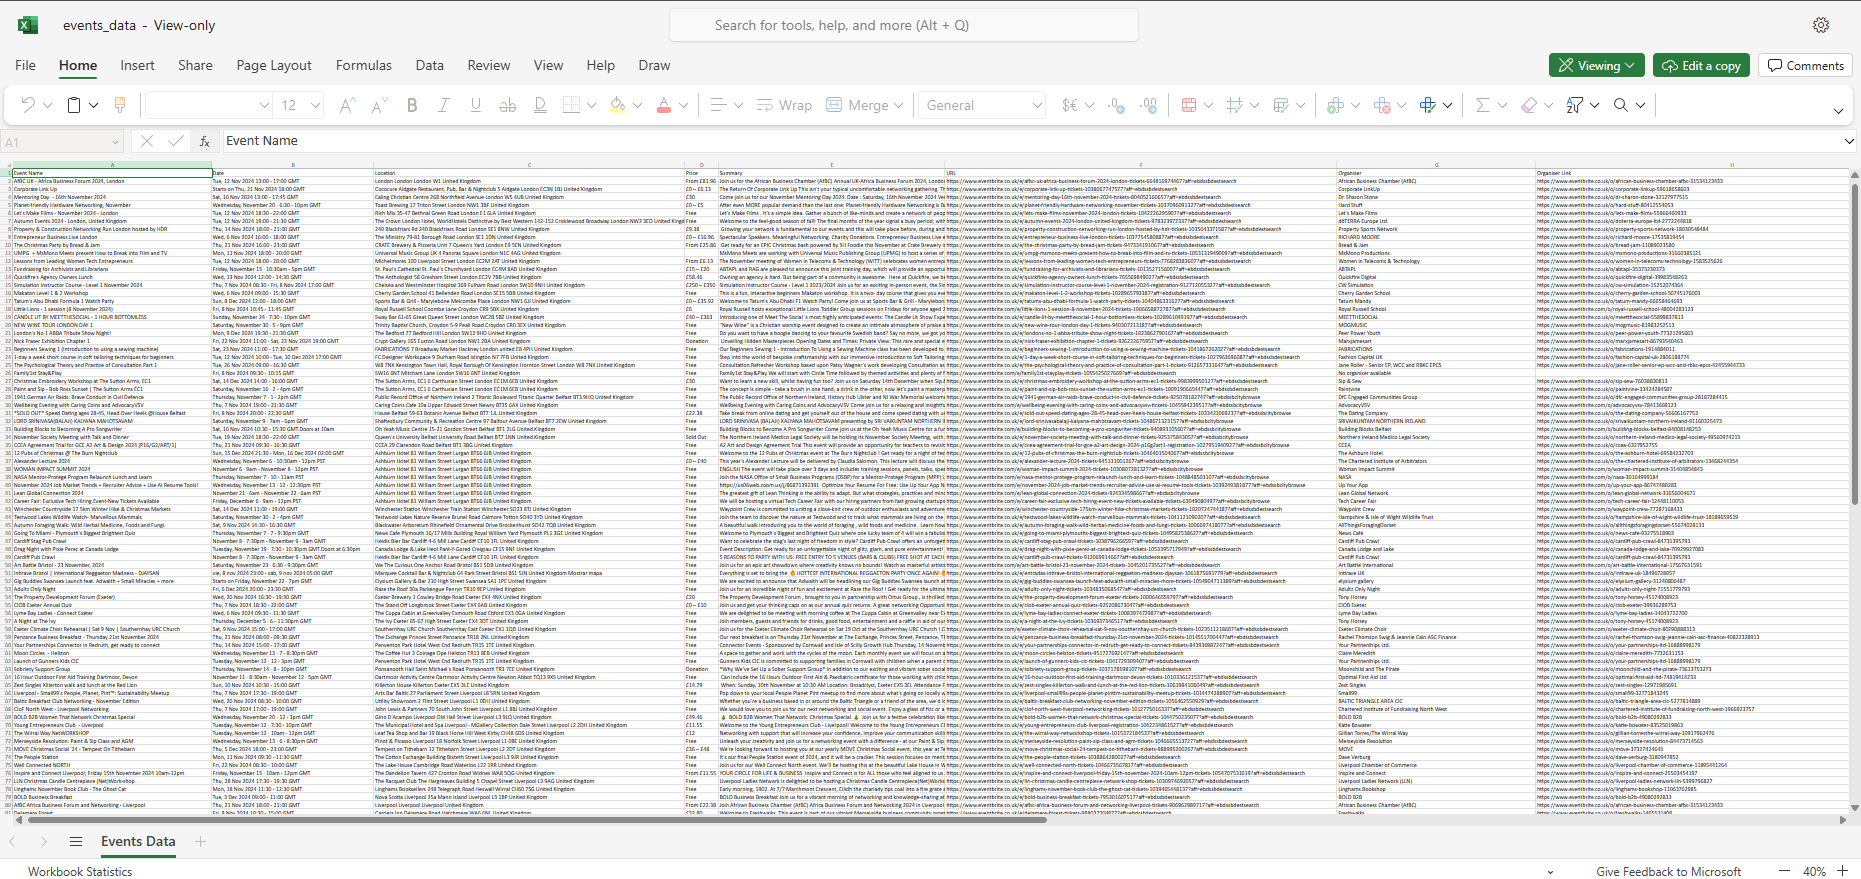
- Data Export: Export data to CSV or Excel and generate visualizations to then view/download with a google cloud link.
- Inbuilt Storage: Store event data in MongoDB and visualizations in Google Cloud Storage.
- Add support for additional event websites.
- Implement a graphical user interface (GUI) for easier interaction.
- Enhance data analysis capabilities with more sophisticated algorithms.
- Include sorting/comapring by organizers
- Utilize the event tags more than counting most common, e.g filter/compare by tags
Thorough manual testing was conducted to ensure the reliability and accuracy of the data scraping, storage, menu's and analysis processes.
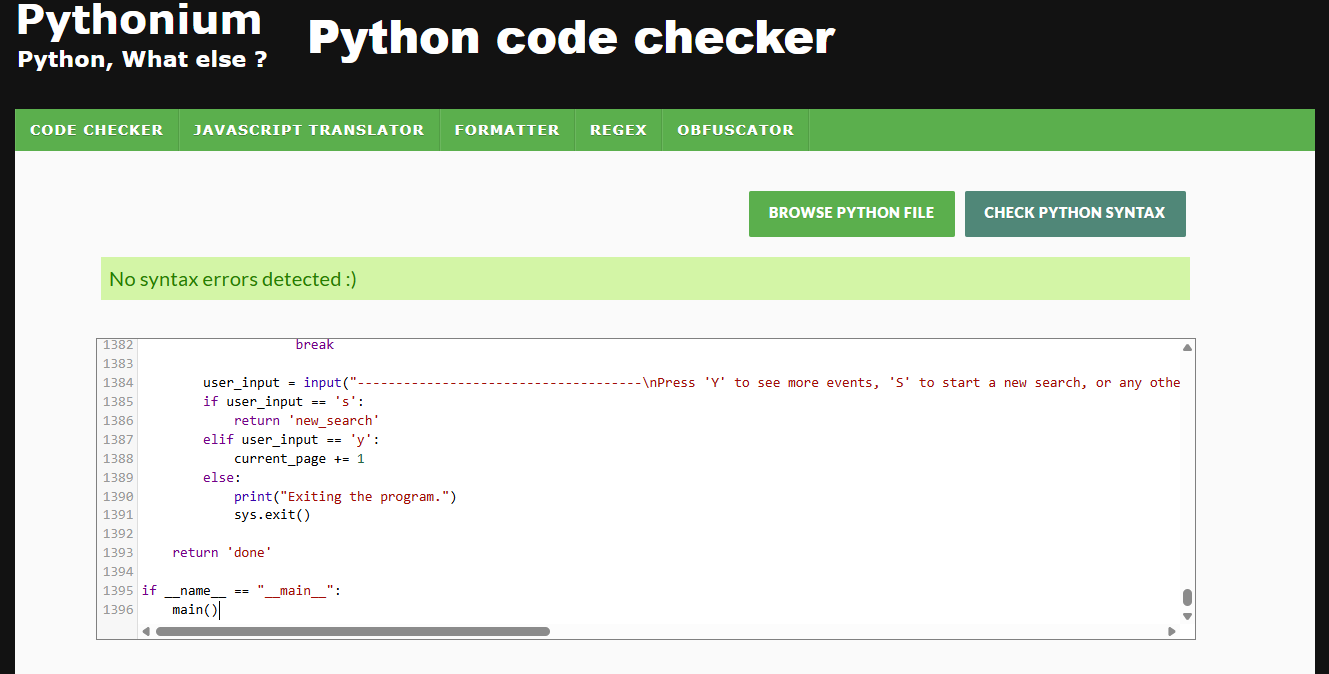
The python in this program was validated on the 7/11/2024 with pythonium.net/linter -
| Test | Outcome |
|---|---|
| Scraping events | Pass |
| Scraping top events | Pass |
| Scraping top categories | Pass |
| MongoDB storage | Pass |
| GCS | Pass |
| Event sorting | Pass |
| Event comparing | Pass |
| Export to CSV | Pass |
| Export to Excel | Pass |
| Generate data visualizations | Pass |
| Test | Outcome |
|---|---|
| Interface user error handling | Pass |
| Interface display | Pass |
| Test | Result |
|---|---|
| Interface navigated easily after one use | 100% |
| Was able to perform data tasks on her scraped events | 100% |
| Was able to recognise where links for user generated CSV/Excel and visualizations are provided | 100% |
- I had a few issues with scraping and parsing dates from events, turning a date that looks like 'Thursday, November 7 - 12:30 - 2:30pm GMT' into something more workable like '2024-11-7 12:30:00' takes alot of word replacements to turn a user friendly date into something less friendley for the user, but better to understand for a computer using the inbuilt datetime library. You have to keep in mind about user mistakes, I have had to include error handling for dates having 2 stated months instead on one, and dates that dont exist (e.g. Nov 31). I also removed all days from the date string as these are not needed and replaced all months with their short abbrievations (January, Febuary => Jan, Feb), also filter out all special characters (-, +1, GMT, PM, AM ). Also for cases where date ranges are entered by the user, I only take the first date in this case.
- I had an issue with the string 'Show map' appearing after all of the events locations, probably due to how Eventbrite shows its users map locations. This looked unproffessional to keep there and quickly found out that using .replace() wouldent work as this string is preceeded the date, example 'United KingdomShow map', after being stuck on this for a while i asked Co-Pilot for a solution and it suggested to use the 're' library (regular expressions). 'r'Show map$' is a regular expression pattern where 'Show map' is the literal string to match and '$' asserts the position at the end of the string, making sure that 'Show map' is only removed if it appears at the end of 'event_location'
- Using the Scraped event price for data analysis was a challenge as I needed to extract the price from other strings and currency symbols and the re library uses alot of different special characters and symbols to achieve your desired affect. I asked Co-Pilot for advice on this and it suggested I should use 'r'\d+(.\d+)?' as my 're.search()' argument, this seemed like an almost random set of characters but what is means is to match one or more digits followed by an optional decimal point and one or more digits, this essentially finds the first occurrence of a number in the event_price string. If a number is found, it is converted to a float and returned, if no number is found, 0.0 is returned.
- Python: The main programming language used for developing the application.
- MongoDB: For storing event data.
- Google Cloud Storage: For saving user-created CSV/Excel files and visualizations.
- matplotlib: For generating visualizations.
- BeautifulSoup: For web scraping.
- Geopy: For distance between user and events calculations
My project was deployed to heroku, being sure to include the correct dependencies such as having:
- requirements.txt
- To declare all the programs libraries and modules
- Procfile
- To specify how heroku should start the application
- Whitenoise
- For loading static files
- Gunicorn -A Python WSGI HTTP Server for UNIX, used to serve the Django application in production.
- Config Vars
- Where sensitive information critical for this project should be kept
After confirming these, I connected my GitHub to the Deploy section on the heroku dashboard and deployed the main branch of my projects repository.
Deployment link - https://project3-event-hoarder-2d3f0c0cde4a.herokuapp.com/
To clone this repository, use the following command:
git clone https://github.com/yourusername/Event-Hoarder.git
To fork this repository, follow these steps:
Navigate to the repository on GitHub.
Click the "Fork" button at the top right of the page.
Select your GitHub account to fork the repository to.
This project was created by me, Max Wiseman
Any media used in this project is either created by the author or used under fair use for educational purposes.
Thanks to the developers of the libraries and frameworks used in this project.
Special thanks to Eventbrite for allowing scraping.
Deployment hosted by Heroku - https://project3-event-hoarder-2d3f0c0cde4a.herokuapp.com/
This project is a labor of love, 1455 lines and a testament to the power of data, all screenshots in this README are from before linting for better readability. After linting the project is now 2097 lines long. I hope this brings value to its few users and inspires further exploration in the world of event data analysis.
This project idea was changed, originally I did a fitness tracking app, which had good functionality user wise, but not so much good as a portfolio peice that a assessor has to look at, in respect where my app took a whole week to see any results due to human growth being quite slow. This again is good for the user to get there results after 7 days have elapsed, but not for a assessor, this is the reason I changed.

