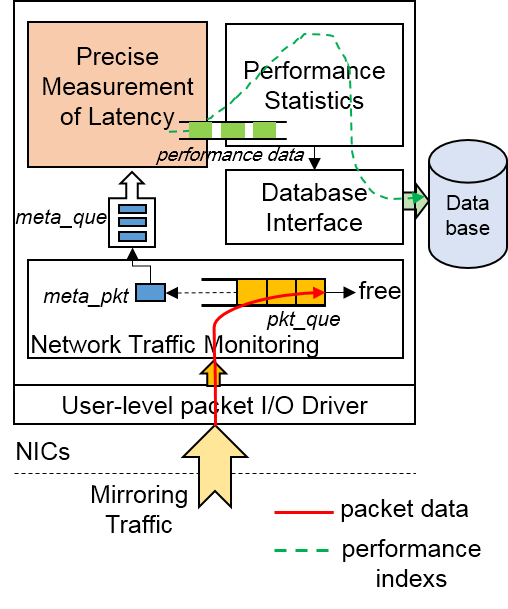
HCMonitor is a monitor system for high concurrent network services, which is developed on user-level and estimates response latency from requests input to responses output, called server-side latency. The measurement is transparent for network services by switch mirroring traffic, and finally displays the real-time results including latency CDF distribution, average delay, concurrency and throughput.
V 1.0
- Fully monitoring
- Accurate measurement of per-request latency
- Transparent for network services
- DPDK-based
- libdpdk (Intel's DPDK package*, DPDK-19.08 best)
- libnuma
- libconfig
- mysql
- mysqlclient
- python2.7
./
|__HCMonitor/ HCMonitor src files $ wget https://fast.dpdk.org/rel/dpdk-19.08.2.tar.xz
$ tar -xvf dpdk-19.08.2.tar.xz
$ cd dpdk-19.08.2/usertools/
$ ./dpdk-setup.sh
- Press [39] x86_64-native-linux-gcc to compile the package
- Press [43] Insert IGB UIO module to install the driver
- Press [47] Setup hugepage mappings for NUMA systems to setup hugepages
- Press [49] Bind Ethernet/Baseband/Crypto device to IGB UIO module
- Press [60] Exit Script to quit the tool
We use dpdk/ submodule as our DPDK driver. FYI, you can pass a different dpdk source directory as command line argument.Introduction to Compatible NIC Only those devices will work with DPDK drivers that are listed on this page: http://dpdk.org/doc/nics. Please make sure that your NIC is compatible before moving on to the next step.
$ cd <path to HCMonitor>
$ vim Makefile
  # Add two configurations at the beginning as below
  RTE_SDK= <path to dpdk>
  RTE_TARGET=x86_64-native-linuxapp-gcc
$ make
The executable application monitor will be generated under build/
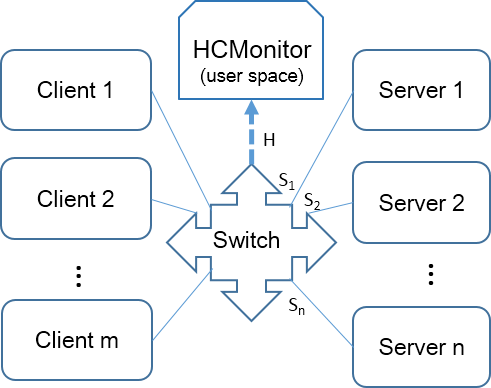
configure the switch port (H) connected to HCMonitor to mirror the inbound and outbound traffic from port S1 to Sn, which represents the ports connected to servers.
Configure the file setting.cfg according to own needs, for example:
$ vim setting.cfg
	enableHTTP = 1      //Test the normal HTTP traffic
	label_offset   = 6    // label location offset in payload bytes(count from 0)
	request_label  = [0,2]  //request label for judging if a packet is a request
	response_label = [1,3]  //response label for judging if a packet is a response
For start parameter description, please execute
$ build/monitor -h Start Examples(12 cores, 1 NIC port)
$ ./build/monitor -c fff -n3 -- -p1Introduction to Results Output Open cdf.txt to check the latency CDF distribution, average delay and concurrency periodicity.
- How can I quit the application? Use ^C to gracefully shutdown the application. Or you can kill process with “pkill” command in Linux.
- Extend to multi-queue receiving packets.
- Support more protocols and performance metrics.
- carry out more detailed service detection such as packet loss and abnormal disconnection.
[1] Hui Song, Wenli Zhang, Ke Liu, Yifan Shen and Mingyu Chen,"HCMonitor: An Accurate Measurement System for High Concurrent Network Services." 2019 IEEE International Conference on Networking, Architecture and Storage (NAS), EnShi, China, 2019, pp. 1-8.

