Term: Fall 2019
-
Team #10
-
Shiny Link : https://grac4ie.shinyapps.io/NYCshooting/
-
Team Members:
- Kanyan Chen
- Weijia Bao
- Chang Xu
- Tiantian Chu
- Qingyu Zhang (Presenter)
-
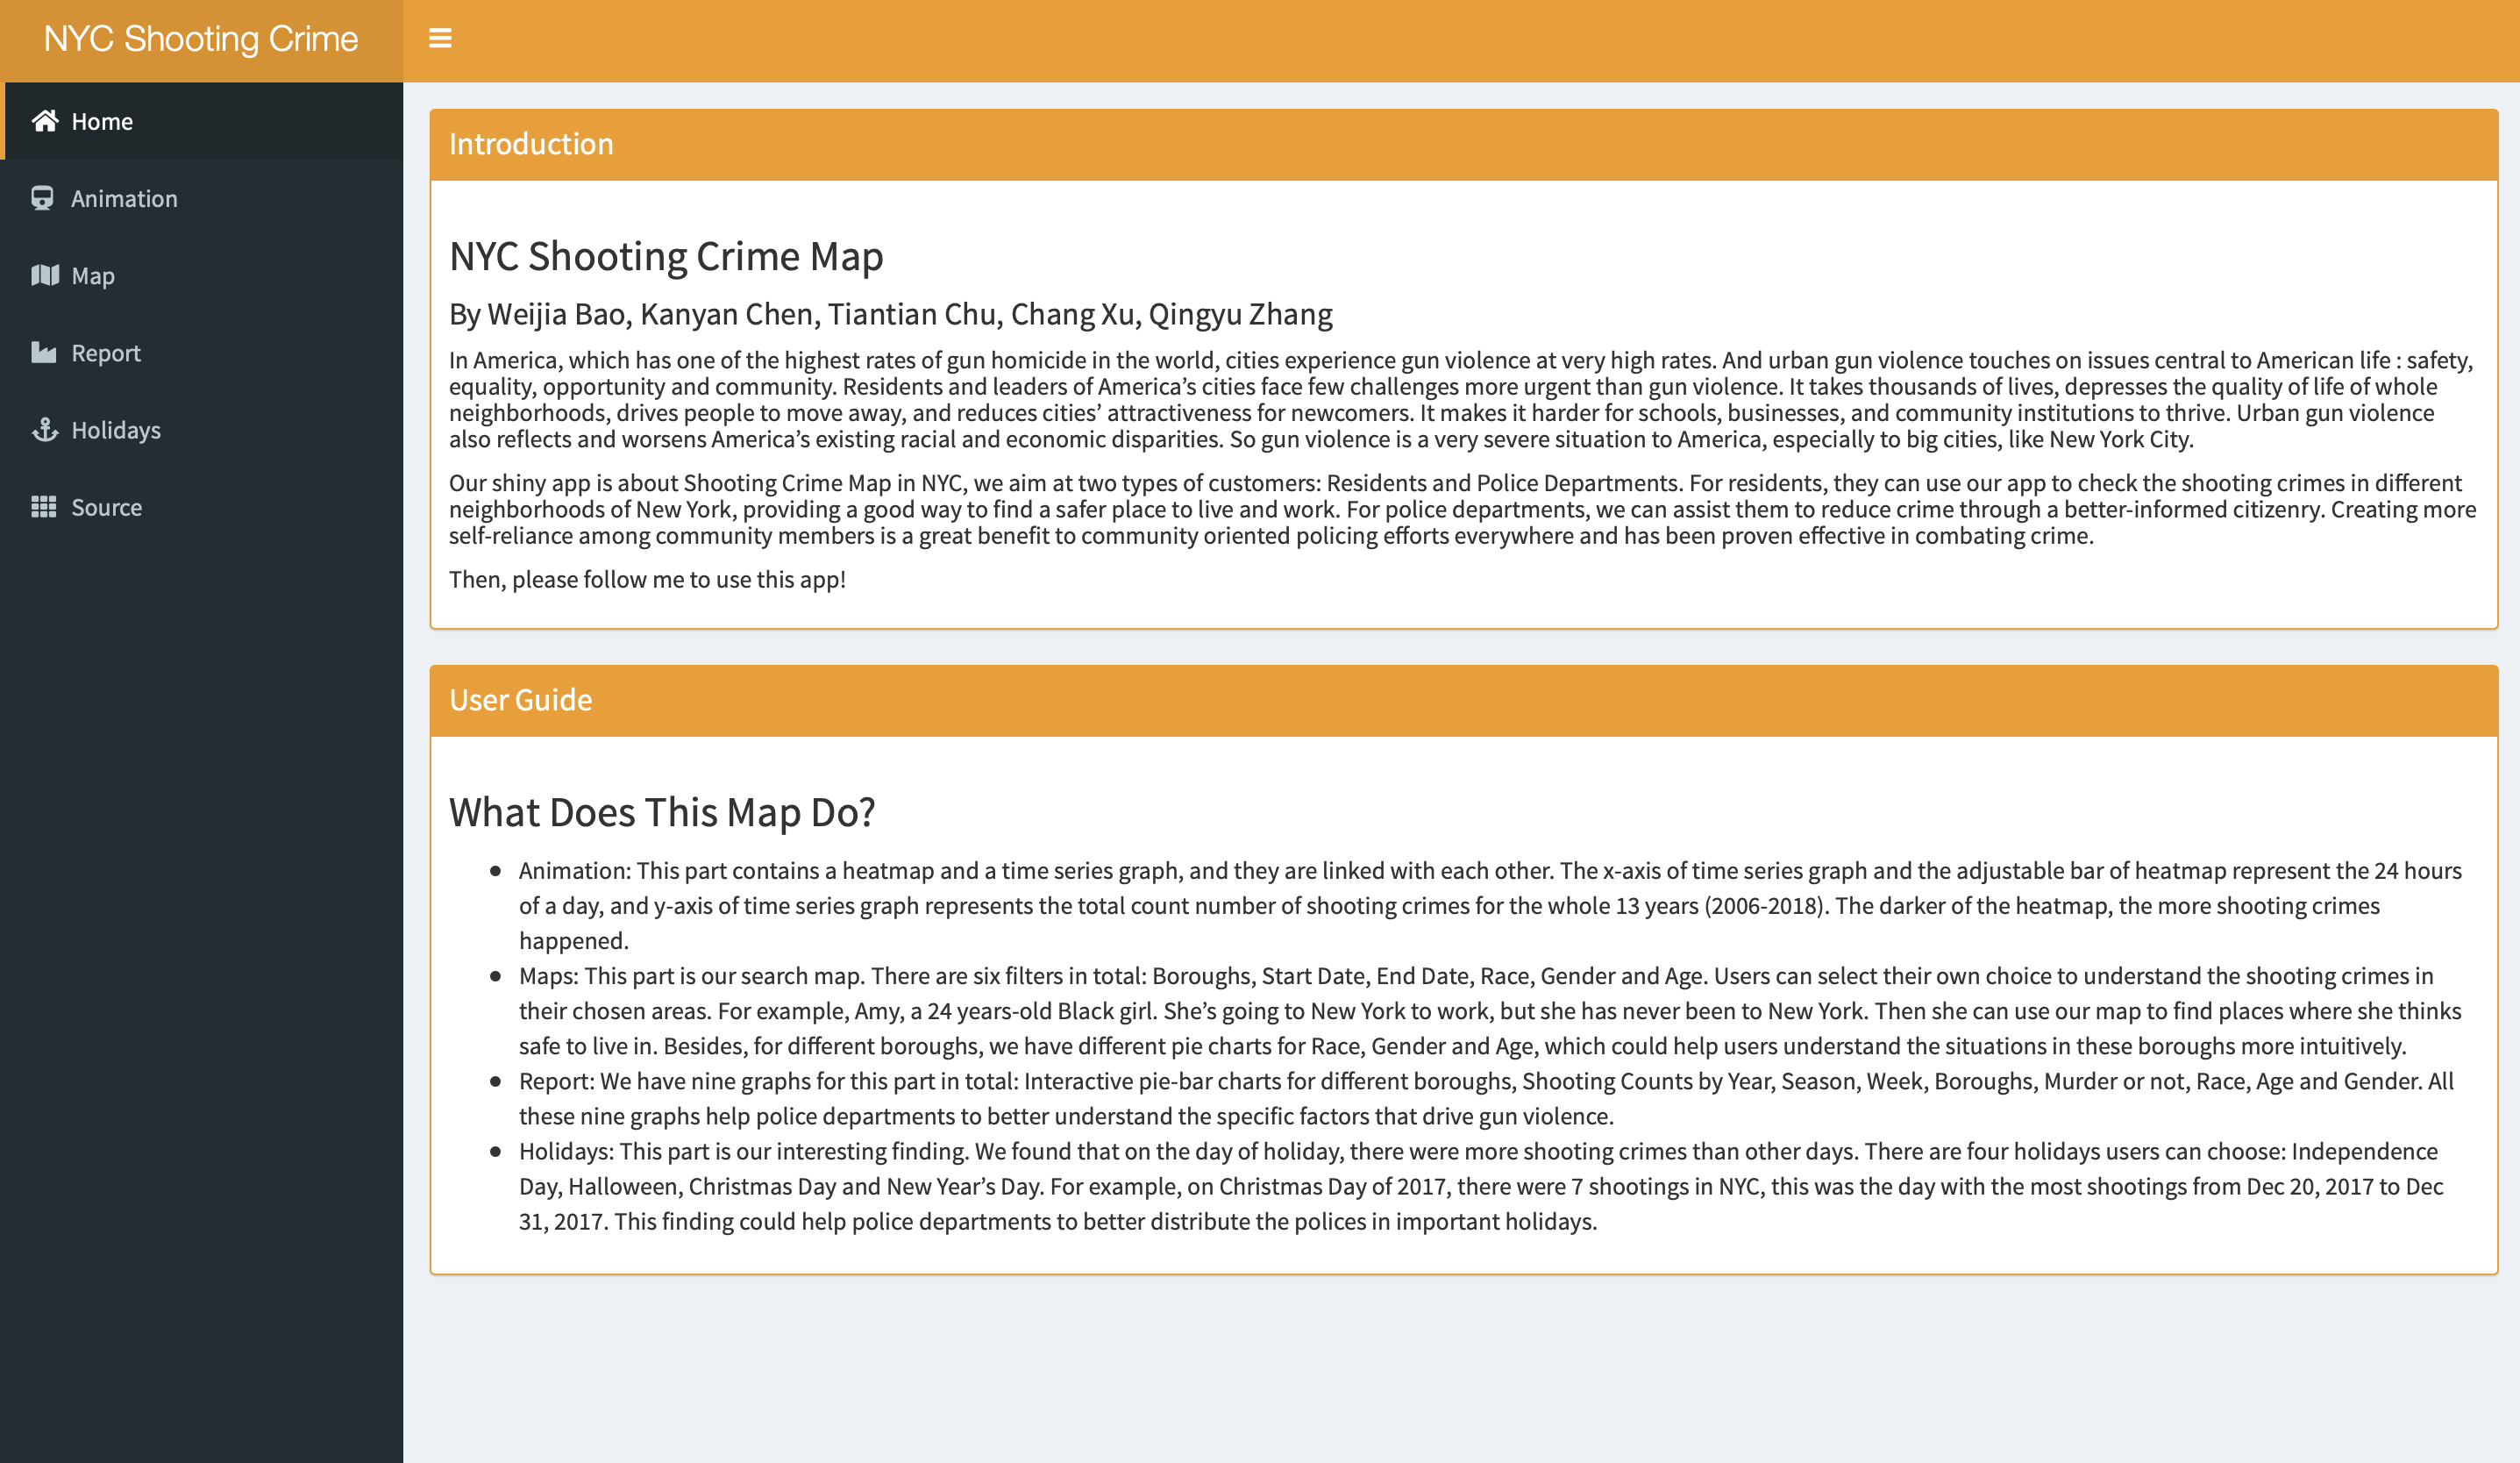
Project summary: In America, which has one of the highest rates of gun homicide in the world, cities experience gun violence at very high rates. And urban gun violence touches on issues central to American life : safety, equality, opportunity and community. Residents and leaders of America’s cities face few challenges more urgent than gun violence. It takes thousands of lives, depresses the quality of life of whole neighborhoods, drives people to move away, and reduces cities’ attractiveness for newcomers. It makes it harder for schools, businesses, and community institutions to thrive. Urban gun violence also reflects and worsens America’s existing racial and economic disparities. So gun violence is a very severe situation to America, especially to big cities, like New York City.
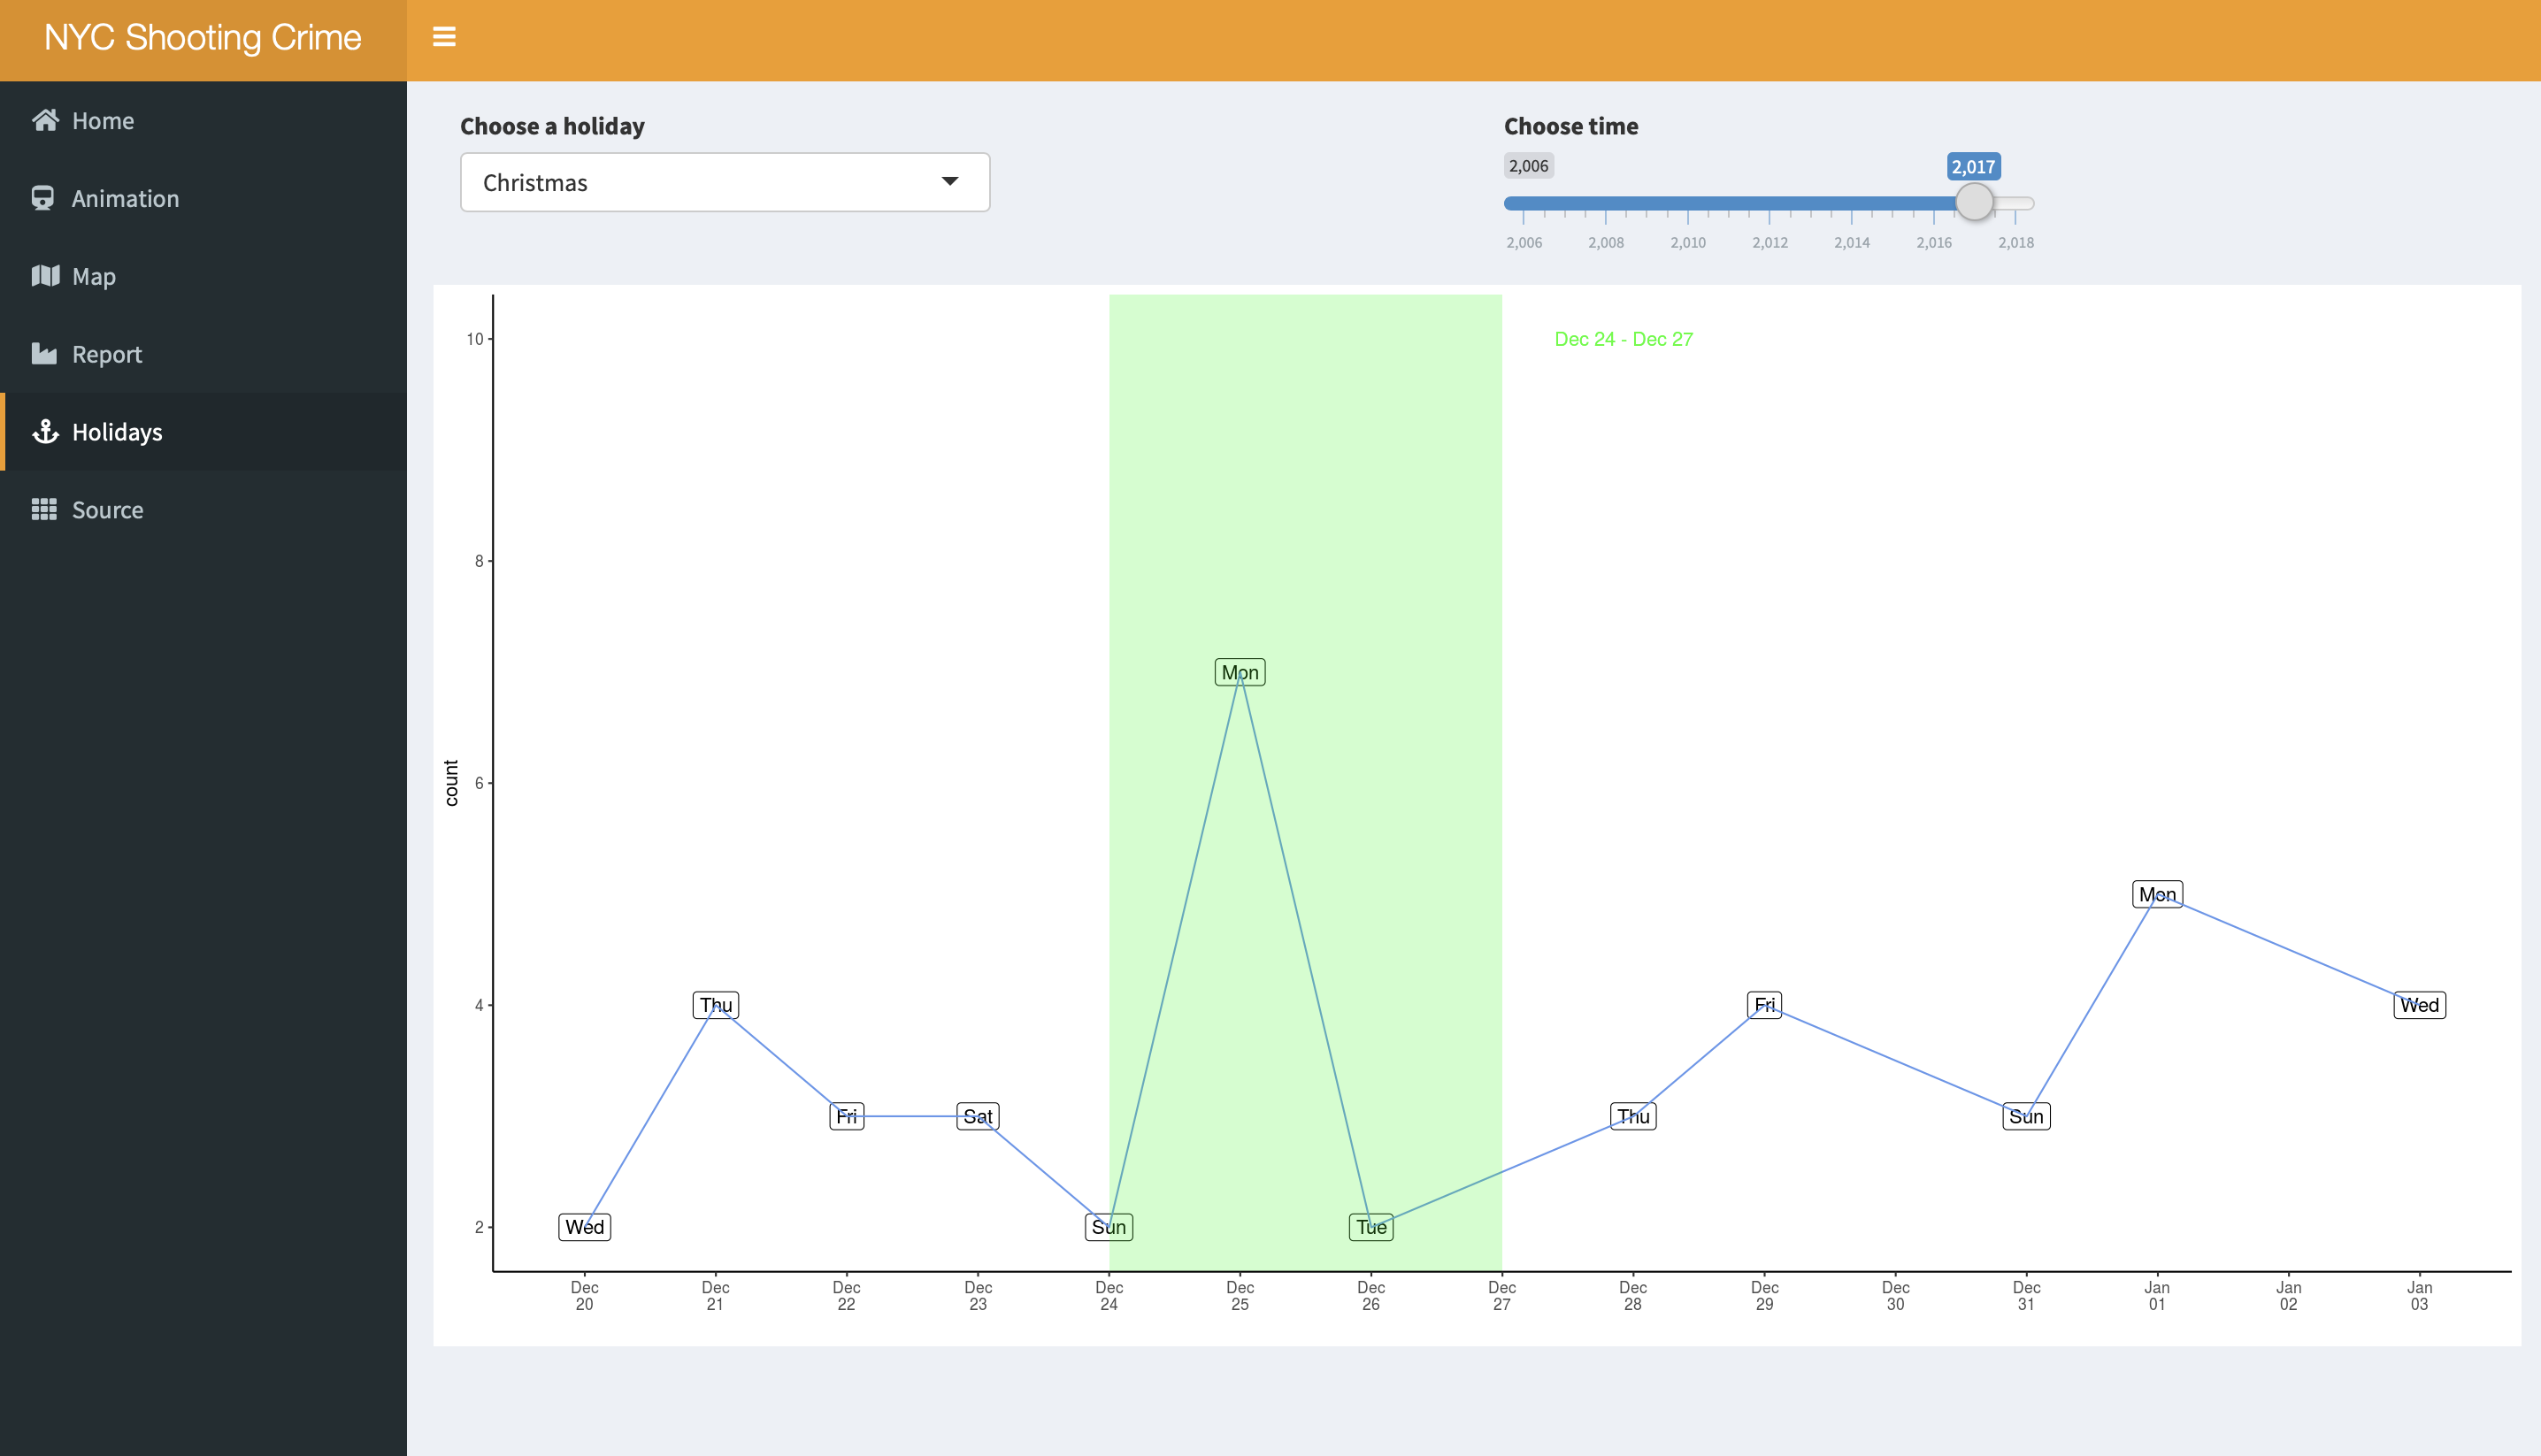
Our shiny app is about Shooting Crime Map in NYC, we aim at two types of customers: Residents and Police Departments. For residents, they can use our app to check the shooting crimes in different neighborhoods of New York, providing a good way to find a safer place to live and work. For police departments, we can assist them to reduce crime through a better-informed citizenry. Creating more self-reliance among community members is a great benefit to community oriented policing efforts everywhere and has been proven effective in combating crime.
-
Data Source:
We used data from NYC Open Data.
- Contribution statement:
All team members contributed equally in all stages of this project.
Kanyan Chen carried out data pre-processing, animation part for heatmap and time series graph. Kanyan also debugged for our whole coding part.
Tiantian Chu ploted the six pie chars for different boroughs and dates.
Weijia Bao completed all the nine graphs (d3 interactive graph, plotly graphs and so on) for our report part.
Chang Xu completed all the shiny app part. Kanyan and Weijia assissted Chang to complete it.
Qingyu Zhang managed the project, contributed to the GitHub respository and prepared the presentation.
All team members approve our work presented in our GitHub repository including this contribution statement.
Following suggestions by RICH FITZJOHN (@richfitz). This folder is orgarnized as follows.
proj/
├── app/
├── lib/
├── data/
├── doc/
└── output/
Please see each subfolder for a README file.


