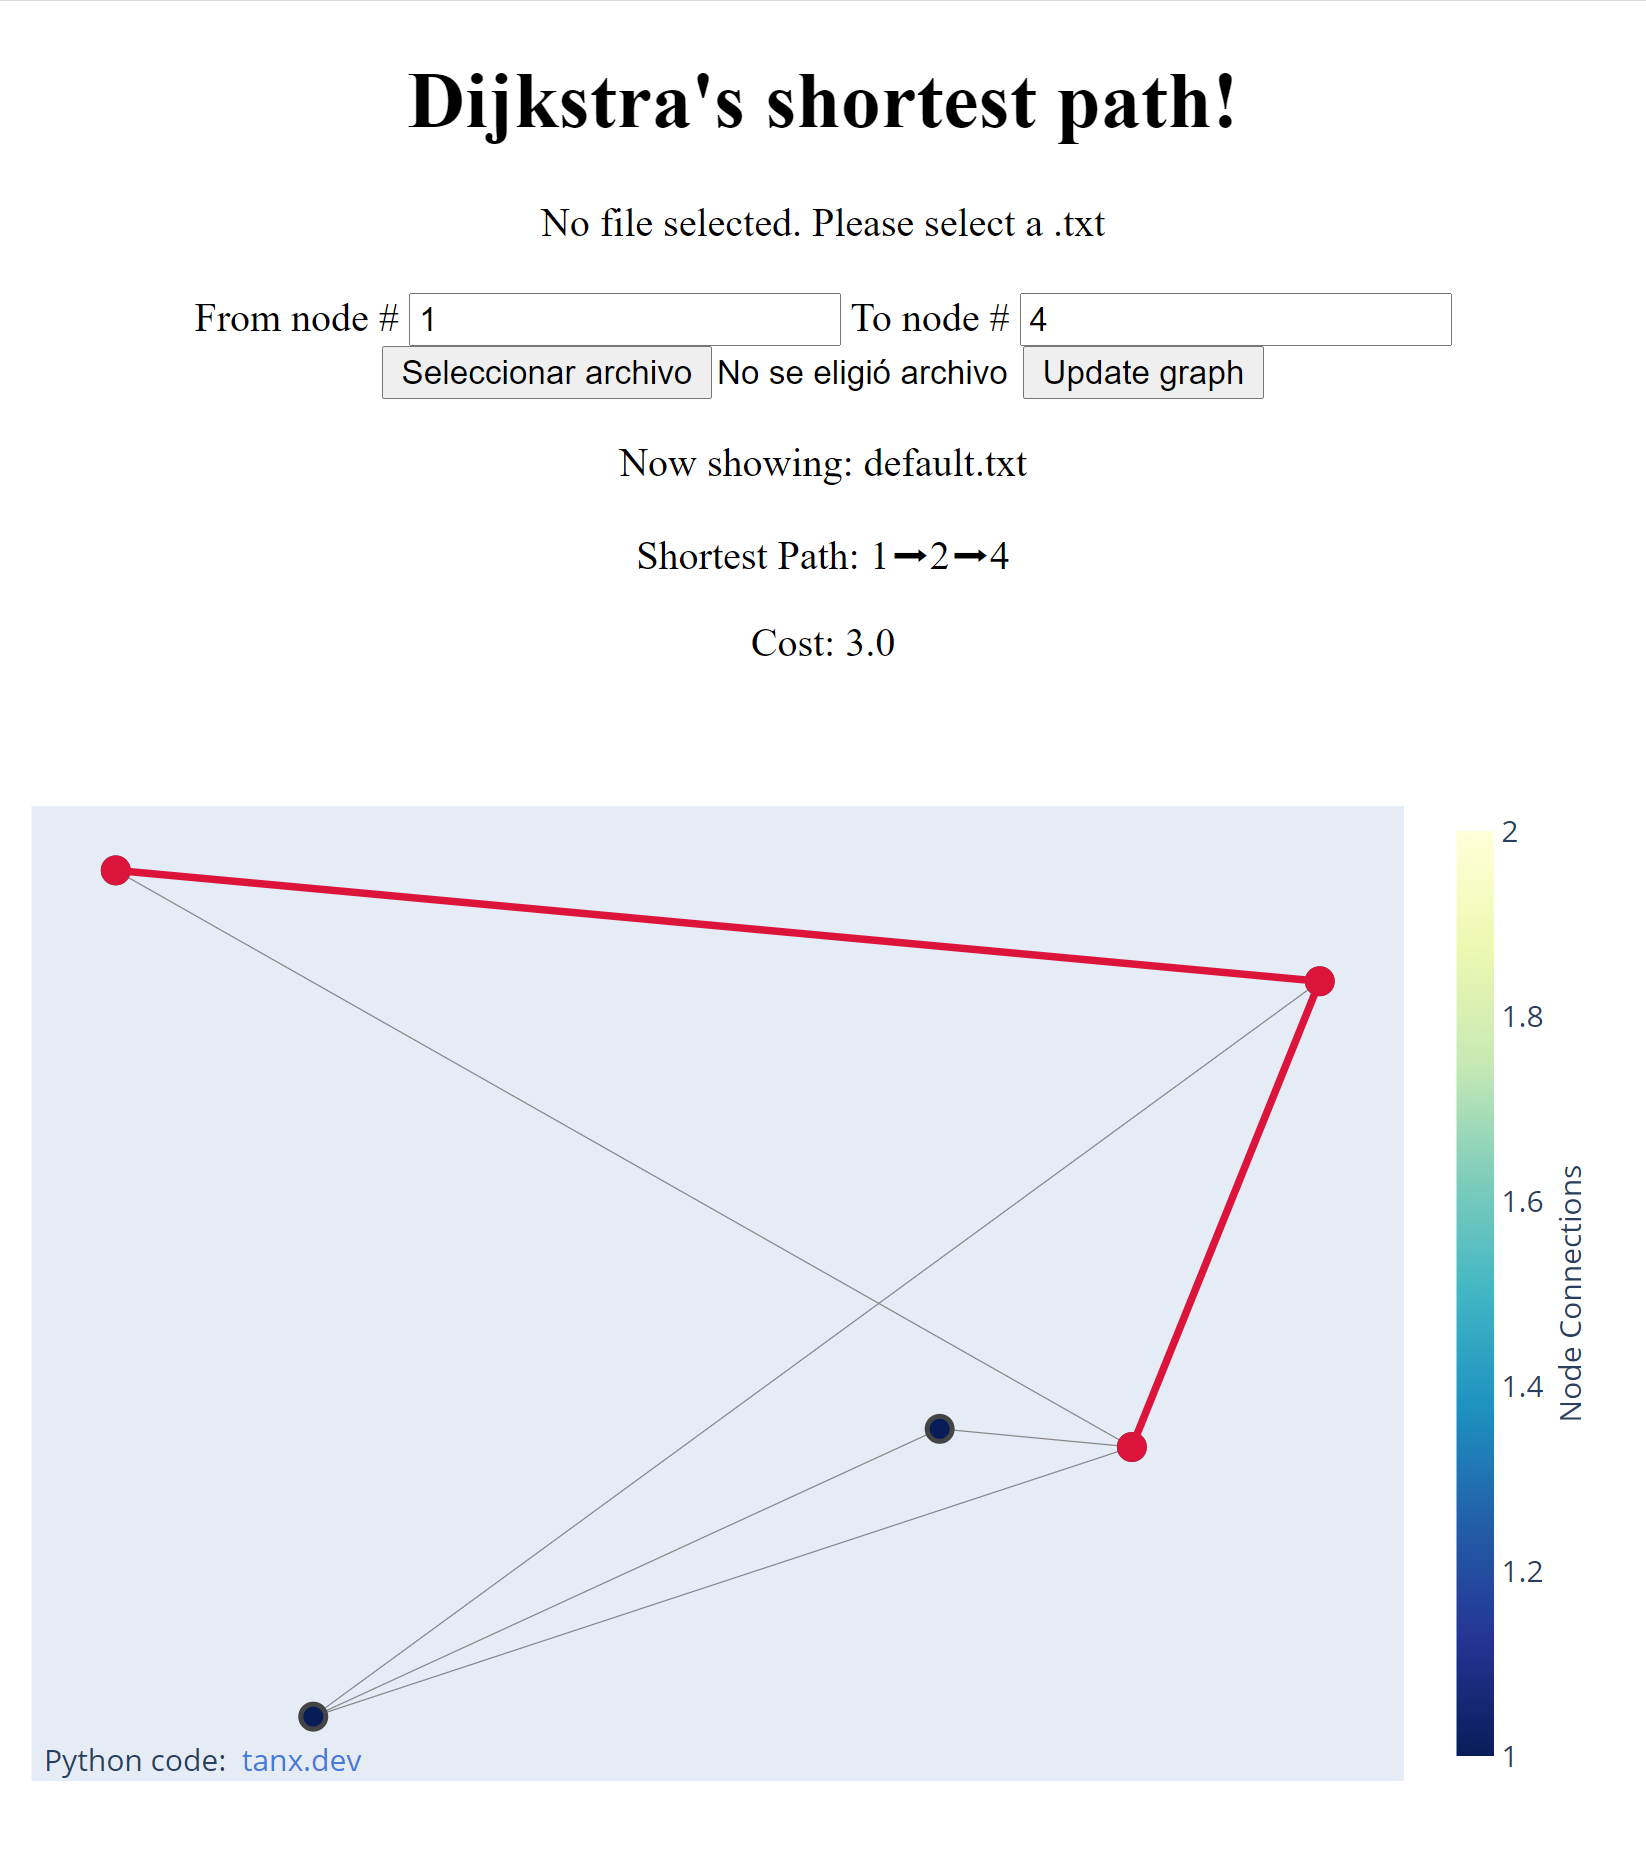
Simple (really simple) web application that plots the shortest path obtained from the Dijkstra's algorithm.
-
Fork and clone the Dijkstra's shortest path repo
git clone https://github.com/TanZng/dijkstras-shortest-path.git -
Create your virtualenv on the proyect root
virtualenv flask_env -
Activate virtualenv
# Windows
cd flask_env/Scripts
activate
# MacOS, Ubuntu, Debian
cd flask_env/bin
source activate
To leave virtualenv we use
deactivate
-
Run Flask App
cd flaskr/ python app.py -
Open the direction http://127.0.0.1:5000/ on your browser! 🥳
WIP (Work in Progress)
Git
Python 3
I'm using 3.8.3rc1, but i think > 3.4 its okay
pip
To download other dependencies. I'm using pip 20.1.1
python -m pip install --upgrade pip
Pandas
I'm using 1.0.5
pip install pandas
Flask
I'm at 1.1.2
pip install Flask
NetworkX
pip install networkx
Plotly
pip install plotly==4.9.0
virtualenv
pip install virtualenv
- Load and Read graphs on txt files.
- Render different graphs from a file.
- Set a default example.
- Form to choose u (star) and v (end).
- Create a simple README.md
- Render shortest path - edge trace - with a diferent color.
- Upload Dijkstra's shortest path algorithm.
- Upload the web app.
- Add "How to use" on the README.
- Add simple CONTRIBUTING.md
- Make it responsive.
- Add CSS Style.
- Write a Post about this.
Feel free to contribute. I am open to suggestion. Feel free to create an issue or open a PR
WIP (Work in Progress)
Please read CONTRIBUTING.md for details of our code of conduct, and the process to send us pull requests.
Tania R. Zuñiga - Initial Work - TanZng
Becris Icon designer
- MIT license
- Copyright 2020 © Tania R Zuniga.


