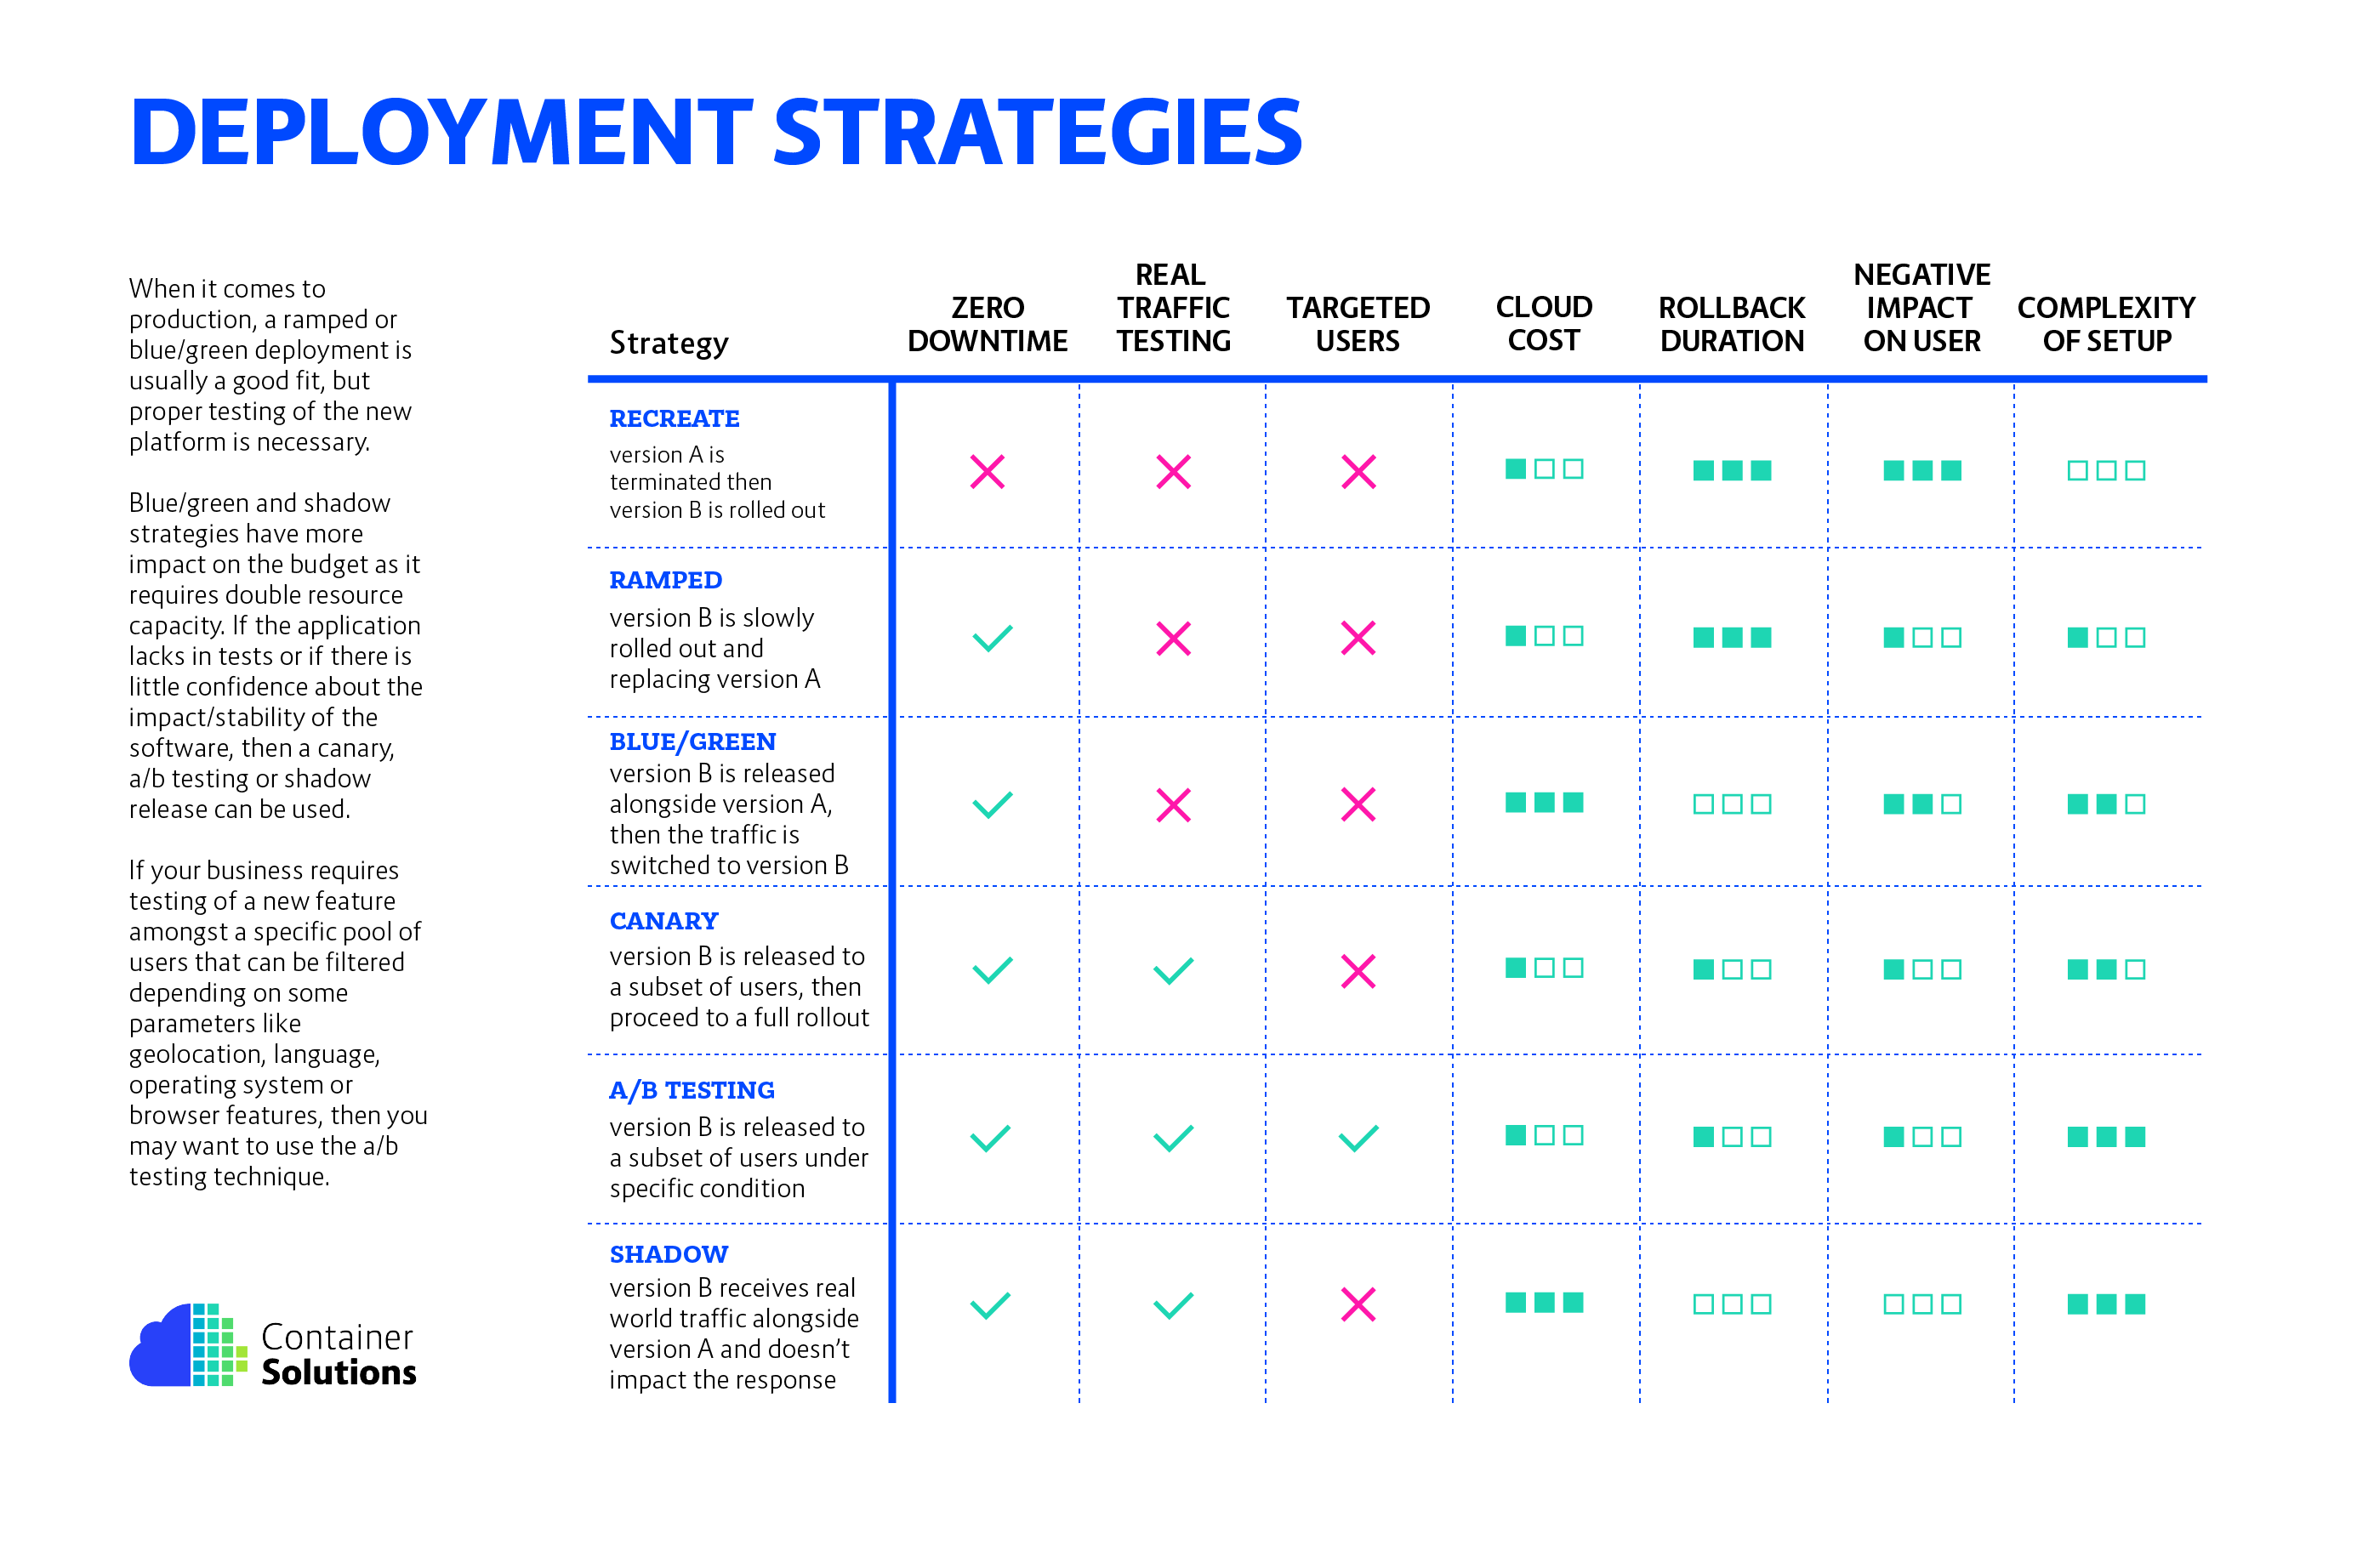
In Kubernetes there are a few different ways to release an application, you have to carefully choose the right strategy to make your infrastructure resilient.
- recreate: terminate the old version and release the new one
- ramped: release a new version on a rolling update fashion, one after the other
- blue/green: release a new version alongside the old version then switch traffic
- canary: release a new version to a subset of users, then proceed to a full rollout
- a/b testing: release a new version to a subset of users in a precise way (HTTP headers, cookie, weight, etc.). This doesn’t come out of the box with Kubernetes, it imply extra work to setup a smarter loadbalancing system (Istio, Linkerd, Traeffik, custom nginx/haproxy, etc).
- shadow: release a new version alongside the old version. Incoming traffic is mirrored to the new version and doesn't impact the response.
Before experimenting, checkout the following resources:
- CNCF presentation
- CNCF presentation slides
- Kubernetes deployment strategies
- Six Strategies for Application Deployment.
- Canary deployment using Istio and Helm
- Automated rollback of Helm releases based on logs or metrics
These examples were created and tested on Minikube running with Kubernetes v1.25.2 and Rancher Desktop running with Kubernetes 1.23.6.
On MacOS the hypervisor VM does not have external connectivity so docker image pulls
will fail. To resolve this, install another driver such as
VirtualBox and add --vm-driver virtualbox
to the command to be able to pull images.
$ minikube start --kubernetes-version v1.25.2 --memory 8192 --cpus 2
The following steps describe how to setup Prometheus and Grafana to visualize the progress and performance of a deployment.
To install Helm3, follow the instructions provided on their website.
$ helm install prometheus prometheus-community/prometheus \
    --create-namespace --namespace=monitoring \
    -f prometheus-override.yaml
$ helm install grafana \
    --namespace=monitoring \
    --set=adminUser=admin \
    --set=adminPassword=admin \
    --set=service.type=NodePort \
    grafana/grafana
Now that Prometheus and Grafana are up and running, you can access Grafana:
$ minikube service grafana -n monitoring
To login, username: admin, password: admin.
Then you need to connect Grafana to Prometheus, to do so, add a DataSource:
Name: prometheus
Type: Prometheus
Url: http://prometheus-server
Access: Server
Create a dashboard with a Time series or import the JSON export - update the UID first of the Prometheus source. Use the following query:
sum(rate(http_requests_total{app="my-app"}[2m])) by (version)
Since we installed Prometheus with default settings, it is using the default scrape
interval of 1m so the range cannot be lower than that.
To have a better overview of the version, add {{version}} in the legend field.
Recreate:
Ramped:
Blue/Green:
Canary:
A/B testing:
Shadow:


