English | 简体中文
VChart is a chart component library within the VisActor visualization system. Univer is an open-source Office suite. Using the univer-vchart-plugin, you can easily create chart overlays.
# npm
$ npm install @visactor/univer-vchart-plugin

# pnpm
$ pnpm add @visactor/univer-vchart-pluginimport {
UniverVChartPlugin,
CREATE_VCHART_COMMAND_ID,
} from "@visactor/univer-vchart-plugin";
export function setupUniver() {
const univer = new Univer({
theme: defaultTheme,
locale: LocaleType.EN_US,
locales: {
[LocaleType.EN_US]: enUS,
},
});
univer.registerPlugin(UniverVChartPlugin);
}
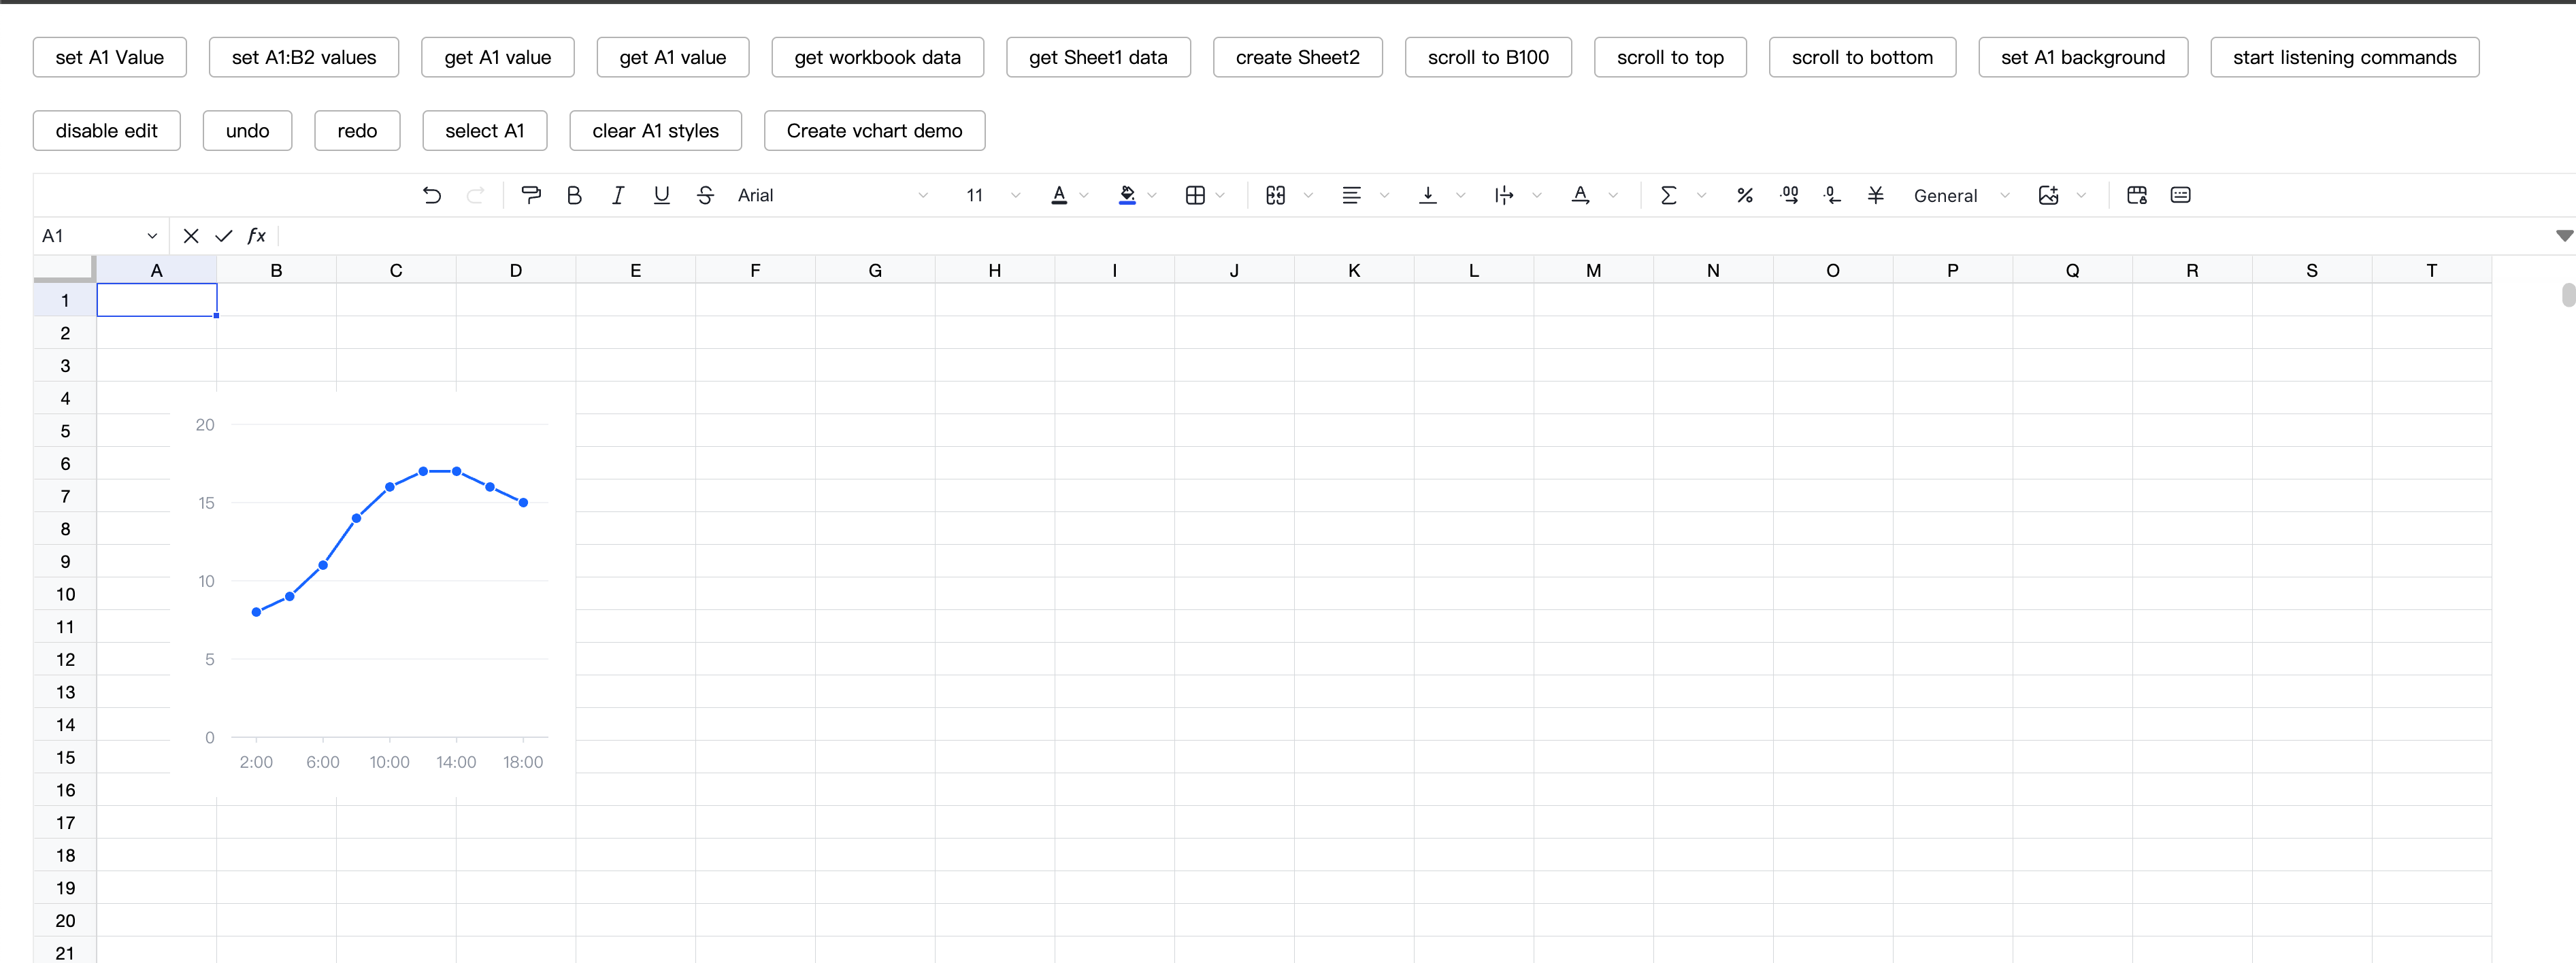
export function setupVChartDemo($toolbar: HTMLElement, univerAPI: FUniver) {
const $button = document.createElement("a");
$button.textContent = "Create vchart demo";
$toolbar.appendChild($button);
$button.addEventListener("click", async () => {
if (!univerAPI) throw new Error("univerAPI is not defined");
const activeWorkbook = univerAPI.getActiveWorkbook();
if (!activeWorkbook) throw new Error("activeWorkbook is not defined");
const activeSheet = activeWorkbook.getActiveSheet();
if (!activeSheet) throw new Error("activeSheet is not defined");
await univerAPI.executeCommand(CREATE_VCHART_COMMAND_ID, {
spec: {
type: "line",
data: {
values: [
{
time: "2:00",
value: 8,
},
{
time: "4:00",
value: 9,
},
{
time: "6:00",
value: 11,
},
{
time: "8:00",
value: 14,
},
{
time: "10:00",
value: 16,
},
{
time: "12:00",
value: 17,
},
{
time: "14:00",
value: 17,
},
{
time: "16:00",
value: 16,
},
{
time: "18:00",
value: 15,
},
],
},
xField: "time",
yField: "value",
},
});
});
}- Homepage
- VCharts Chart Examples
- VChart Chart Tutorial
- VChart Chart Configuration Options
- VChart API
- VGrammar
- VRender
- FAQ
- CodeSandbox Template for submitting bugs
If you would like to contribute, please read the Code of Conduct and the Contribution Guide first.
Small streams make big rivers!


