- Kewen Zhang,
- Pengfei Wang,
- Xiaoci Xing,
- Ziyue Wu,
Click here to read the full report
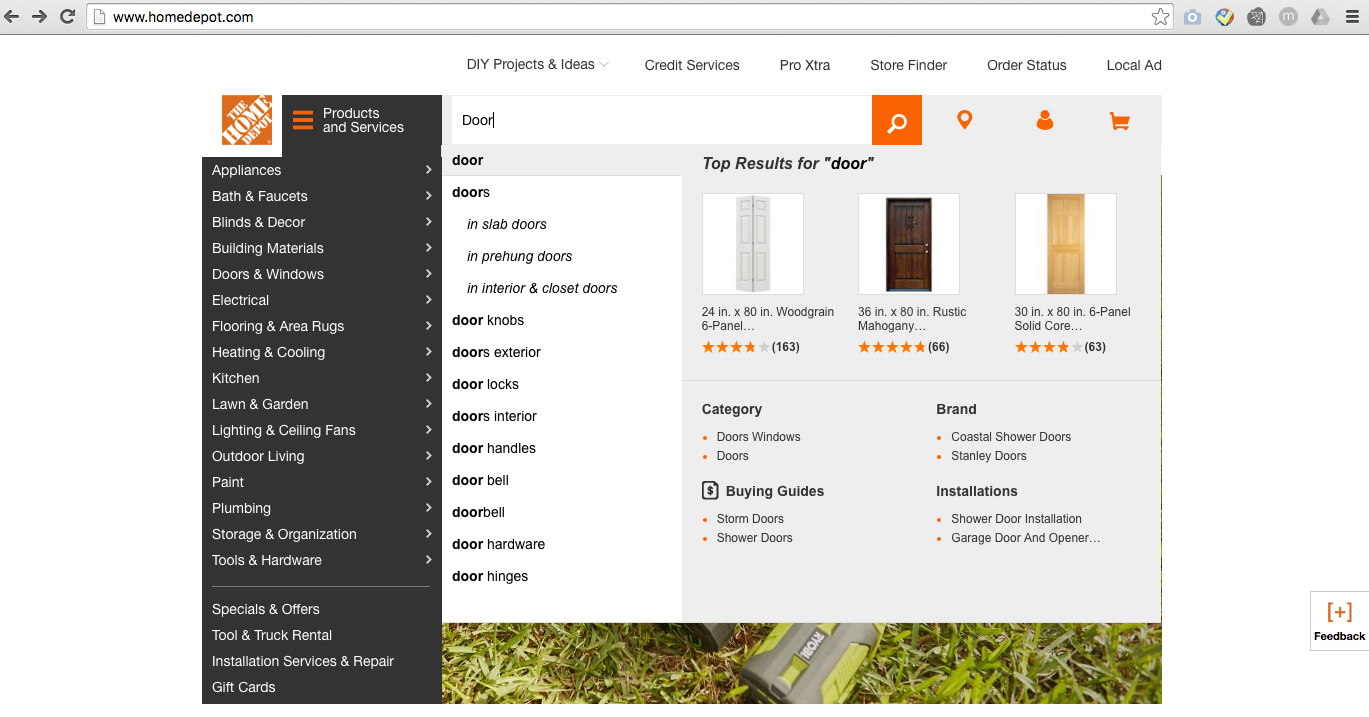
Predict relevance scores of a given search keywords to Home Depot products, according to product description and attributes.
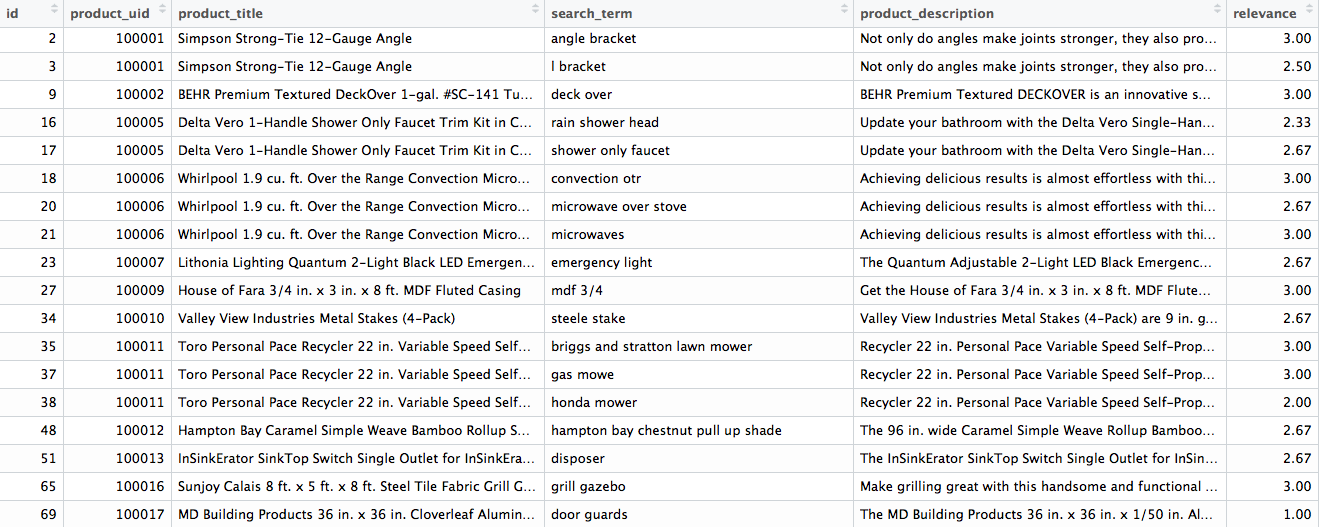
- 74067 observations.
- relevance from 1 less related to 3 highly relevant.
- Fixed typo: “helloWorld” -> "hello World"
- Cleaned stop words: delete words like "the", "and"
- Replace synonymous words
- Cleared insignificant punctuation: "#.,"
- Cleared plurality: "feet" -> foot
- Changed to word sterm
| Before | After |
|---|---|
| BEHR Premium Textured DeckOver 1-gal. #SC-141 Tugboat Wood and Concrete Coating | behr premium textur deck 1-ga sc-141 tugboat wood concret coat |
- relevance distribution.
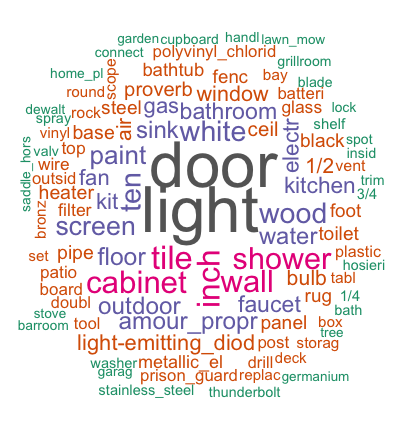
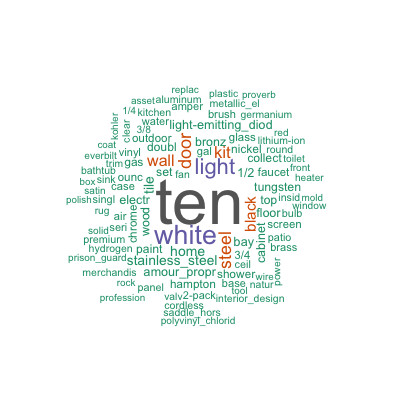
- word clouds:
Search term:
Product title:
Product Description:
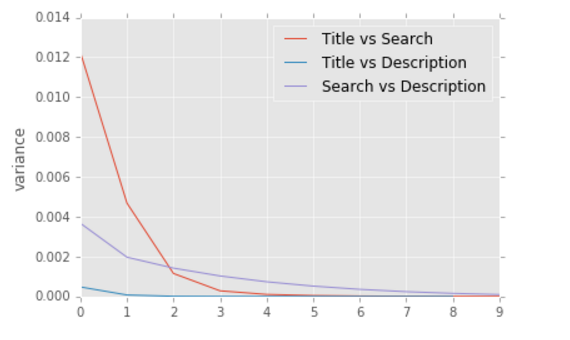
We have used Jaccard coefficient
JaccardCoef(A, B) = |A ∩ B| / |A ∪ B|
to calculate the distance between "Search term", "Product Description" and "Product title" respectively
By comparing the variance of each extracted features from 1 - 10 grams, we have the following analysis:
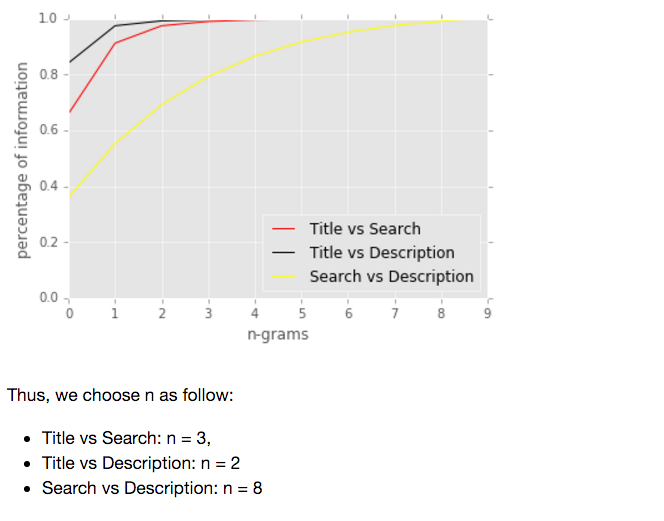
In the case of the term frequency tf(t,d), the simplest choice is to use the raw frequency of a term in a document. The inverse document frequency is a measure of how much information the word provides, that is, whether the term is common or rare across all documents.
For n-grams selection of tf-idf, we have the similar result as Jaccard Coefficient distance:
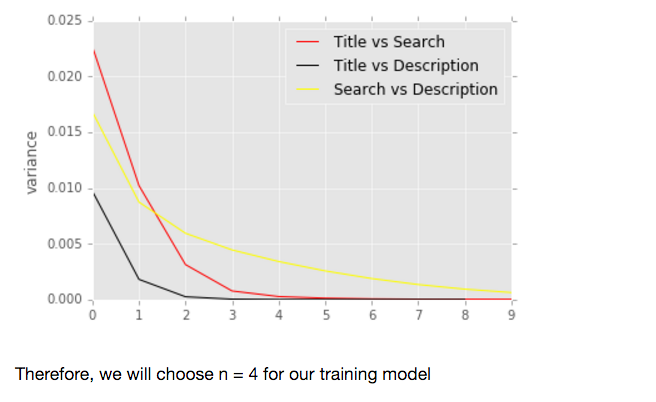

then, we used cosine similarity to obtain the similarity between "Search term", "Product Description" and "Product title" respectively. Cosine Similarity: Cosine similarity is a measure of similarity between two vectors of an inner product space that measures the cosine of the angle between them
As most of items have their attributes in data, we choose the most three common attributes among products, brand, color and material.
It's reasonable to compare between search term and these three product attributes. In this case we used same accard coefficient method. The number of grams here is 1, as many items only have one word in their color and material description.
Combined multiply features together.
-
General Linear Model
- colinearality me
-
Machine Learning Regressor
* Cross Validation -
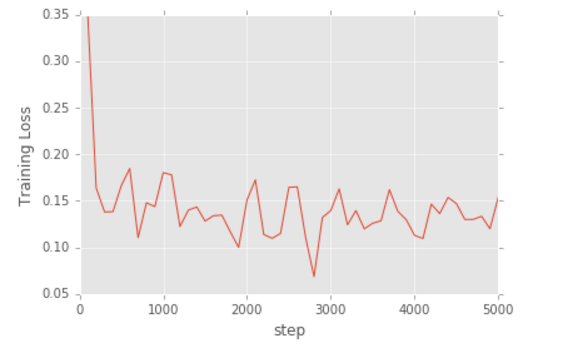
Neural Network
- Layers: 4
- Nodes: 50/layers
- Steps: 5000
We applied 5-folds cross validation for each regressors to generated the following table:
5-fold CV validated-rMSE comparison:
| Feature\Regressor | Linear Regression | Ridge Regression | RF | XGB |
|---|---|---|---|---|
| Customized | 0.5329 | 0.5329 | 0.5322 | 0.5323 |
| Count | 0.5211 | 0.5211 | 0.5143 | 0.5154 |
| Distance | 0.5133 | 0.5132 | 0.5100 | 0.5232 |
| Ti-idf | 0.5006 | 0.5006 | 0.4968 | 0.4983 |
| All | 0.4944 | 0.4929 | 0.4829 | 0.4829 |
- Find better features
- Increased steps of Neural Network Regressor
