This workshop covers the steps required to deploy a lightweight global monitoring stack via StackPath's Edge Compute platform and recently open-sourced API project, Scouter.
- Getting Started
- Workshop Guide
- Part 1: Creating the Performance Metric Collection Workload
- Part 2: Creating the Globally Deployed Scouter API Workload
- Part 3: Installing and Configuring InfluxDB on our VM
- Part 4: Installing and Configuring Telegraf on our VM
- Part 5: Installing and Configuring Grafana on our VM
- Part 6: Exploring our Performance Data!
- Workshop Overview
These instructions cover the deployment of a lightweight monitoring stack via StackPath's Edge Compute platform.
To follow this guide please register and create a StackPath account.
StackPath offers a $100 credit to new signups!
You will also need to register an account with MaxMind to get access to their GeoLite2 databases.
The following section is a brief overview of the core components of this workshop and how they will be used to develop our monitoring stack.
StackPath's Edge Compute platform allows us to quickly and easily deploy all components of our monitoring stack on a global scale.
In this workshop Edge Compute is utilized in two ways:
- A VM workload for the collection, recording and visualization of performance metrics.
- A globally deployed container workload using the Scouter API.
The Scouter API project allows us to perform remote network diagnostics, in this case ICMP ping and traceroute so we can record historical latency and routing data.
Telegraf is our collection agent. It executes a custom script to perform ping tests from all of our Scouter API instances deployed in our Edge Compute workload and write the resulting data to InfluxDB.
InfluxDB is our time series datastore and works very well with Telegraf and Grafana.
Grafana acts as the visualization portion of our monitoring stack. With InfluxDB compatability built-in we can easily jump in to visualize our performance data.
Before proceeding please be sure to review the Getting Started section of this README to ensure that all Prerequisities are met and that you understand the Core Components of this guide.
Let's begin our journey by creating our first Edge Compute workload within the StackPath portal.
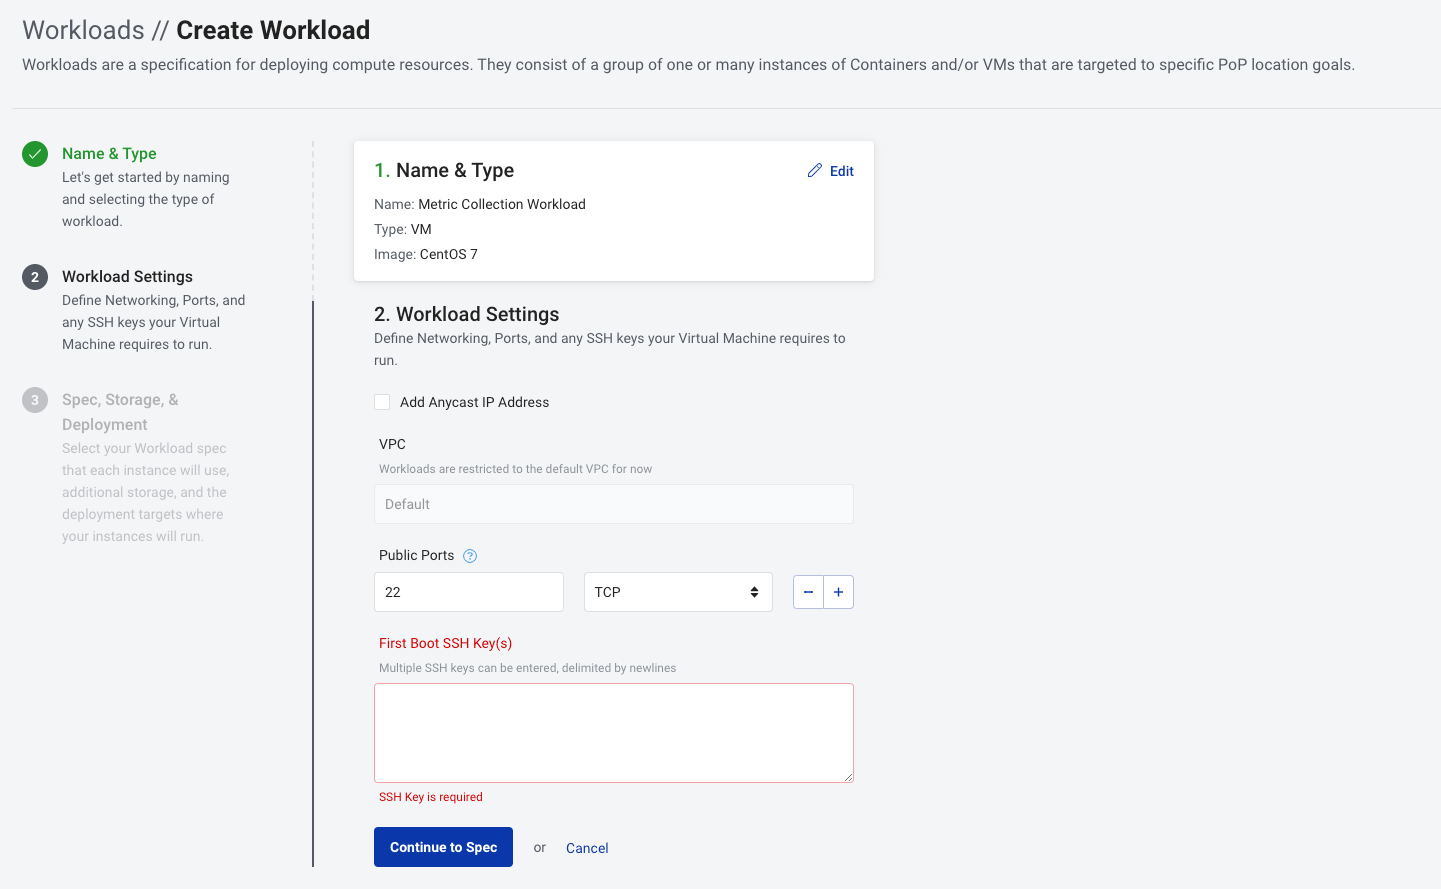
From the Dashboard select Create Workload. Look for the first section named Name & Type. In this section we specify the name of our workload as well as its type.
-
Name:
Metric Collection Workload -
Workload Type:
VM -
Image:
CentOS 7
Click Continue to Settings. From here we'll open port 22/TCP so we can access our VM via SSH. We need to specify a First Boot SSH Key(s). Please copy/paste your ~/.ssh/id_rsa.pub here. If you do not have an SSH key to provide, please run the following commands to generate one:
ssh-keygen -t rsa -N '' -f ~/.ssh/id_rsa
cat ~/.ssh/id_rsa.pub-
Public Ports:
22/TCP -
First Boot SSH Key(s):
<YOUR_ID_RSA_PUB_HERE>
Click Continue to Spec. Here we specify the size, additional volumes, locations and number.
-
Spec:
SP-4 (4 vCPU, 16 GB RAM, 25 GB Root Disk) -
Additional Volume
- Mount Path:
/var/lib/influxdb - Size:
25
- Mount Path:
-
Deployment Target:
- Name:
na - PoPs:
San Jose
- Name:
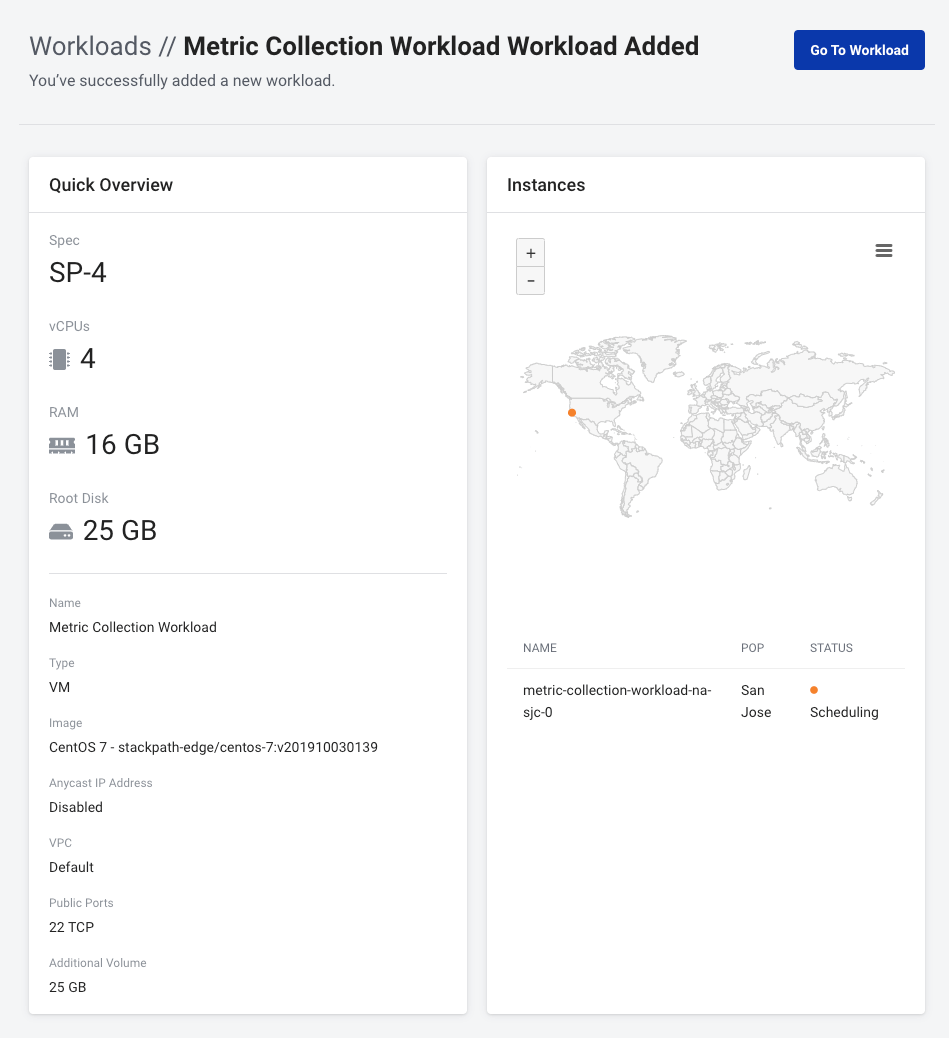
Click Create Workload and you'll be redirected to the following page:
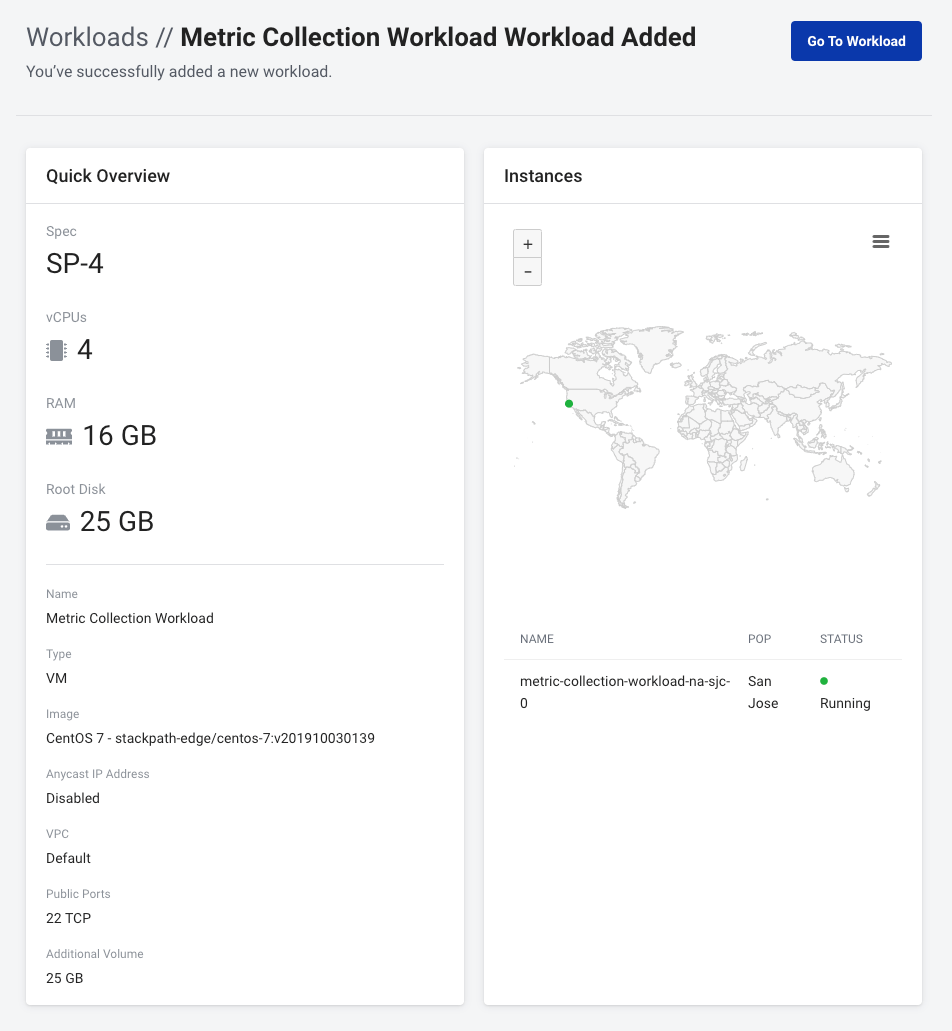
After a short period of time the STATUS of our instance changes to Running.
Please be sure to quickly note your VM's PUBLIC IP ADDRESS for use later on.
Before we create our next workload let's first create an inbound rule to restrict access to Grafana to our local IP address.
From our workload's Overview page we should also see a page called Network Policies. Select it and you'll see the following:
Before we add the new rule be sure to have your public IP ready.
One easy way to get your public IP is by running the following:
curl -4 icanhazip.comClick on Add Inbound Rule and create a new rule to limit access to Grafana port 3000 from our local machines.
-
Description:
ALLOW GRAFANA FROM_LOCAL -
Source:
<YOUR_PUBLIC_IP_ADDRESS_HERE> -
Action:
Allow -
Protocol:
TCP -
Port / Port Range:
3000
NOTE: Please be sure to swap the following example IP address with yours.
sudo yum install git wget python3
git clone https://github.com/aaroncouch/developerweek_2020_workshop.git
sudo python3 -m pip install requestsLet's continue by deploying the Scouter API globally so we can collect performance metrics from anywhere that Edge Compute is available.
Just like before with our VM, from the Dashboard select Create Workload and fill out Name & Type. This time we'll be using a Container Workload Type and specify the Scouter API Docker.io image and tag:
-
Name:
Global Scouter API Workload -
Workload Type:
Container -
Image:
aaroncouch/scouter_api:1.0.0
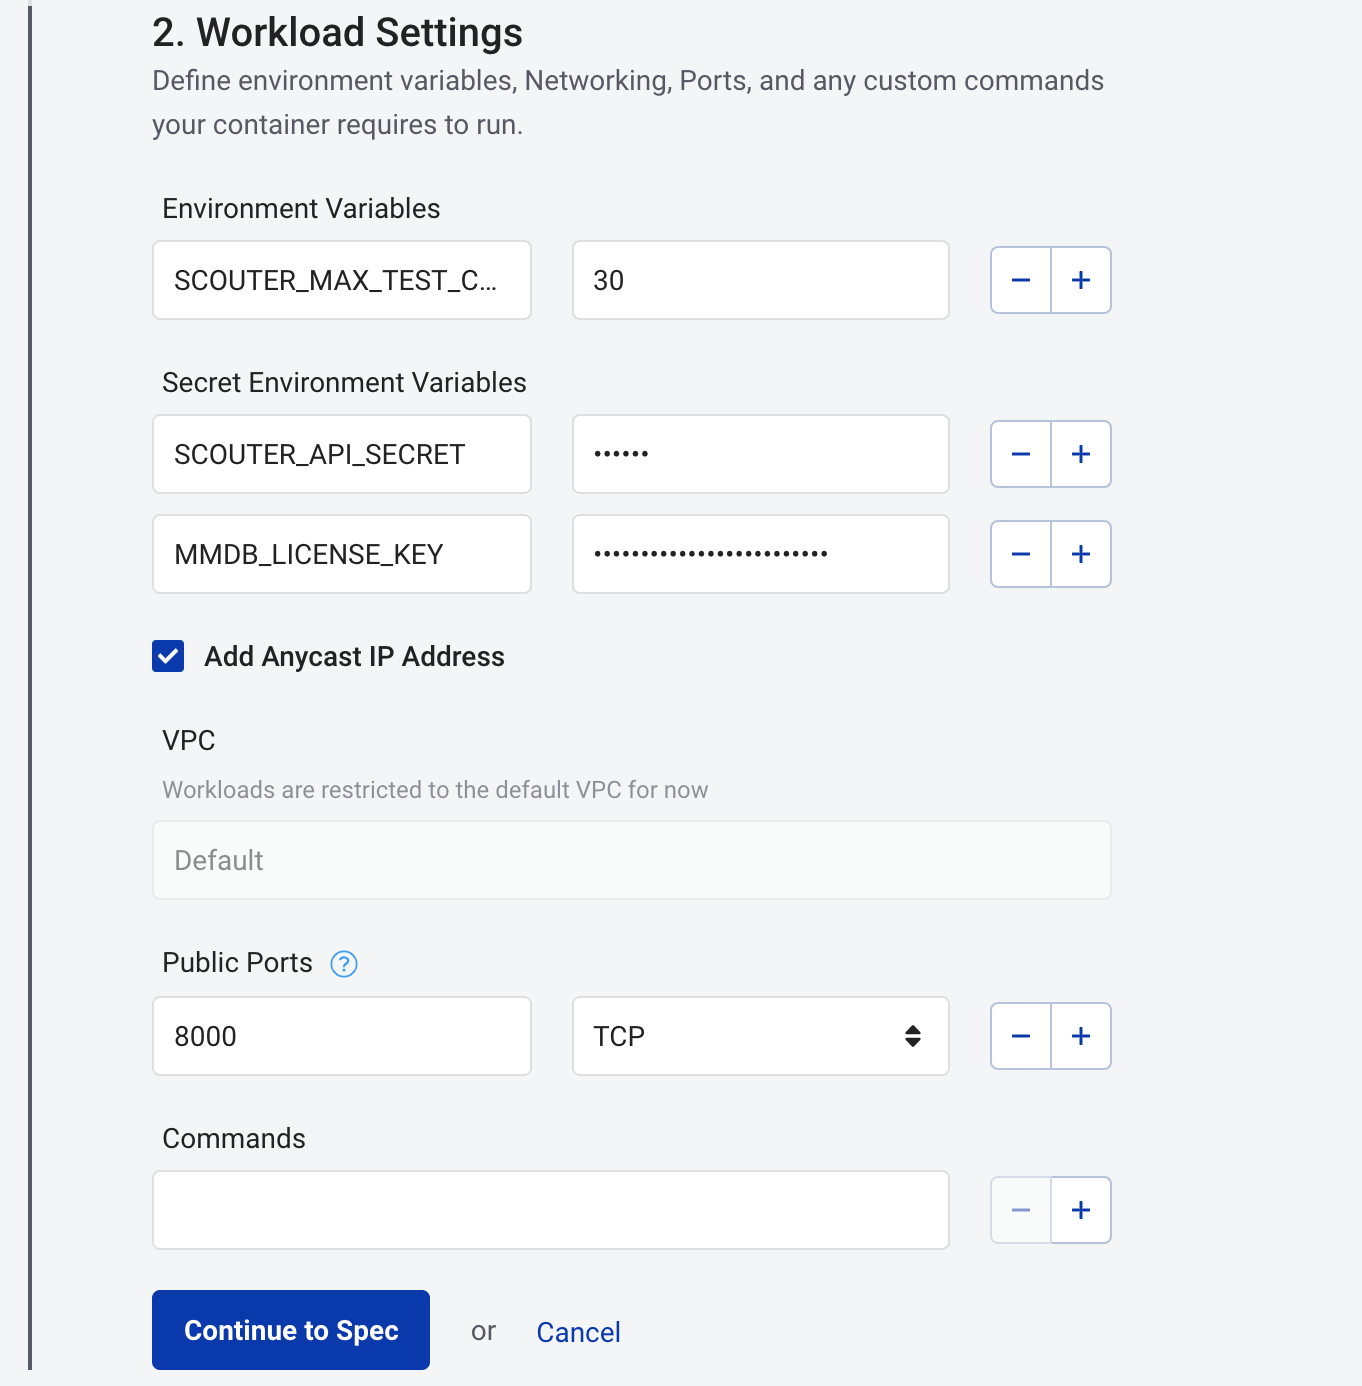
Click Continue to Settings. Specify a shared API secret for Scouter, our MMDB license key and we'll increase the default maximum test count to 30 all via environment variables.
-
Environment Variables:
SCOUTER_MAX_TEST_COUNT=30
-
Secret Environment Variables:
SCOUTER_API_SECRET=secretMMDB_LICENSE_KEY=<YOUR_MMDB_LICENSE_KEY>
-
Public Ports:
8000/TCP
Click Continue to Spec then specify the size and location of our workload. In this section we are going to select every single available StackPath PoP.
-
Spec:
SP-1 (1 vCPU, 2 GB RAM, 5 GB Root Disk) -
Deployment Target:
- Name:
global - PoPs: Select all available PoPs
- Name:
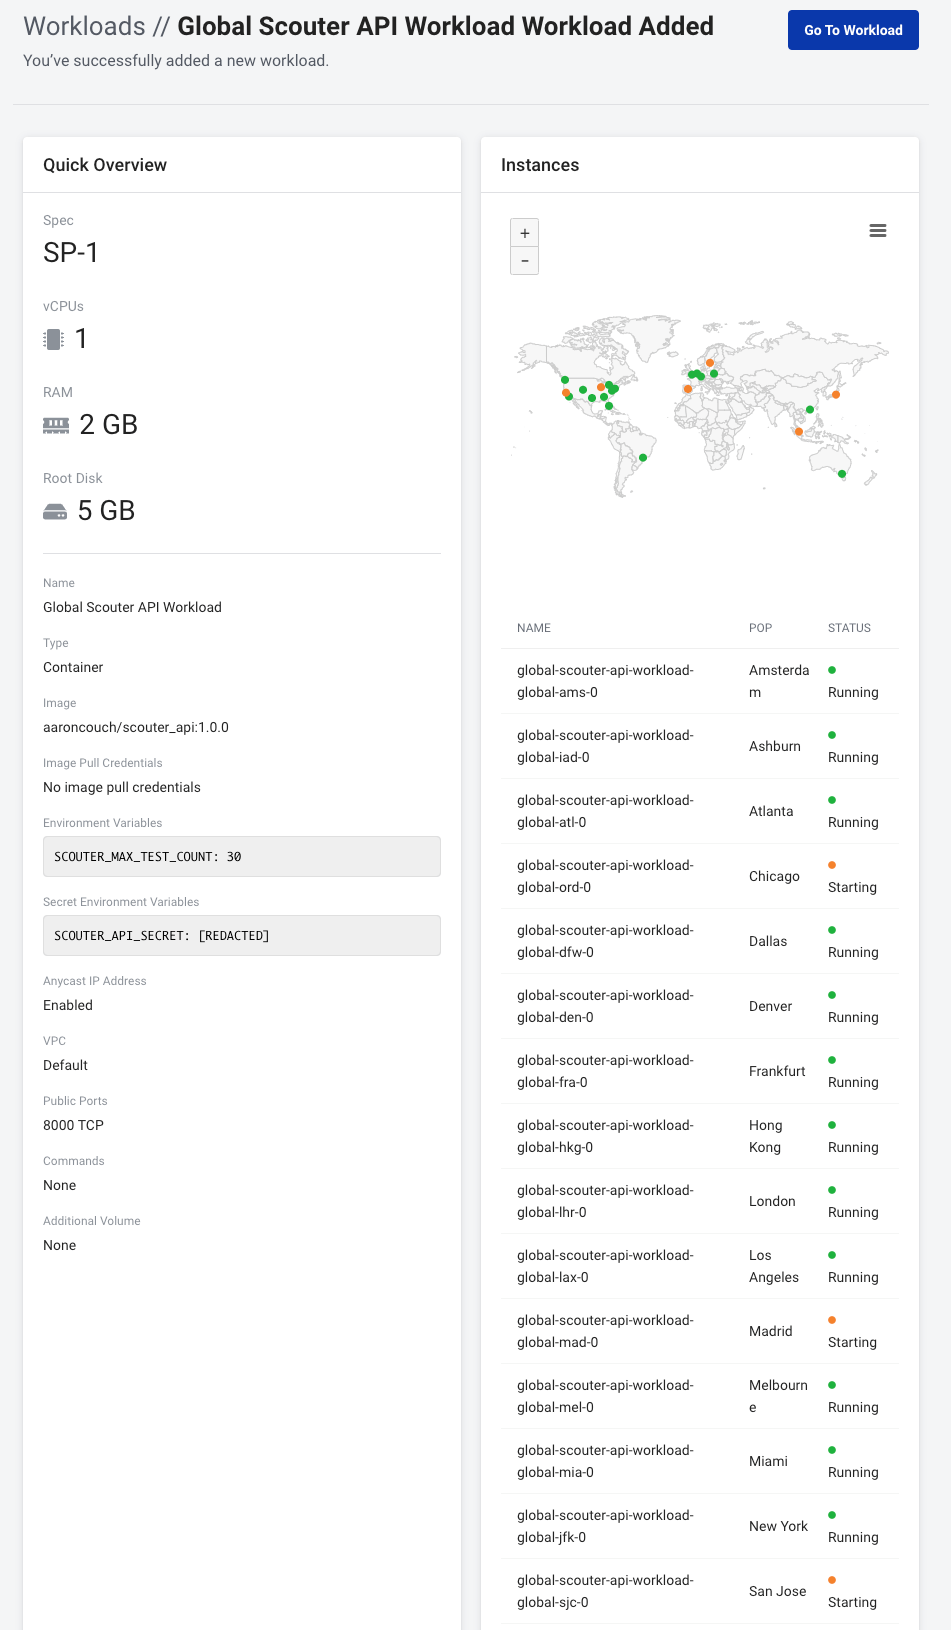
Click Create Workload and you'll be redirected to the following page:
After a short amount of time all of our workload's instances will switch into a Running STATUS. In the meantime we can proceed to the next section.
Let's modify the default inbound network policy that allows port 8000/TCP to restrict this access to our previously created VM.
From our workload's Overview page we should also see a page called Network Policies. Click it and edit the default inbound rule for 8000/TCP:
Now let's restrict access to the Scouter API to our Metric Collection Workload VM:
-
Description:
ALLOW API FROM_TELEGRAF -
Source:
<YOUR_VM_PUBLIC_IP_HERE> -
Action:
Allow -
Protocol:
TCP -
Port / Port Range:
8000
Proceed to your "Global Scouter API Workload" overview page, select a few of the public IP address of the running Scouter API instances, and run the following from your "Metric Collection Workload" VM:
NOTE: Please be sure to swap the following example IP address and example secret with yours.
curl -sSXGET -H "Authorization: secret" "http://192.0.2.1:8000/api/v1.0/status"Back to our VM. Let's continue there by installing and configuring InfluxDB so Telegraf has something to write to.
wget https://dl.influxdata.com/influxdb/releases/influxdb-1.7.1.x86_64.rpm
sudo yum localinstall influxdb-1.7.1.x86_64.rpm
sudo systemctl start influxdb
systemctl status influxdbLogin to Influx so we can start interacting with it:
influxOnce logged in let's create our database for storing performance metrics and setup users and permissions:
CREATE DATABASE "metricsdb";
CREATE USER "admin" WITH PASSWORD 'changeme' WITH ALL privileges;
CREATE USER "telegraf_wo" WITH PASSWORD 'changeme';
CREATE USER "grafana_ro" WITH PASSWORD 'changeme';
GRANT WRITE ON "metricsdb" TO "telegraf_wo";
GRANT READ ON "metricsdb" TO "grafana_ro";
exit
Once completed let's add our admin credentials to our environment:
echo "export INFLUX_USERNAME='admin'" >> ~/.bash_profile
echo "export INFLUX_PASSWORD='changeme'" >> ~/.bash_profile
source ~/.bash_profileInfluxDB has HTTP auth disabled by default. Let's enable that:
sudo vi /etc/influxdb/influxdb.confLocate the following section and ensure that # auth-enabled = false is uncommented and set to true:
[http]
  ...
  auth-enabled = true
Restart the service for good measure:
sudo systemctl restart influxdbLet's get the Telegraf server agent installed so we can pull peformance metrics from the Scouter API.
wget https://dl.influxdata.com/telegraf/releases/telegraf-1.8.3-1.x86_64.rpm
sudo yum localinstall telegraf-1.8.3-1.x86_64.rpmBefore we start the agent, let's get quickly set up to run the custom Scouter data collection script.
We're going to need to generate an StackPath API Client ID and Client Secret and note them. This can easily be done from the StackPath Dashboard's API Access section.
NOTE: The Client Secret is returned only once and is not stored by StackPath..
We're also going to need our account's Stack Slug and the associated Workload Slug for our Global Scouter API Workload.
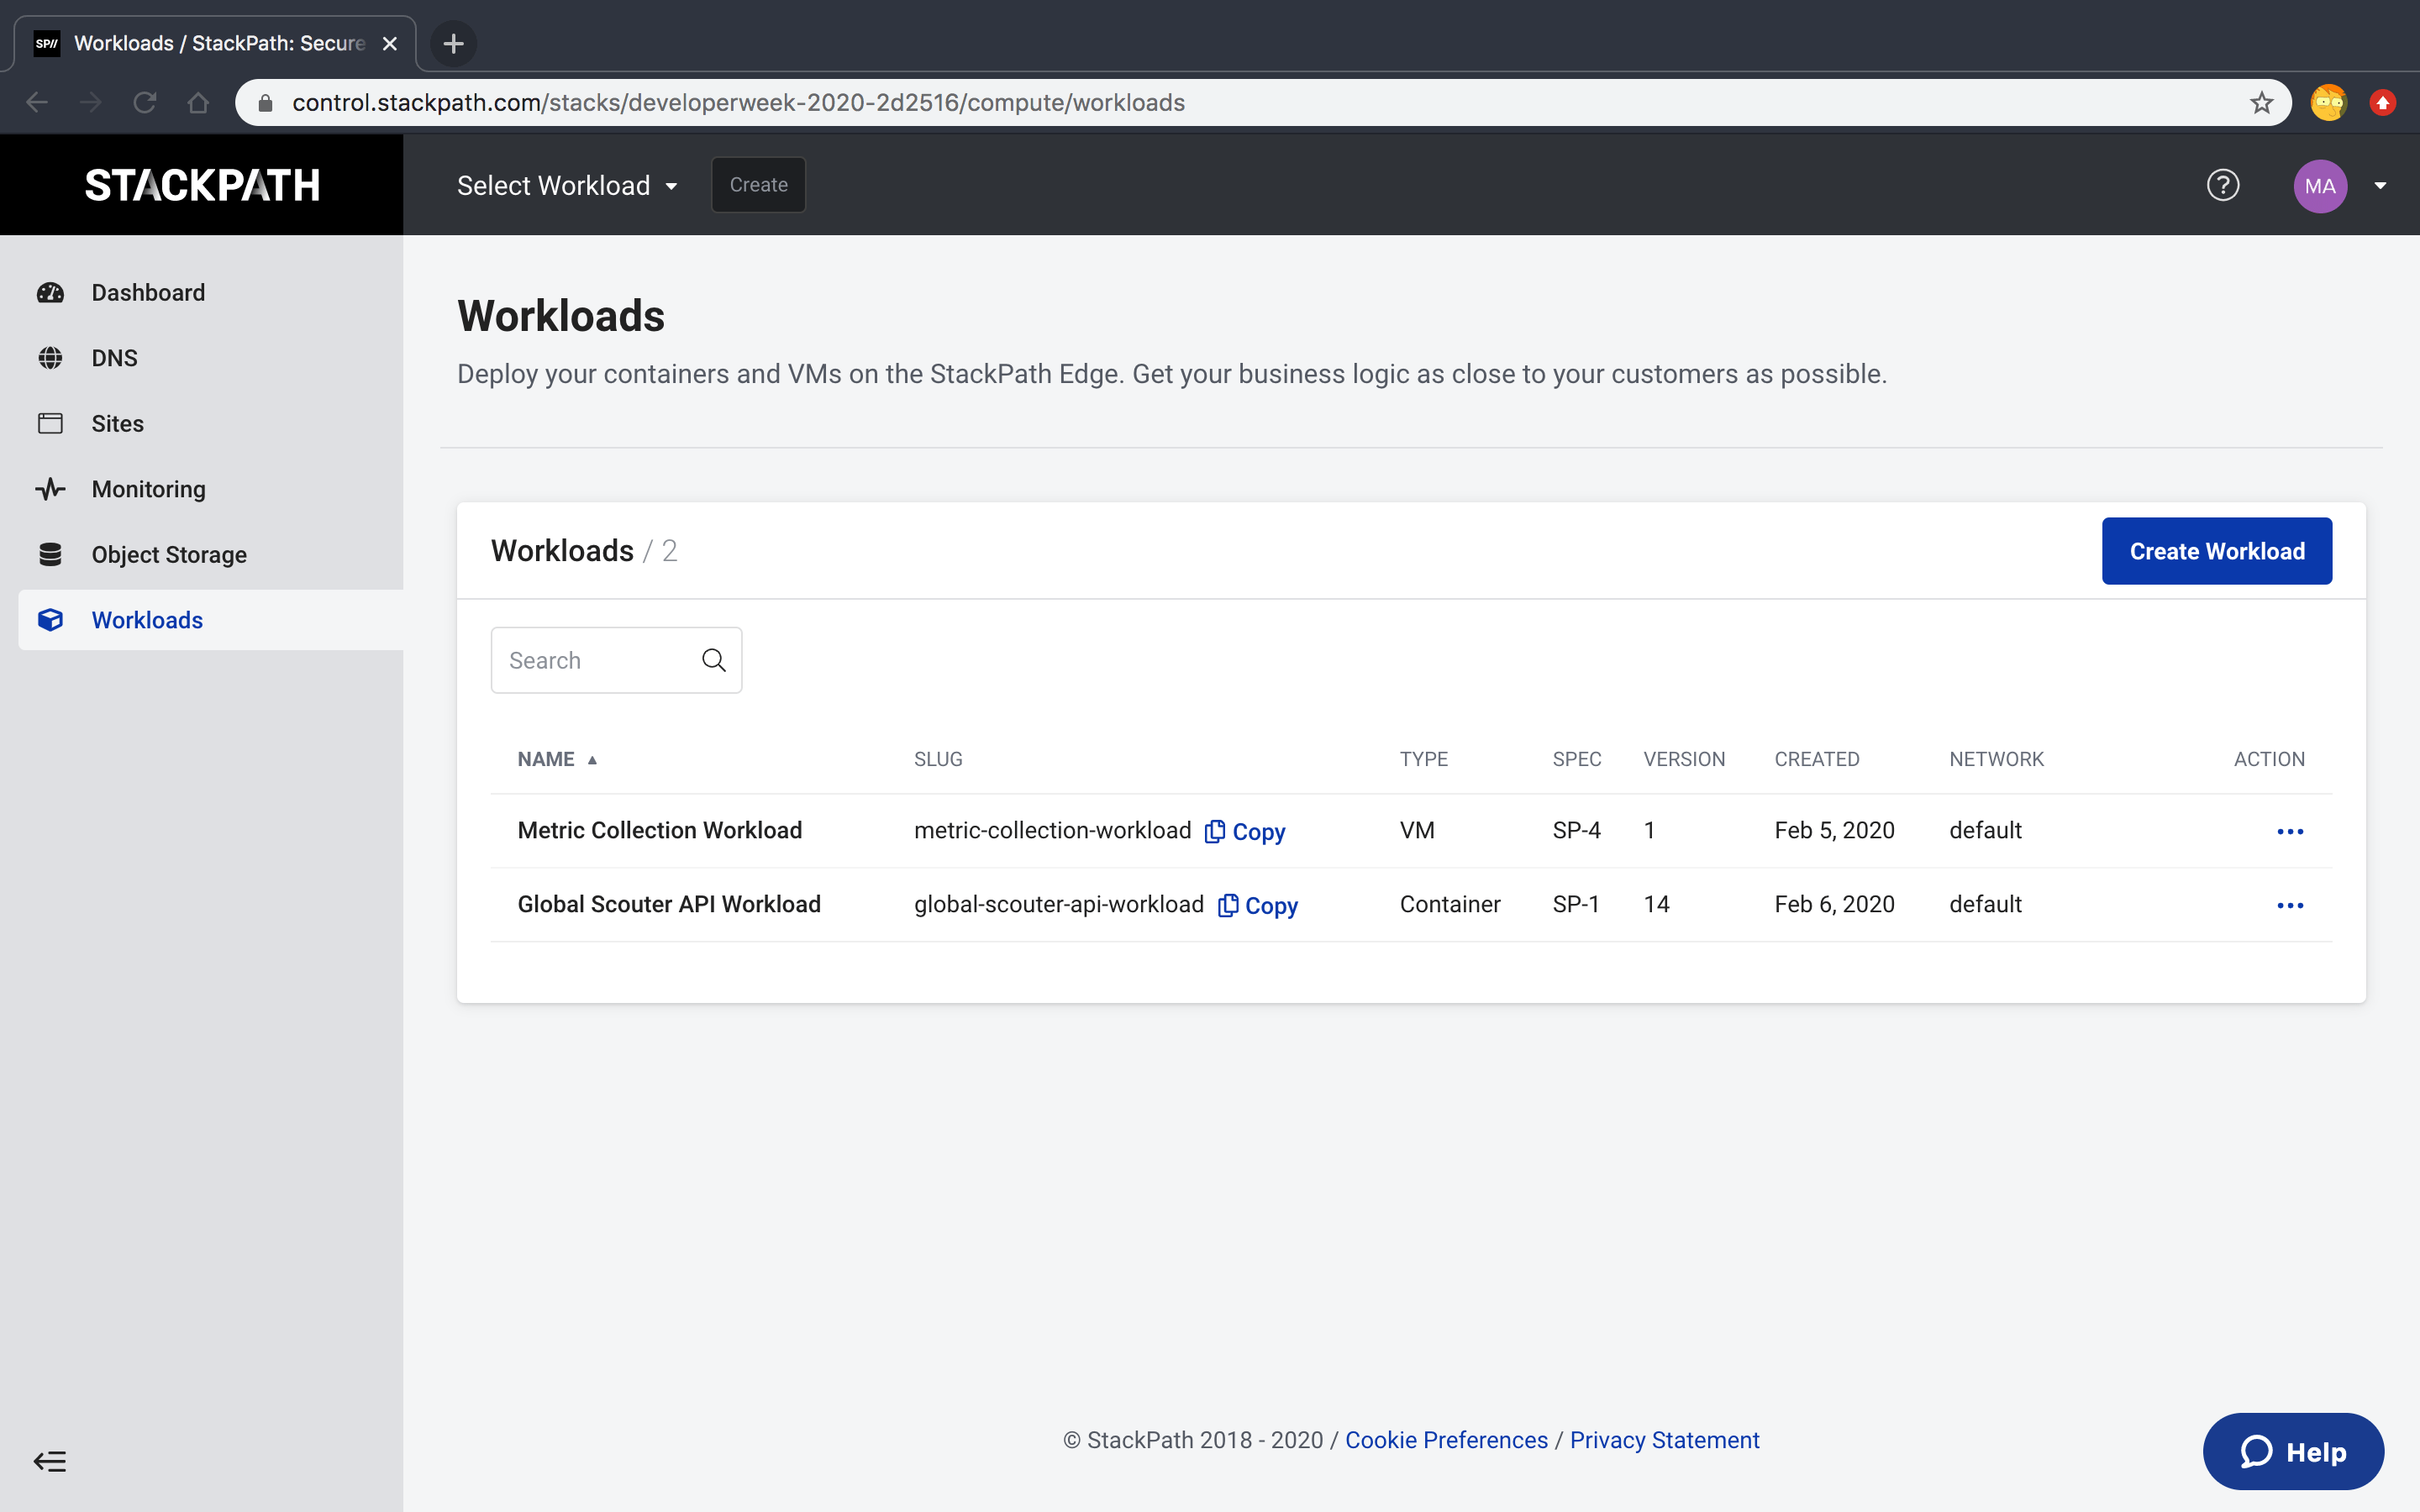
Please navigate to the Workloads tab on the left so we can retrieve this information. You should see the following:
We can easily get our current Stack Slug from the URL. For instance my URL is:
https://control.stackpath.com/stacks/developerweek-2020-2d2516/compute/workloads
My Stack Slug is developerweek-2020-2d2516. We can get our Scouter Workload Slug from the page itself. In our case this should be global-scouter-api-workload.
After getting all of that information, let's add them as environment variables so we don't have to paste things ad nauseam:
sudo vi /etc/default/telegrafNOTE: Please be sure to swap out the following placeholders with the information discussed previously.
SP_STACK_SLUG='developerweek-2020-2d2516'
SP_API_CLIENT_ID='<YOUR_STACKPATH_API_CLIENT_ID>'
SP_API_CLIENT_SECRET='<YOUR_STACKPATH_CLIENT_SECRET>'
SCOUTER_WORKLOAD_SLUG='global-scouter-api-workload'
SCOUTER_SECRET='secret'
For this workshop I've written a simple Python3 script that interacts with the StackPath API to pull actively running Scouter instances for the given workload and executes ICMP pings and traceroutes for you.
If you have a moment please review the custom script.
Let's copy this custom script over to /usr/bin/ so Telegraf can access it:
sudo cp ~/developerweek_2020_workshop/resources/scouter_client.py /usr/bin/Now let's set up /etc/telegraf/telegraf.conf so we can collect performance metrics from our Scouter API workload!
In this repository's resources is a preconfigured telegraf.conf file. Please take a moment to review its contents and make any appropriate changes:
vi ~/developerweek_2020_workshop/resources/telegraf.conf[global_tags]
[agent]
interval = "60s"
round_interval = true
metric_batch_size = 1000
metric_buffer_limit = 10000
collection_jitter = "0s"
flush_interval = "10s"
flush_jitter = "0s"
precision = ""
debug = false
quiet = false
# Log output to a file.
logfile = "/var/log/telegraf/telegraf.log"
hostname = ""
omit_hostname = true
# Configuration to output our metrics to InfluxDB.
[[outputs.influxdb]]
database = "metricsdb"
# We created the database manually.
skip_database_creation = true
# Please be sure to modify these values if changed.
username = "telegraf_wo"
password = "changeme"
# Configuration of our custom Scouter API data collection script.
[[inputs.exec]]
commands = [
'python3 /usr/bin/scouter_client.py --stack-slug="$SP_STACK_SLUG" --workload-slug="$SCOUTER_WORKLOAD_SLUG" --client-id="$SP_API_CLIENT_ID" --client-secret="$SP_API_CLIENT_SECRET" --scouter-secret="$SCOUTER_SECRET" --utility="ping"'
]
interval "90s"
timeout = "90s"
data_format = "influx"
# Traceroute takes a bit longer to finish compared to Ping. Added a separate input block with its
# own interval and timeout of 120s to account for that.
[[inputs.exec]]
commands = [
'python3 /usr/bin/scouter_client.py --stack-slug="$SP_STACK_SLUG" --workload-slug="$SCOUTER_WORKLOAD_SLUG" --client-id="$SP_API_CLIENT_ID" --client-secret="$SP_API_CLIENT_SECRET" --scouter-secret="$SCOUTER_SECRET" --utility="traceroute"'
]
interval = "120s"
timeout = "120s"
data_format = "influx"
# Configuration of metric data type conversion.
[[processors.converter]]
# A few fields returned by the custom script need to be floats.
[processors.converter.fields]
float = ["avg_rtt_ms", "loss_pct", "jitter_ms", "jitter_pct", "probe_0_rtt_ms", "probe_1_rtt_ms", "probe_2_rtt_ms", "probe_3_rtt_ms", "probe_4_rtt_ms", "final_hop_rtt_ms"]
integer = ["final_hop_ttl"]
Once you're done editing the configuration file; proceed with copying it to /etc/telegraf/telegraf.conf and start the server agent:
sudo cp ~/developerweek_2020_workshop/resources/telegraf.conf /etc/telegraf/telegraf.conf
sudo systemctl enable telegraf
sudo systemctl start telegraf
systemctl status telegraf
Monitor our on-disk logging to ensure that no errors are present:
tail -f /var/log/telegraf/telegraf.logLet's validate that data is being inserted before we proceed to the next part of the workshop.
Log back into InfluxDB:
influxQuery our metricsdb and ping measurement for metrics:
USE "metricsdb";
SHOW MEASUREMENTS;
SELECT * FROM "ping" LIMIT 2;
exit
The resulting query will look something like this:
> SELECT * FROM "ping" LIMIT 2;
name: ping
time                avg_rtt_ms dst       dst_pop failed jitter_ms          jitter_pct         loss_pct probe_0_rtt_ms     probe_1_rtt_ms     probe_2_rtt_ms     probe_3_rtt_ms     probe_4_rtt_ms     public_ip src_pop src_slug
----                ---------- ---       ------- ------ ---------          ----------         -------- --------------     --------------     --------------     --------------     --------------     --------- ------- --------
1581131071000000000 157.045    192.0.2.2 sea     0      2.0546913146972656 1.3083455790997904 0        158.5826873779297  154.07156944274902 157.3312282562256  157.46045112609863 157.77921676635742 192.0.2.3 ams     scouter-api-workload-premade-global-ams-0
1581131071000000000 115.631    192.0.2.4 fra     0      2.6592016220092773 2.299730714089887  0        115.62943458557129 114.58086967468262 114.43591117858887 119.12870407104492 114.37821388244629 192.0.2.5 yyz     scouter-api-workload-premade-global-yyz-0
At this point in the guide we are almost ready to visualize data.
Let's get Grafana installed so we can make some dashboards:
wget https://s3-us-west-2.amazonaws.com/grafana-releases/release/grafana-5.3.4-1.x86_64.rpm
sudo yum localinstall grafana-5.3.4-1.x86_64.rpm
sudo systemctl enable grafana-server
sudo systemctl start grafana-server
systemctl status grafana-server
Let's also install a plugin that adds a new panel type called boomtable:
sudo grafana-cli plugins install yesoreyeram-boomtable-panel
sudo systemctl restart grafana-serverThe grafana-server should now be up and running. From your local machine in your web browser
please navigate to:
NOTE: Please be sure to swap the following example IP address with yours.
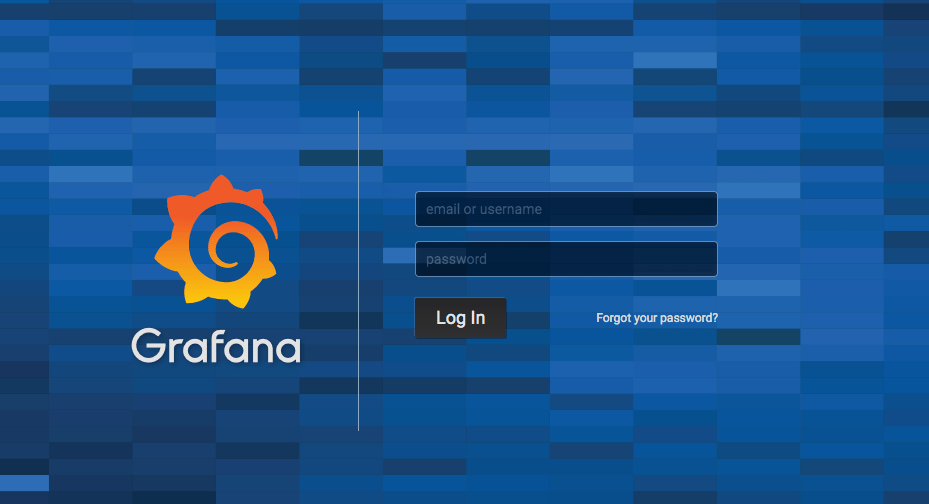
The default login credentials for Grafana are admin/admin. Please change this in the next prompt.
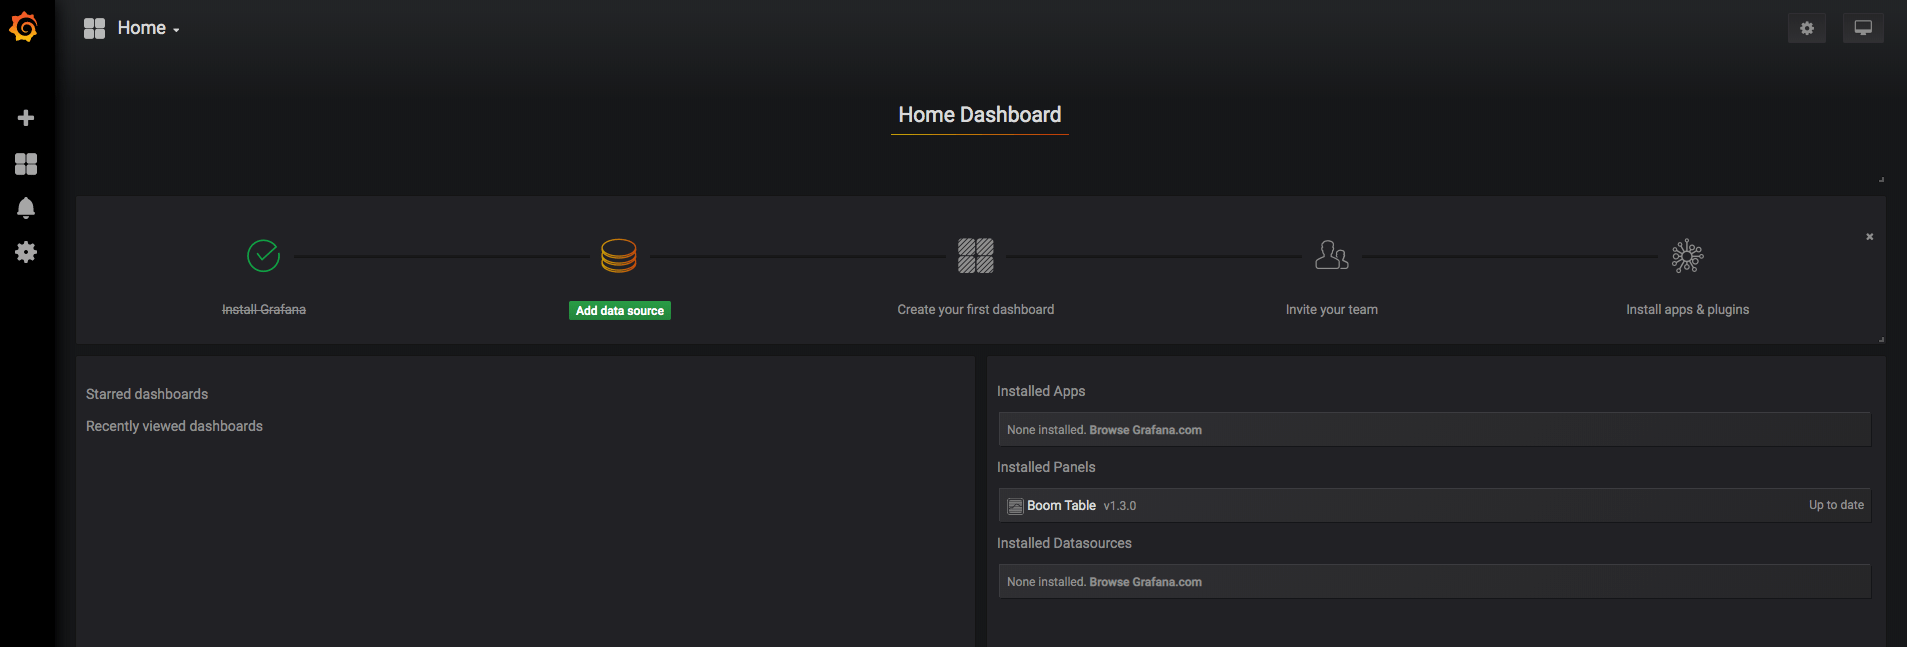
Once you've completed the login process you'll be redirected to your Home Dashboard:
Let's add our InfluxDB metricsdb as a new data source within Grafana.
From your Home Dashboard select Add data source. Here we can fill out the settings for
our local instance of InfluxDB and our metricsdb database:
After completing this step; navigate back to your Home Dashboard.
Let's add our very first dashboard so we can dive into our Performance metrics!
From your Home Dashboard select New dashboard. You will be redirected to the following page:
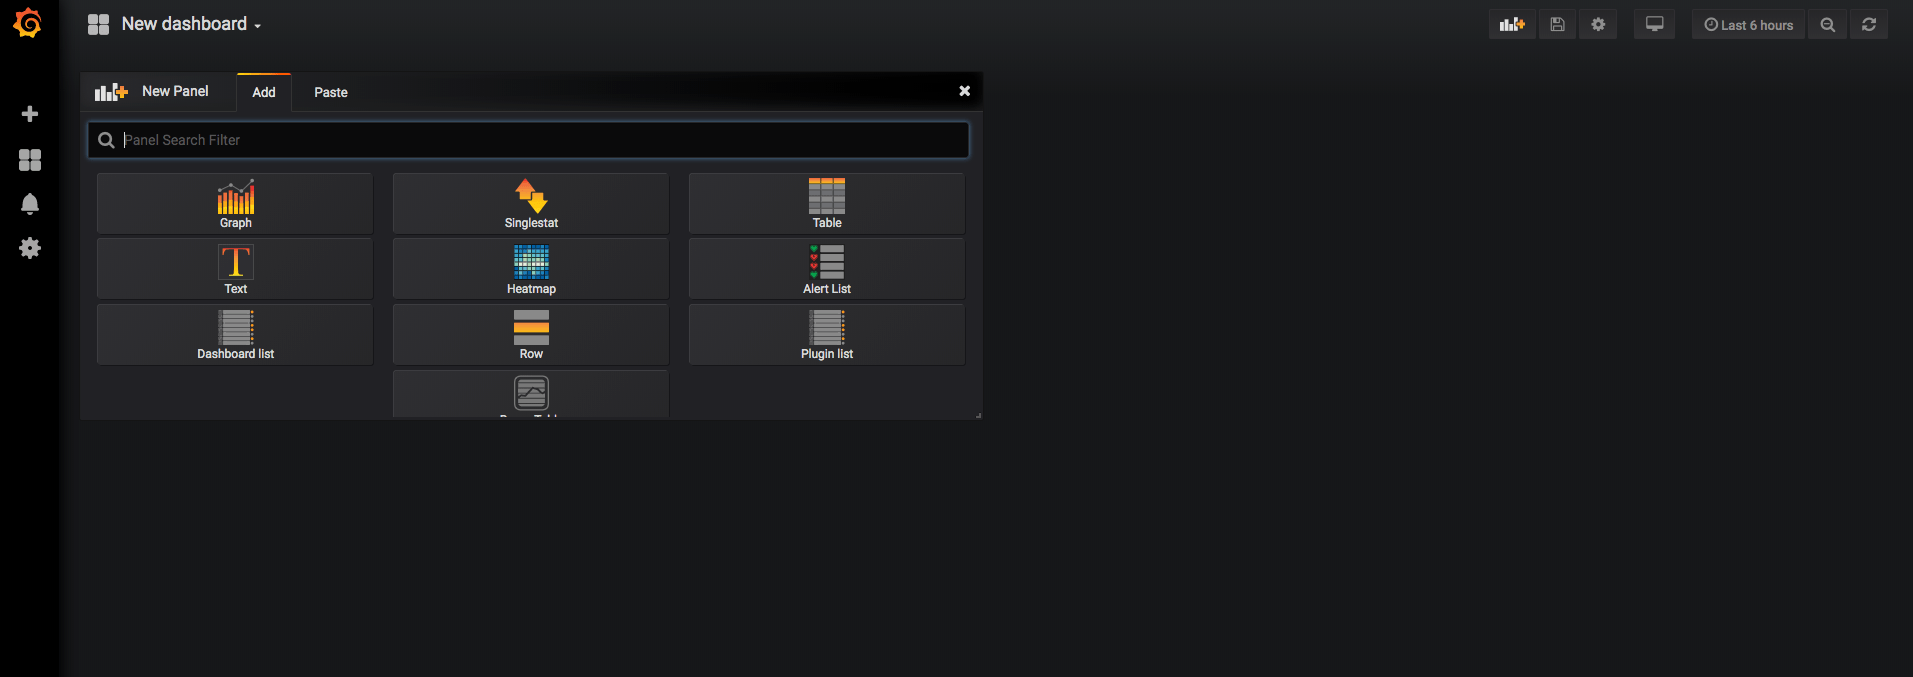
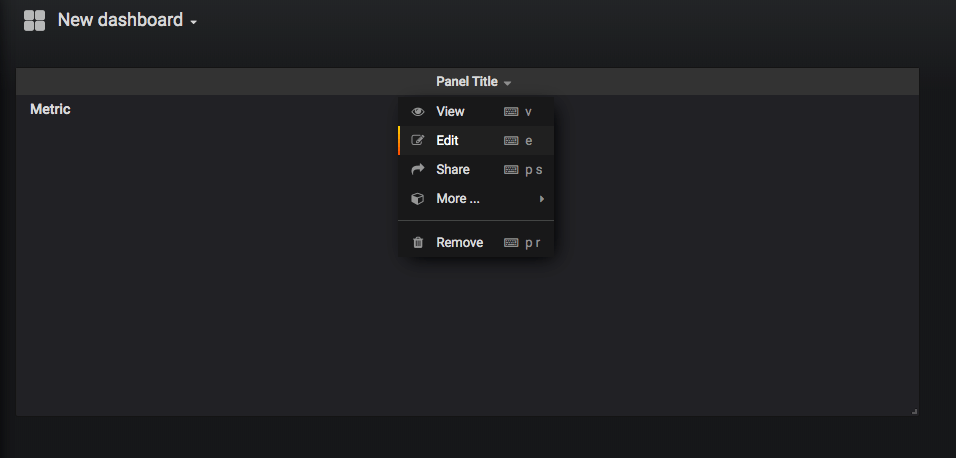
Select the Boom Table panel type and then edit the panel:
From the edit page for our panel change the Data Souce to metricsdb:
Now let's Toggle Edit Mode so we can write raw InfluxQL:
Time to query our database! Let's add the following simple query to get the average ICMP ping
latency between all of our Global Scouter API Workload instances:
SELECT MEAN("avg_rtt_ms")
FROM "ping"
WHERE $timeFilter AND "dst_pop" != 'Unknown'
GROUP BY "dst_pop", "src_pop";
Let's also setup the ALIAS BY field to be used in table formatting next:
$tag_src_pop.$tag_dst_popOnce added, your query should look like this:
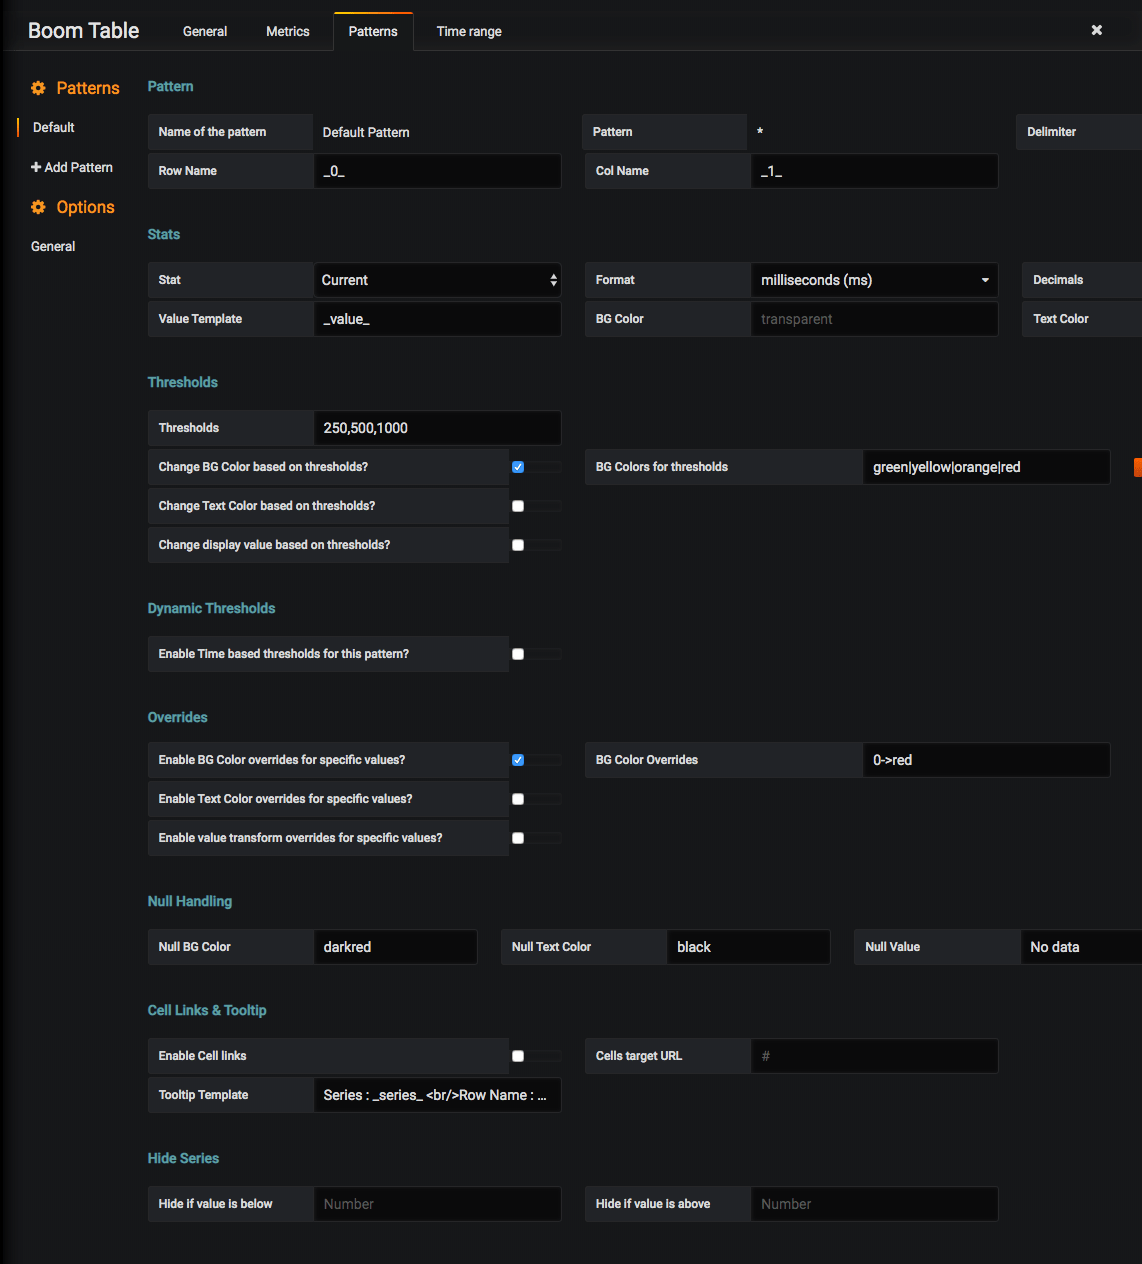
Navigate to the Patterns tab and modify the following field values:
- Pattern
- Row Name:
_0_ - Col Name:
_1_
- Row Name:
- Stats
- Stat:
Current - Format:
milliseconds (ms) - Decimals:
0 - Text Color:
black
- Stat:
- Thresholds
- Thresholds:
250,500,1000 - Change BG Color based on thresholds?: ✅
- BG Colors for thresholds:
green|yellow|orange|red
- Thresholds:
- Overrides
- Enable BG Color overrides for specific values?: ✅
- BG Color Overrides:
0->red
Once modified our Patterns tab should look like this:
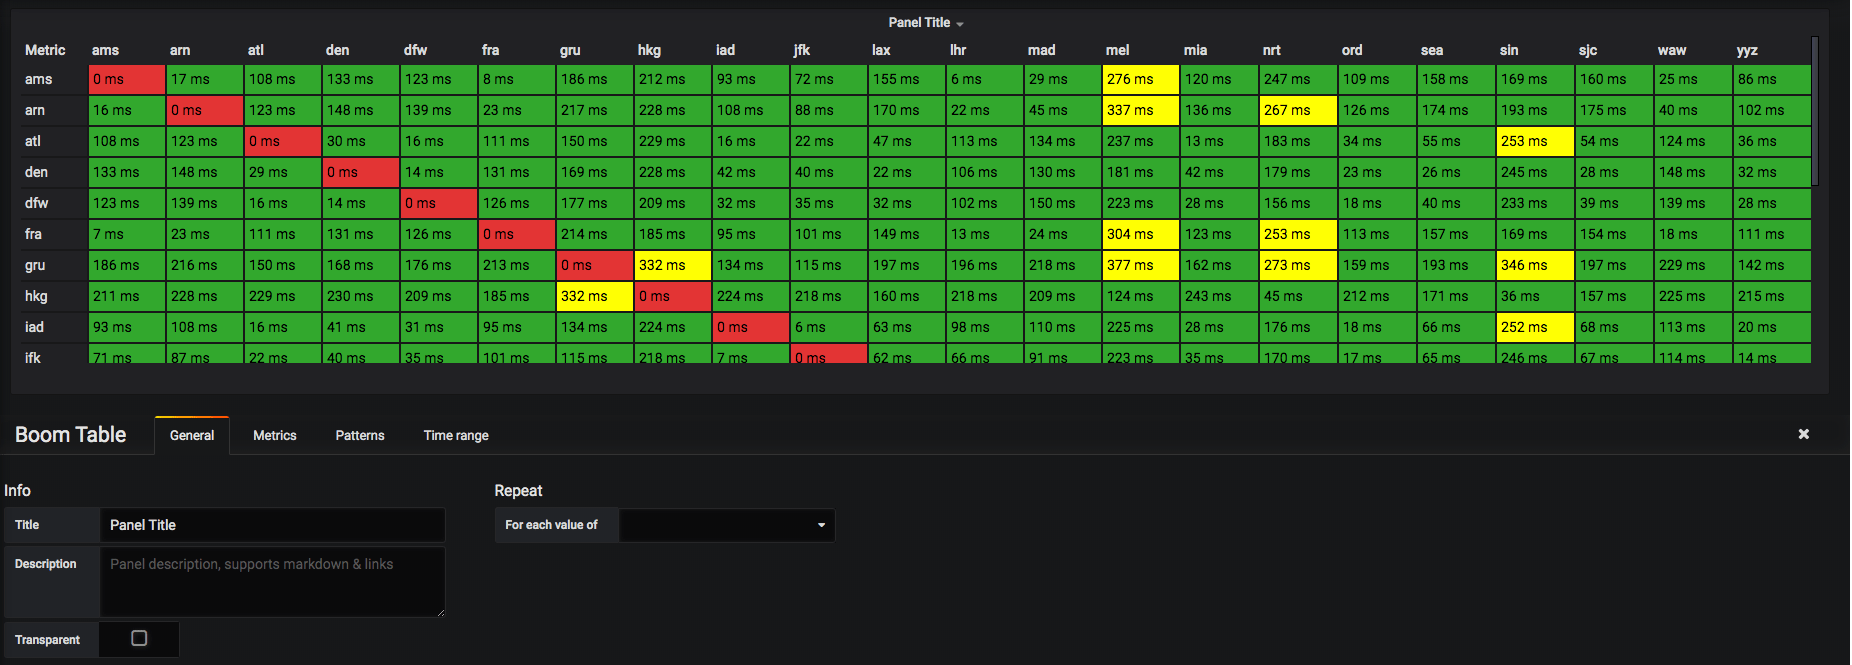
Once completed navigate to the General tab take a look at that data!
Awesome! We've created a Ping Latency Mesh Table where we can view the average latency between any given Edge Compute source PoP and destination PoP.
We can now tell where we perform well and where we don't.
Let's add some more visualizations and dashboards in the next section.
Included in this workshop guide are two pre-built Grafana dashboard JSON models.
Let's import both of these to our Grafana instance.
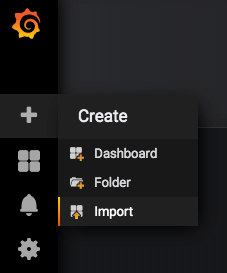
From your Home Dashboard select the Create option then Import in the left panel:
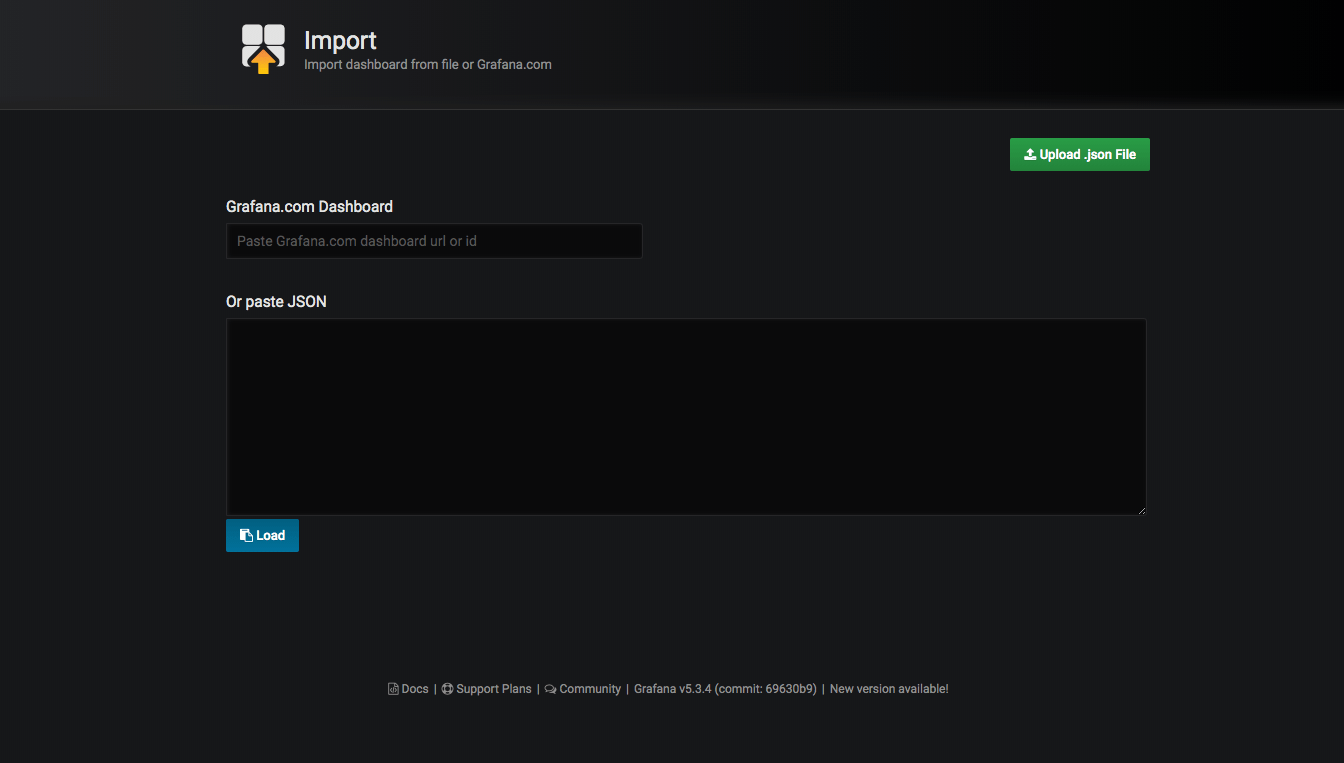
You should be presented with the following page:
Paste the contents of edge-compute-performance-mesh.json into the Or paste JSON text box and select Load.
You should now see the following:
Select Import.
You should now see the same exact panel we created in the previous section with two additional
panels: EdgeCompute Jitter PCT Mesh and EdgeCompute Packet Loss Mesh. These are very similar to our EdgeCompute Latency Mesh, but the metrics visualized are jitter_pct and loss_pct respectively.
Please follow the same exact steps for the mesh-detail.json JSON
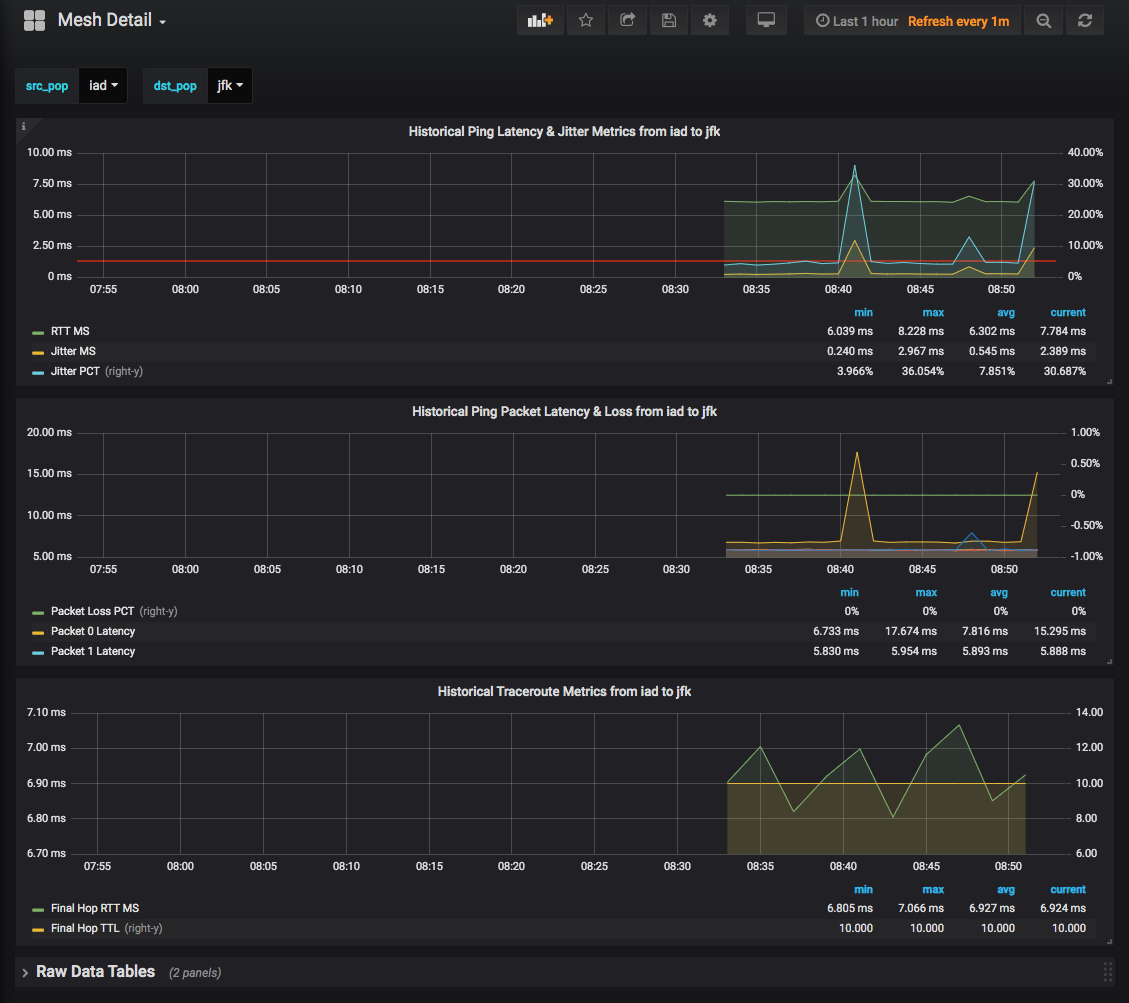
model. Once completed you should have an additional dashboard called Mesh Detail:
Our entire monitoring stack is now up and running and we're visualizing our performance data pulled remotely from around the globe via Scouter!
Let's do a quick deep dive into a small set of data. Let's say that I want to see how well the interconnectivity between our SJC (San Jose) and our JFK (New York) instances look:
Click on the cell to redirect us to our Mesh Detail page with both the correct src_pop
and dst_pop variables set to sjc and jfk respectively:
On the Mesh Detail page we can explore ping and traceroute historical data. For instance we could monitor for route changes and see if any metrics change, like avg_rtt_ms or jitter_ms, for better or worse!
So that's it! We've deployed our own globally-scaled monitoring stack to StackPath's Edge Compute platform.
We're now in a position to monitor for, or even alert on, any potential performance impacting events.
Let's do a quick recap of what we've done.
We deployed two Workloads within StackPath's Edge Compute platform.
The first is our Metric Collection Workload that's being used to collect, aggregate, and write performance metrics via Telegraf to our local InfluxDB metricsdb as well as visualize that data via Grafana.
The second workload is our globally deployed Global Scouter API Workload that's being used to execute both ping and traceroute remotely via the Scouter API container.
All of this is possible thanks to all of the open-sourced software available to us!

