For this project, I created a Python script to visualize the weather of 500+ cities across the world of varying distance from the equator. To accomplish this, I utilized a simple Python library called citipy and the OpenWeatherMap API.
When executing the code in WeatherPy.ipynb, please get a WeatherPy api key from OpenWeatherMap(https://openweathermap.org/api) and plug it into the api_key variable.
Interpretation of Latitude and Temperature
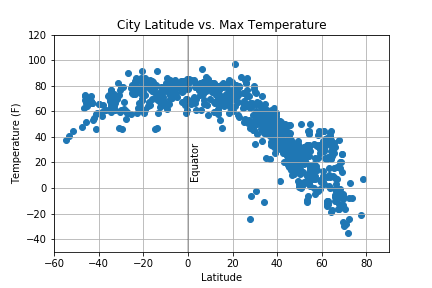
From the [City Latitude vs. Max Temperature graph], I can see that a lower absolute value of latitudes show higher temperature. This means that areas closer to the equator receive higher temperatures, whereas areas farther away from the equator receive lower temperatures.

Interpretation of Latitude and Humidity
From the Latitude vs. Humidity Plot, it appears that the average humidity is higher where the latitude is higher (northern hemisphere). However, my data is takien from the middle of March 2018. This may be due to the seasons. A more accurate assessment would have to be taken with historical data from the different times of the year.

Interpretation of Latitude and Wind Speed
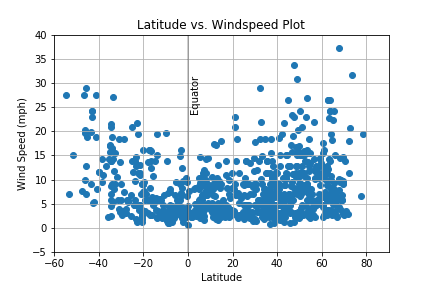
From the Latitude vs Windspeed Plot, the lower wind speeds appeared closer to the equator (lower absolute values of latitudes). By contrast, higher wind speeds appear farther from the equator.

Latitude and Cloudiness
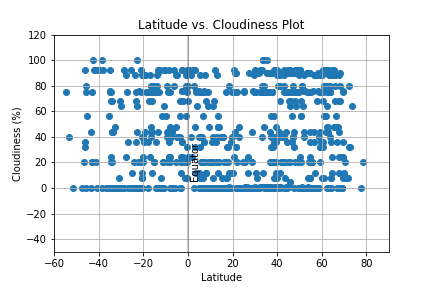
There aren't any visible patterns in the Latitude vs Cloudiness plot
