This project is a parallel word counter that utilizes a MapReduce-inspired approach to count individual word occurrences across multiple text files. It is optimized for speed, scalability, and accuracy, using Go's concurrency primitives.
- MapReduce Paradigm: Distributes file processing (Map phase) and aggregates results in parallel (Reduce phase).
- Concurrency: Implements worker pools and multiple reducers to fully utilize available CPU cores.
- Profiling Support: Supports CPU, memory, block, and execution trace profiling.
- Fault Tolerance: Graceful error handling and panic recovery to ensure robust execution.
https://github.com/striversity/gotr/blob/master/018-profiling/ep18.1-word-count/examples/ex04/main.go This project builds upon the original implementation and introduces significant improvements:
-
Problem: The original implementation used
bufio.ScannerwithScanWords, which mixed up punctuation with the words. -
Improvement: Replaced the word splitting logic with
bufio.Readerandstrings.FieldsFuncto accurately handle punctuation.Benefit: Words are extracted more cleanly, ensuring correctness in word counts.
-
Problem: The original implementation had a fixed worker count (default 4), which could underutilize or overwhelm system resources.
-
Improvement: Dynamically sets the number of workers to
runtime.NumCPU()to match the number of CPU cores.Benefit: Optimized parallelism for maximum performance across different hardware.
-
Addition: Implemented unit tests to validate correctness across edge cases:
- Mixed casing of words
- Handling punctuation
- Accuracy of total word count
Benefit: Ensures program correctness and reliability under varying input conditions.
-
Problem: The original implementation had a single reducer, which created a bottleneck when aggregating results.
-
Improvement: Introduced multiple reducers, each processing partial results in parallel. A
sync.Mutexensures safe concurrent access to the final result map.Benefit: Reduced contention during result aggregation and improved overall execution time.
-
Amdahl's Law: This principle states that the overall speedup of a program is limited by the fraction of its execution time that is serial (not parallelizable). In simple terms, the more code you can parallelize, the greater the speedup; however, the serial sections of code become the bottleneck as parallelism increases.
-
Problem: In the original code, result printing was performed sequentially after all files were processed. As the workload grew, this serial phase began to limit performance improvements, regardless of how many workers were employed.
-
Improvement: Getting rid of serial bottlenecks, the program achieves better parallel efficiency, leading to faster processing of large workloads.
-
Gustafson's Law: Unlike Amdahl's Law, Gustafson's Law considers the scalability of workloads. It states that as more processors (cores) become available, users can increase the problem size (e.g., larger datasets or more files) to achieve near-linear speedup.
-
Note for Users: If you observe underutilized cores while profiling with tools like
go tool trace, you can leverage Gustafson's Law by increasing the number of text files or scaling up the workload. This ensures that the available CPU cores are fully utilized, and the program achieves greater speedup as more work is distributed among workers.
Run go tool trace after profiling to identify underutilized cores. If some workers appear idle, scale up the workload by adding more files to process.
-
Original: The previous implementation used
bufio.ScannerwithScanWords, processing one word at a time. -
Improvement: Implemented chunked reading using
bufio.Reader(1 MB chunks) and custom word splitting logic withunicodefor identifying word boundaries.Advantages of Buffered Reader:
-
Faster processing for large files due to reduced I/O calls.
-
More control over word boundary handling.
-
Improved memory efficiency.
Benefit: Significant performance improvement when processing large files.
-
Addition: Workers are protected with
recovermechanisms to gracefully handle unexpected panics without crashing the program.Benefit: Increased robustness when handling faulty or corrupt files.
-
Added versatile profiling options using
github.com/pkg/profileandruntime/trace. Supported profiling types: -
CPU profiling
-
Memory profiling
-
Block profiling
-
Execution tracing
Benefit: Provides deep insights into performance bottlenecks and resource usage.
- Go: Ensure Go is installed (version 1.19 or above).
- Git: For cloning the repository.
-
Clone the repository:
git clone <repository-url>
cd <repository-folder>
-
Build the project:
go build -o wordcounter . -
Run the application:
./wordcounter testdata/* -
Profiling options:
-
To enable profiling, pass the desired profile flag:
./wordcounter -w 4 -cpuprofile cpu.prof file1.txt file2.txt
./wordcounter -memprofile mem.prof file1.txt
-
-
Run tests:
go test -v
Command:
./wordcounter sample1.txt sample2.txtOutput:
Processing took: 150msTo analyze performance, enable profiling:
-
CPU Profiling
./wordcounter -cpuprofile cpu.prof sample.txt
Analyze with:
go tool pprof <cpu.prof_file>
-
Memory Profiling
./wordcounter -memprofile mem.prof sample.txt
Analyze with:
go tool pprof <mem.prof_file>
-
Execution Trace
./wordcounter -trace trace.out sample.txt
Analyze with:
go tool trace trace.out
Run the unit tests:
go test -vExample Output:
=== RUN   TestWordCount
--- PASS: TestWordCount (0.02s)
PASS
ok wordcounter 0.02s- Distributed Processing: Enable the program to run across multiple machines for even larger datasets.
- Customizable Reducer Strategy: Allow the user to choose between single or multiple reducers.
- Integration with Cloud Storage: Support reading files from S3 or other cloud storage services.
- Inspired by the MapReduce paradigm and the original GoTR word count implementation.
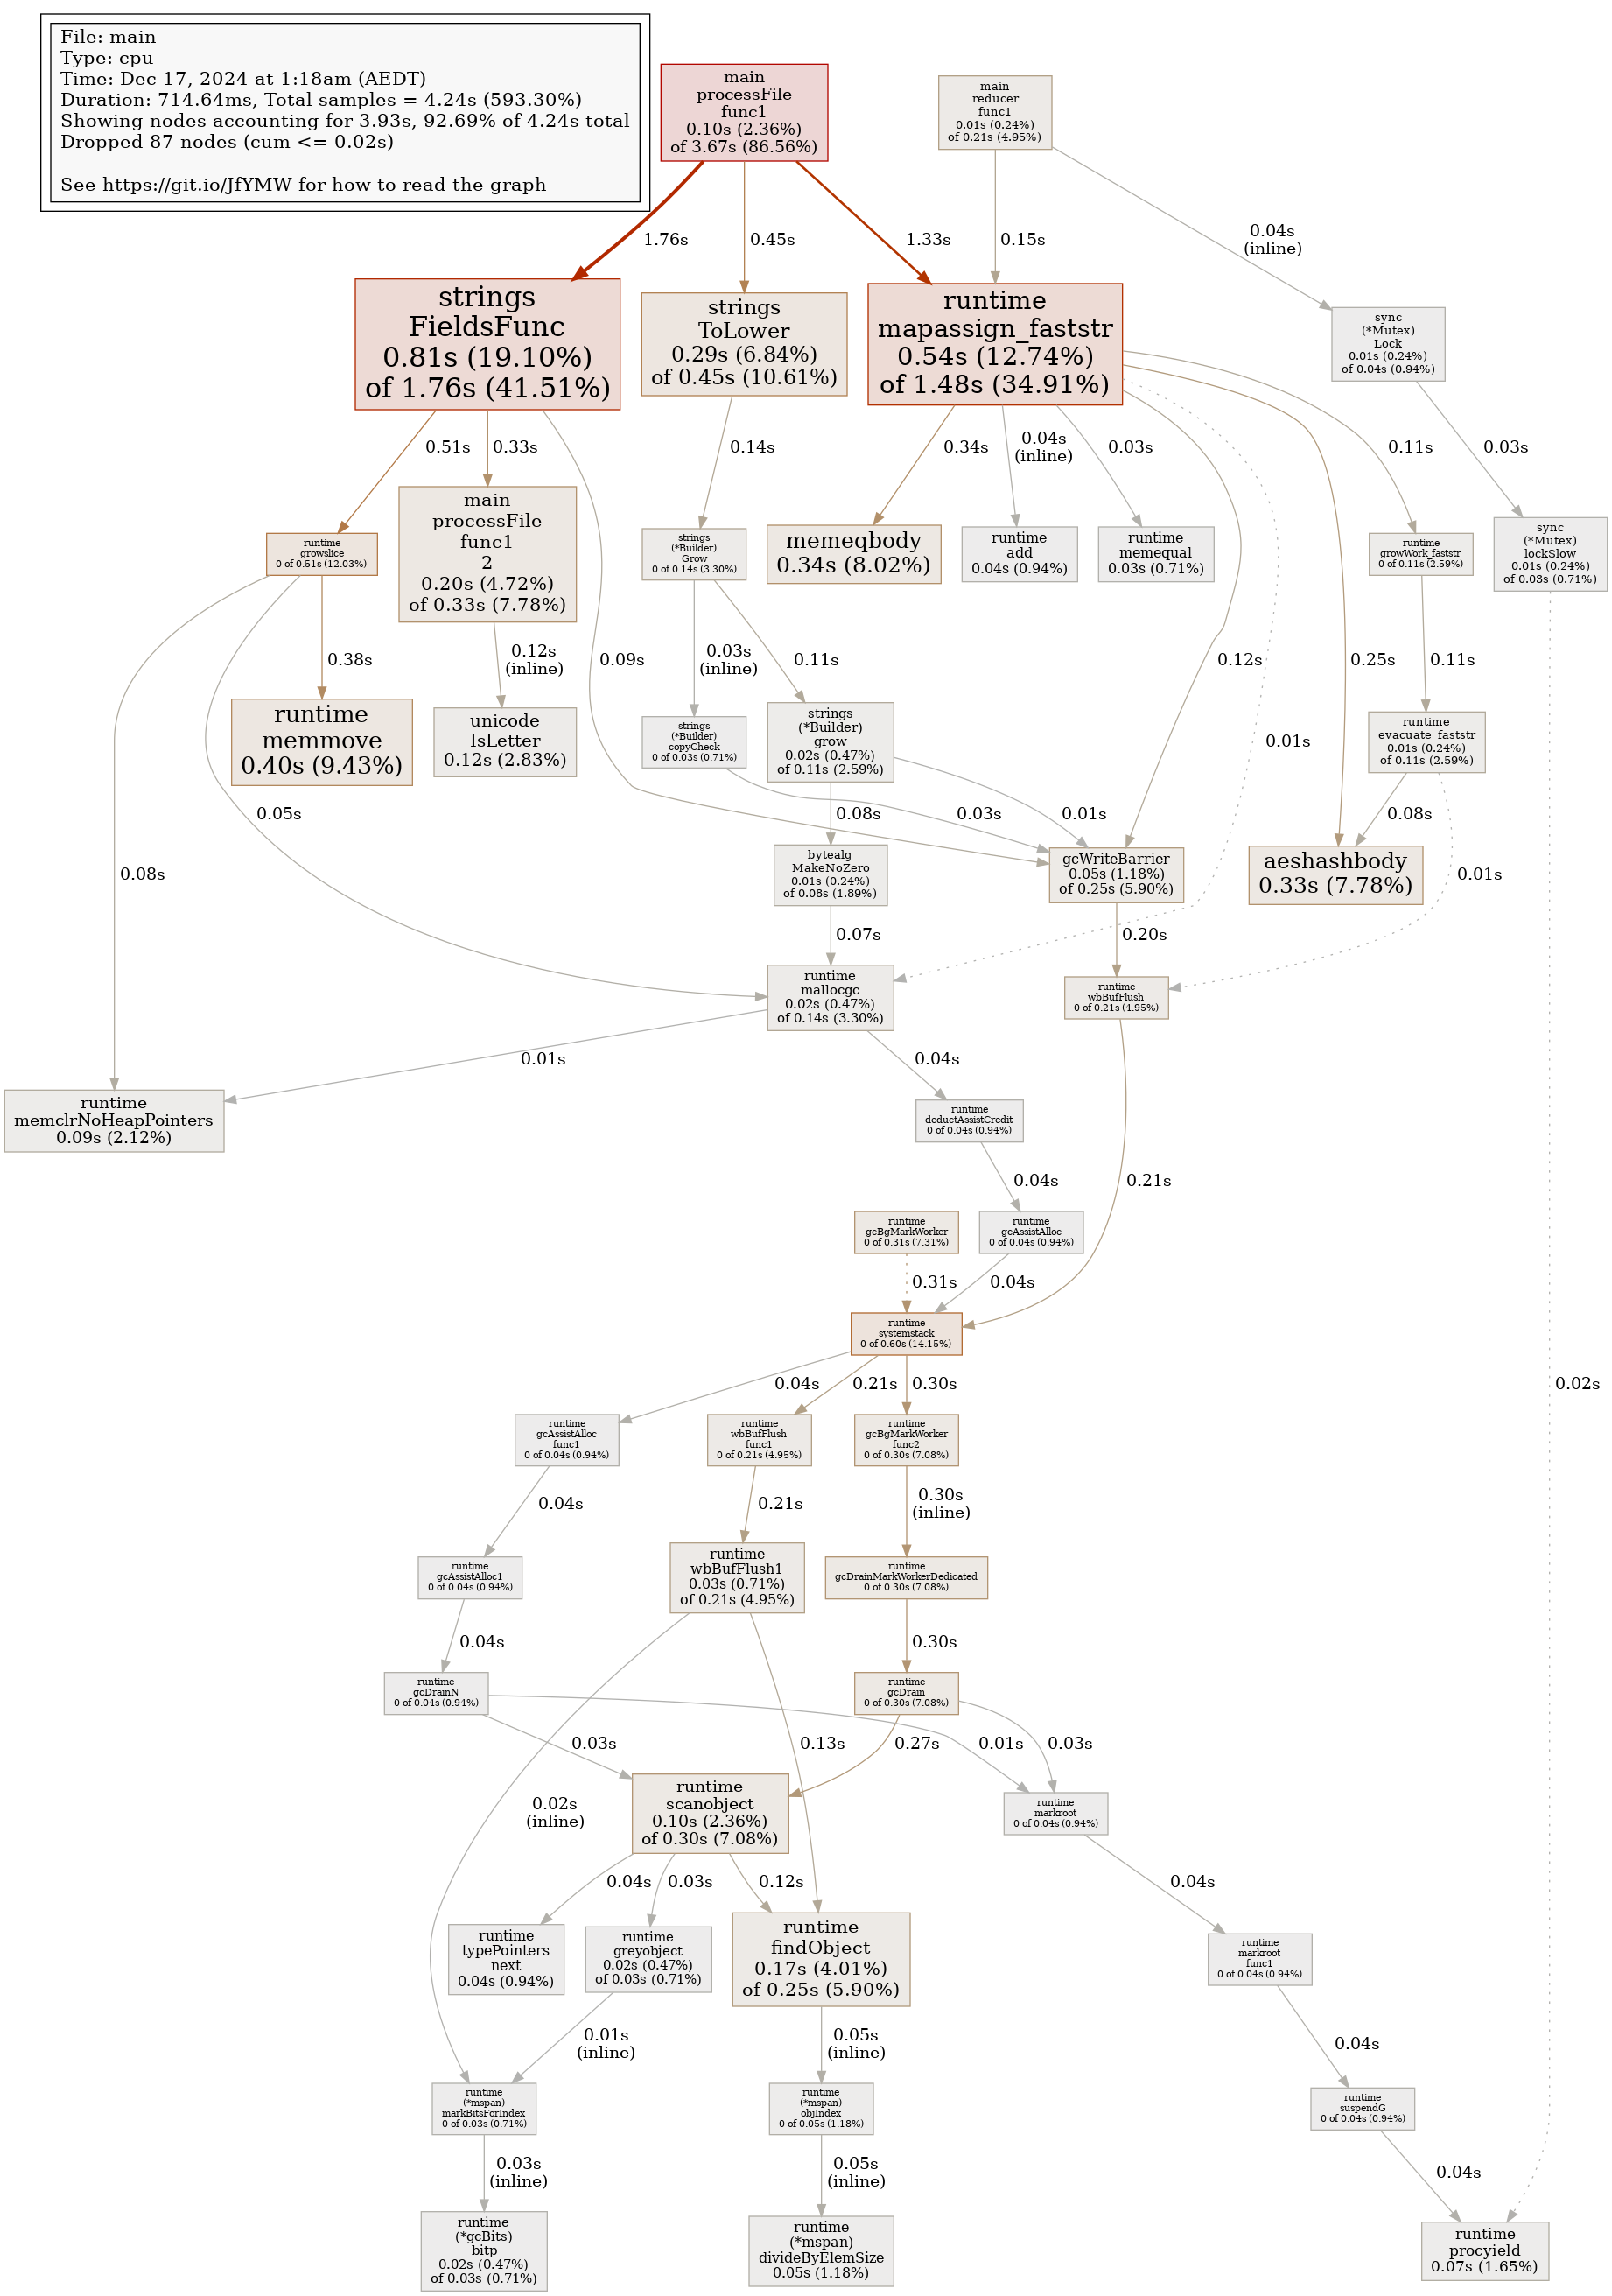
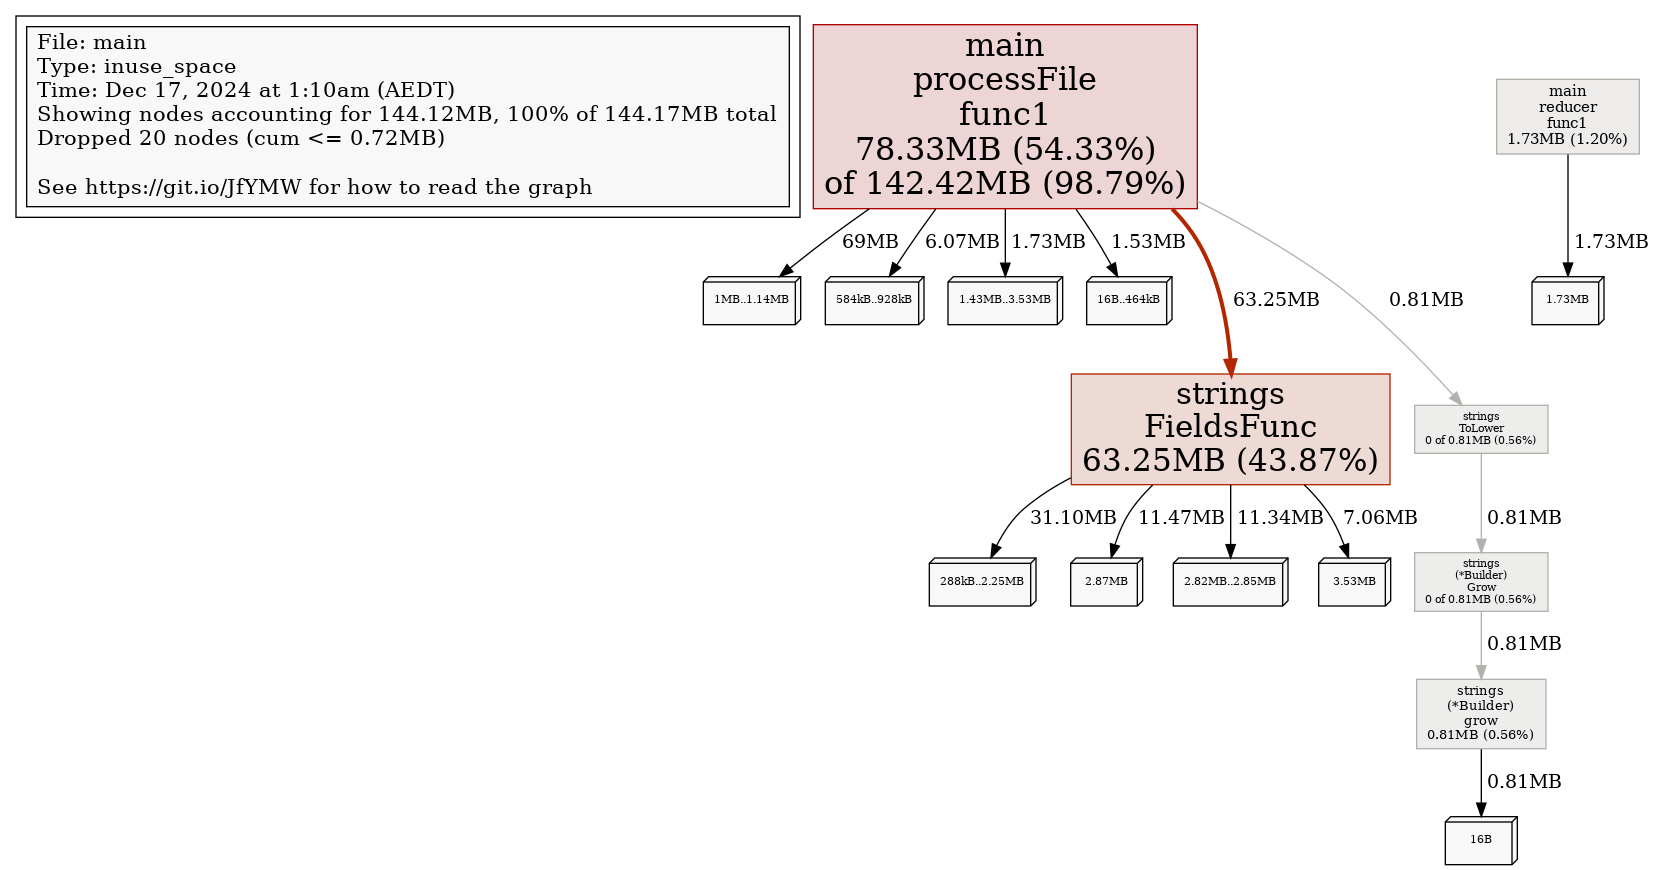
To measure the performance and validate the improvements in this project, CPU profiling, memory profiling, and execution tracing were conducted at various stages of optimization (stored in assets directory). The following assets highlight key insights from each profiling step:
-
cpuprofile.png:
Displays the CPU usage profile during the execution of the word counting task. This highlights areas where CPU cycles were consumed, helping identify bottlenecks and opportunities for parallel optimization. -
memprofile.png:
Shows the heap memory allocation profile. It illustrates how memory usage evolves during execution, ensuring efficient resource management in the program. -
final_output.png:
Presents the final aggregated word count results after processing input files.
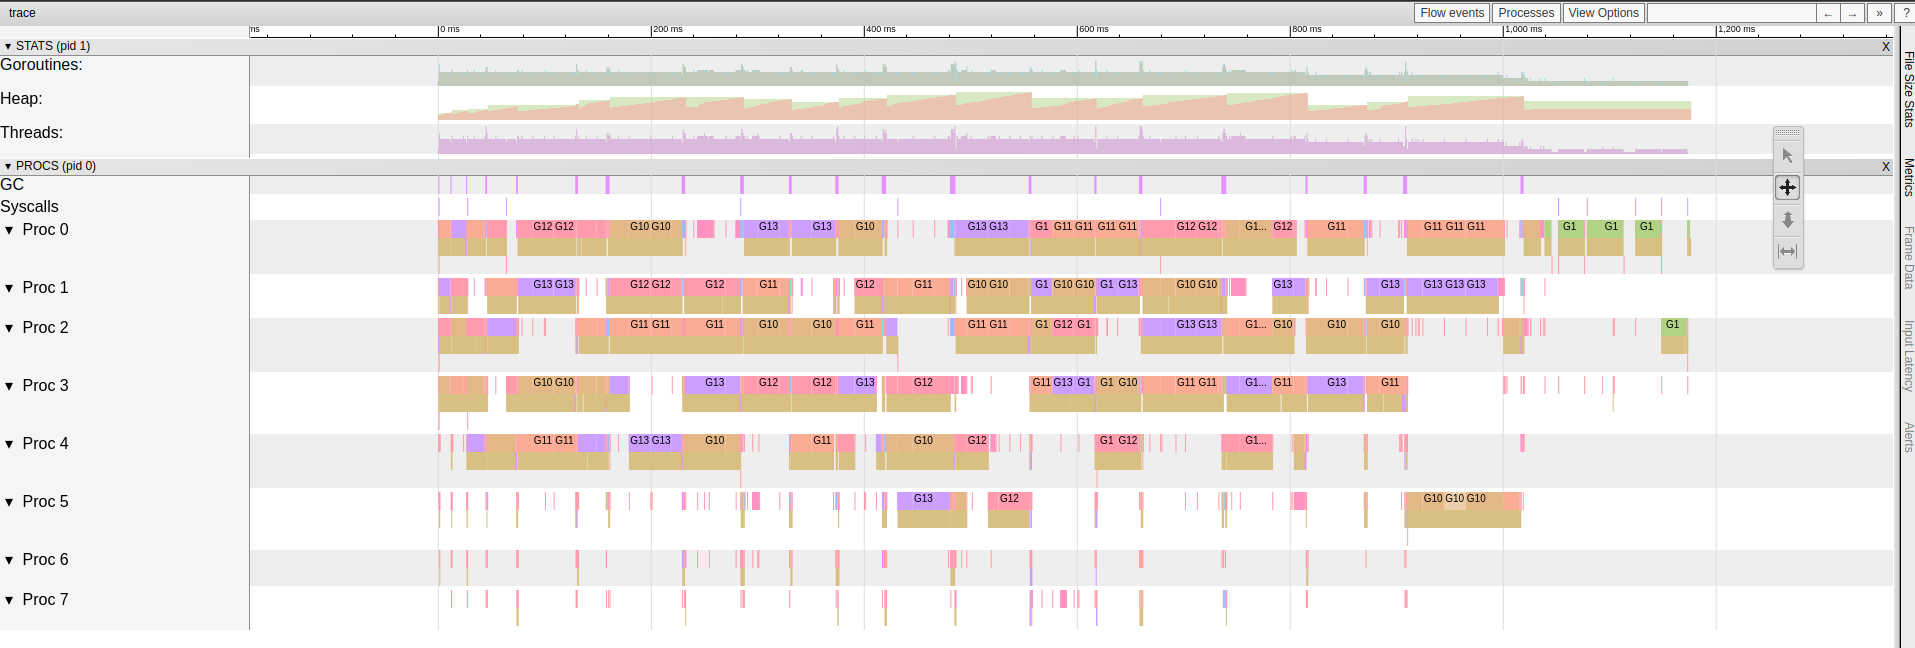
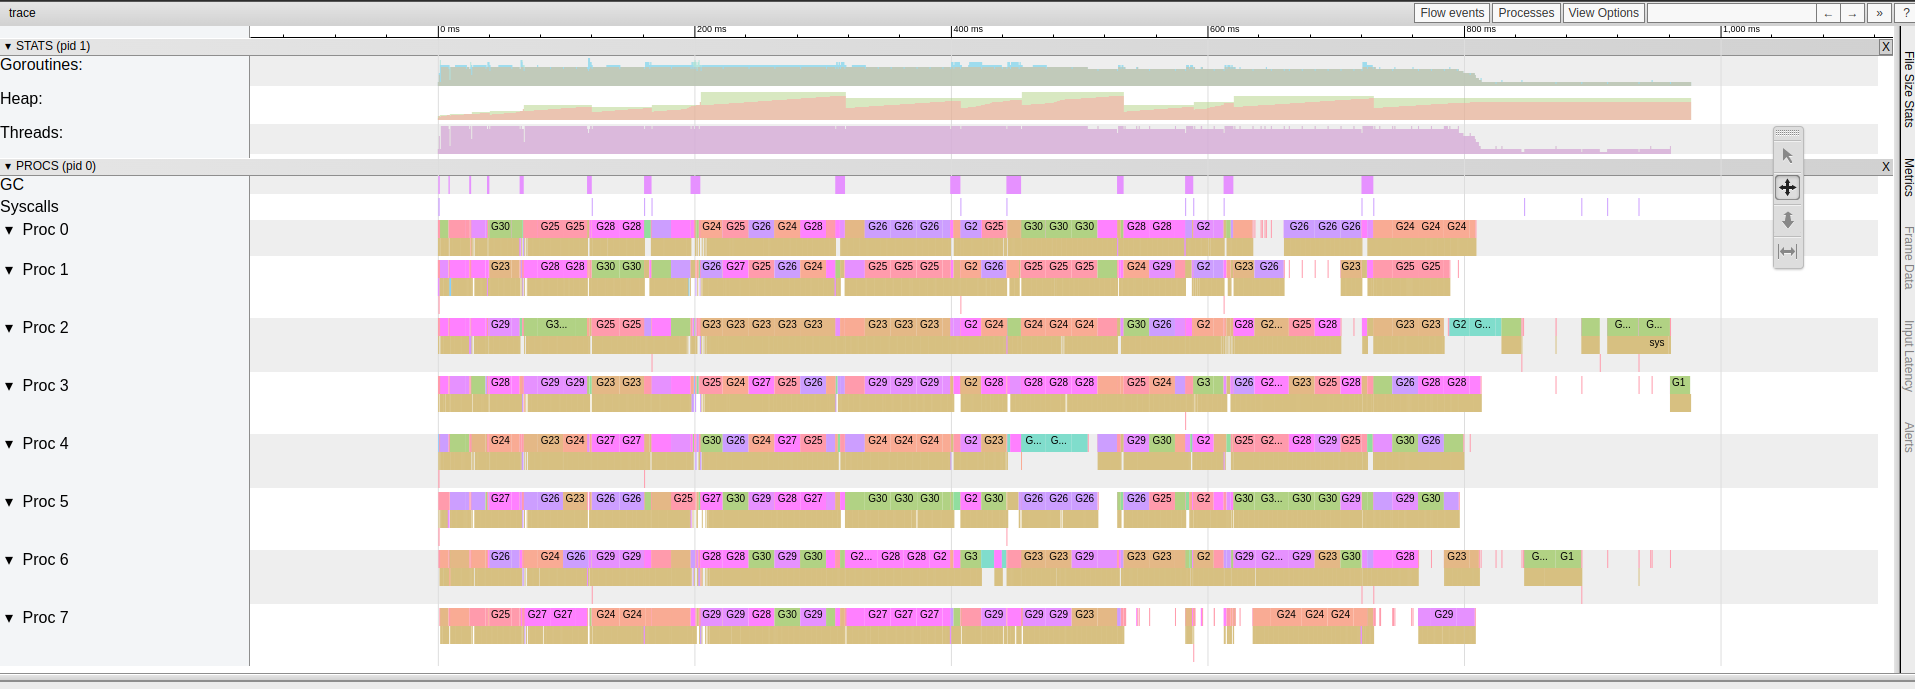
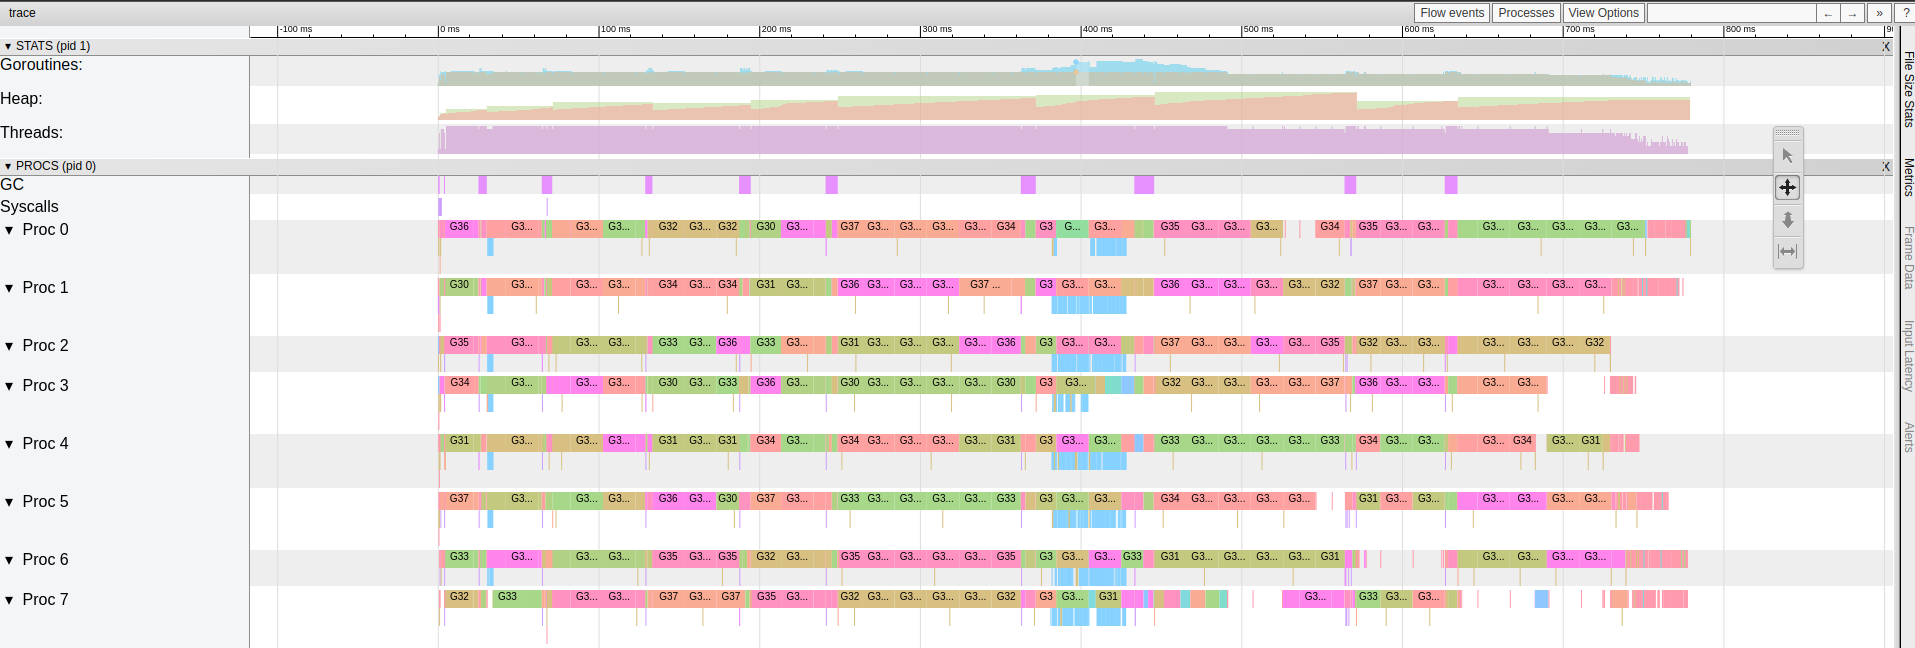
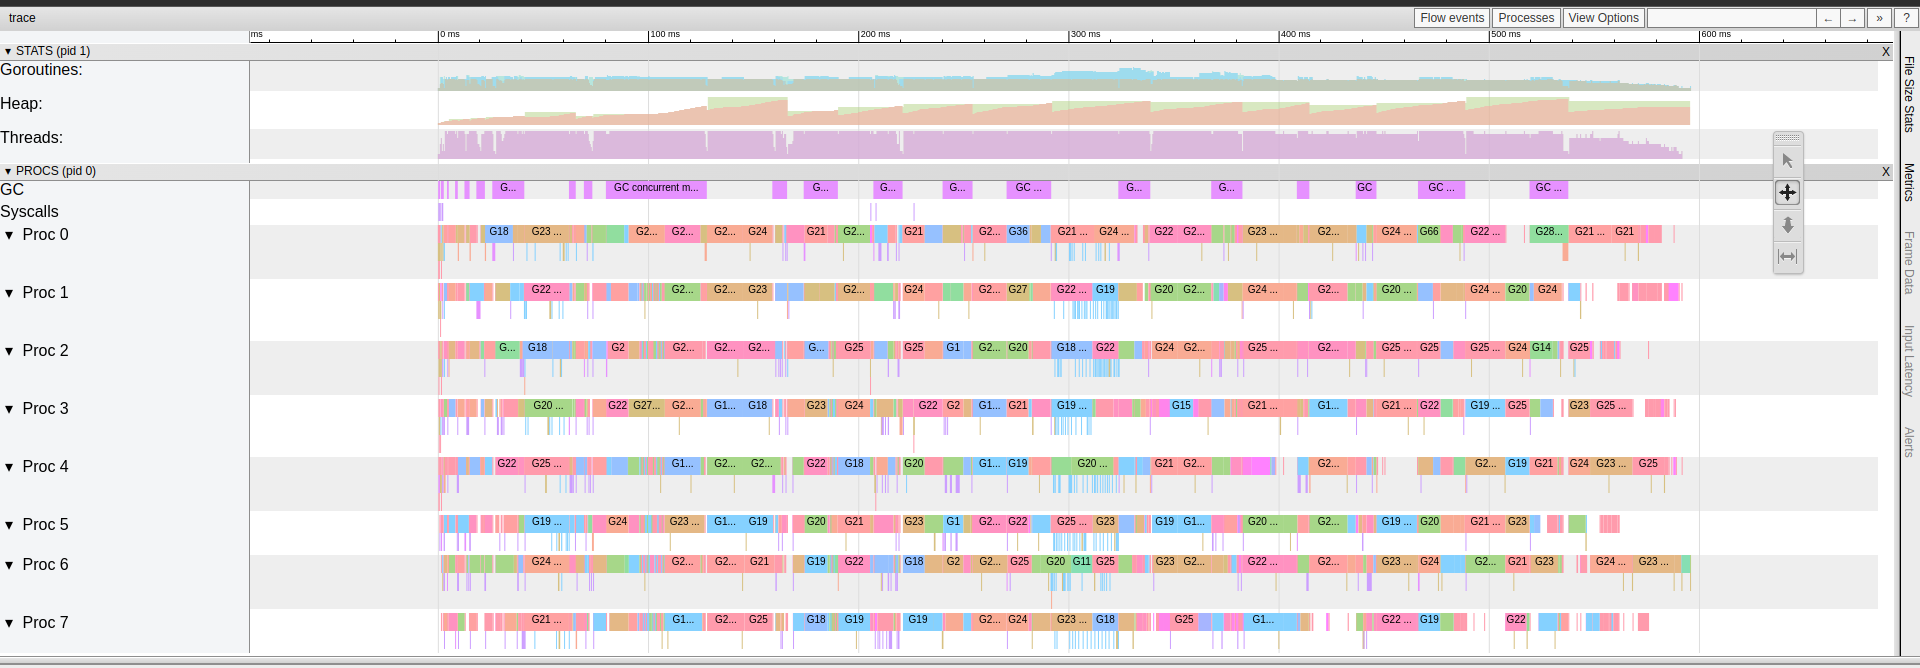
Execution traces were captured using go tool trace to monitor goroutines, worker utilization, and runtime behavior. The following images demonstrate the incremental optimizations:
-
trace1_original.png:
- Initial implementation with suboptimal worker count and inefficient processing. Some workers remain idle, revealing underutilization of CPU cores.(~1200ms)
-
trace2_numCPUworkers.png:
- Optimized worker count using
runtime.NumCPU(). Adding multiple workers forreduceprocessing. This step ensures that the number of workers matches the number of CPU cores for maximum parallel efficiency.(~900ms)
- Optimized worker count using
-
trace3_afterprocfileoptimization.png:
- Improvements in the file processing logic reduced delays and improved worker utilization. Tracing shows fewer idle periods for goroutines.(~800ms)
-
trace4final_readerchunking.png:
- Final optimization using buffered readers with chunking for efficient file reading. Worker performance and CPU usage are further enhanced, as observed in the trace.(~600ms)
By analyzing these profiles and traces, bottlenecks were systematically identified and optimized to improve CPU efficiency, memory management, and overall program performance.
