Plots profiles and CTD sections with Python from NetCDF OceanSITES files
conda install -c conda-forge netCDF4 scipy matplotlib cartopy tomlpip3 install julianmake ctdp
make xbtspython plots.py -h
usage:
python plots.py -t <TYPE> -s (SECTIONS) <OPTIONS> ... | -p (PROFILES) <OPTIONS> ...
PROFILES:
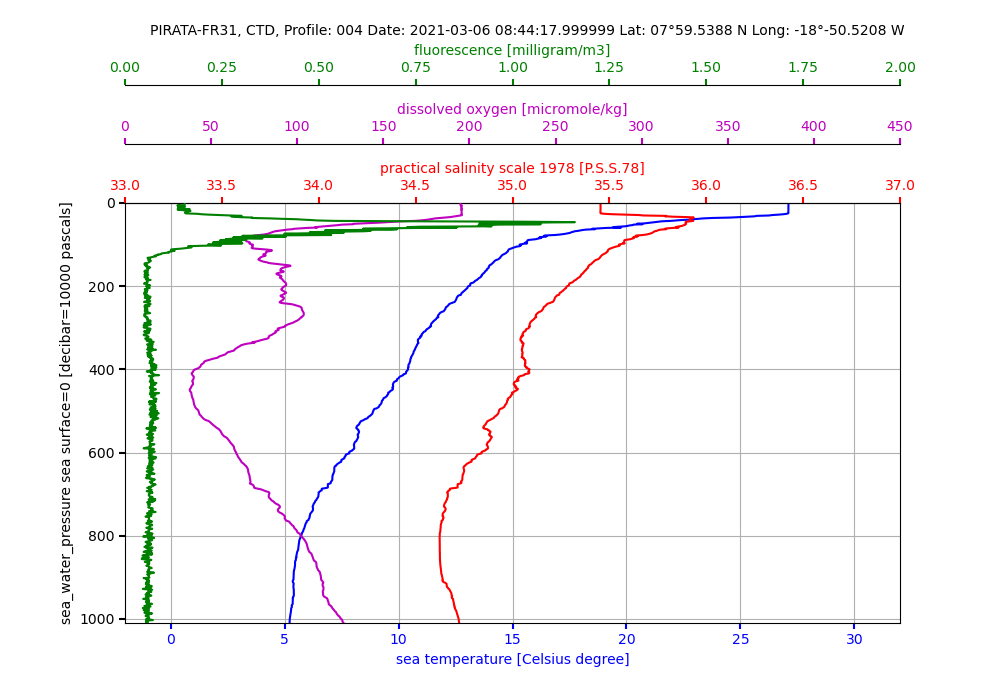
python plots.py netcdf/OS_PIRATA-FR31_CTD.nc -t CTD -p -k PRES TEMP PSAL DOX2 FLU2 -g -c k- b- r- m- g-
python plots.py netcdf/OS_PIRATA-FR31_XBT.nc -t XBT -p -k DEPTH TEMP DENS SVEL -c k- b- k- g- -g
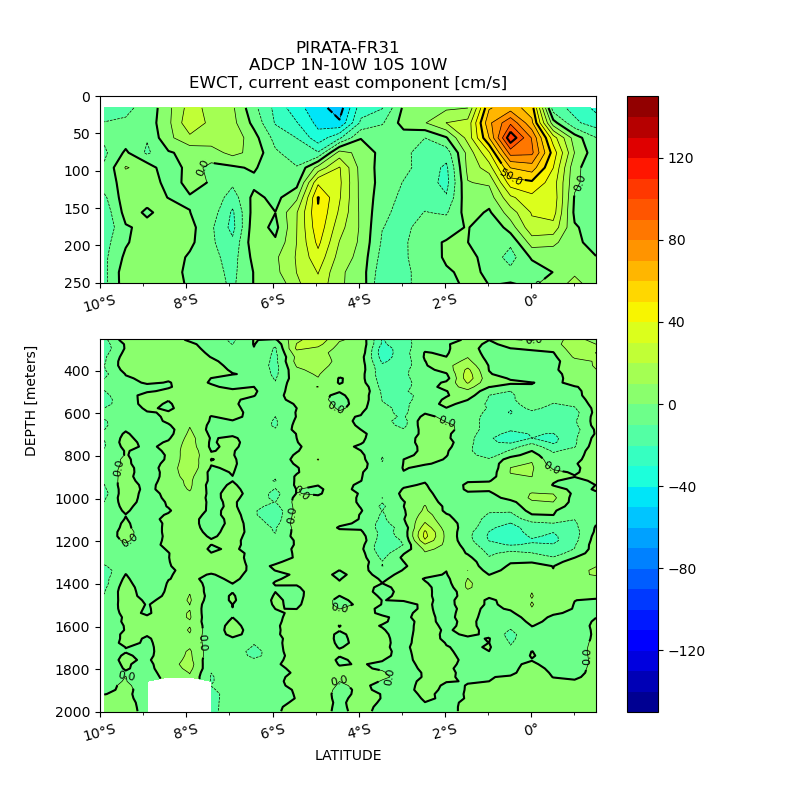
python plots.py netcdf/OS_PIRATA-FR31_ADCP.nc -t ADCP -p -k DEPTH EWCT NSCT -c k- r- b- -g
SECTIONS:
python plots.py netcdf/OS_PIRATA-FR31_CTD.nc -t CTD -s -k PRES TEMP -l 5 28 --xaxis LATITUDE --yscale 0 250 250 2000 --xinterp 24 --yinterp 200 --clevels=30 --autoscale 0 30
python plots.py netcdf/OS_PIRATA-FR31_CTD.nc -t CTD -s --append 1N-10W_10S_10W -k PRES PSAL -l 5 28 --xaxis LATITUDE --yscale 0 250 250 2000 --xinterp 24 --yinterp 100 --clevels=15 --autoscale 34 37
python plots.py netcdf/OS_PIRATA-FR31_ADCP.nc -t ADCP -s --append point-fixe_0-10W -k DEPTH EWCT NSCT -l 33 45 --xaxis TIME --yscale 0 500 --xinterp 20 --yinterp 50 --clevels 15 --autoscale -150 150
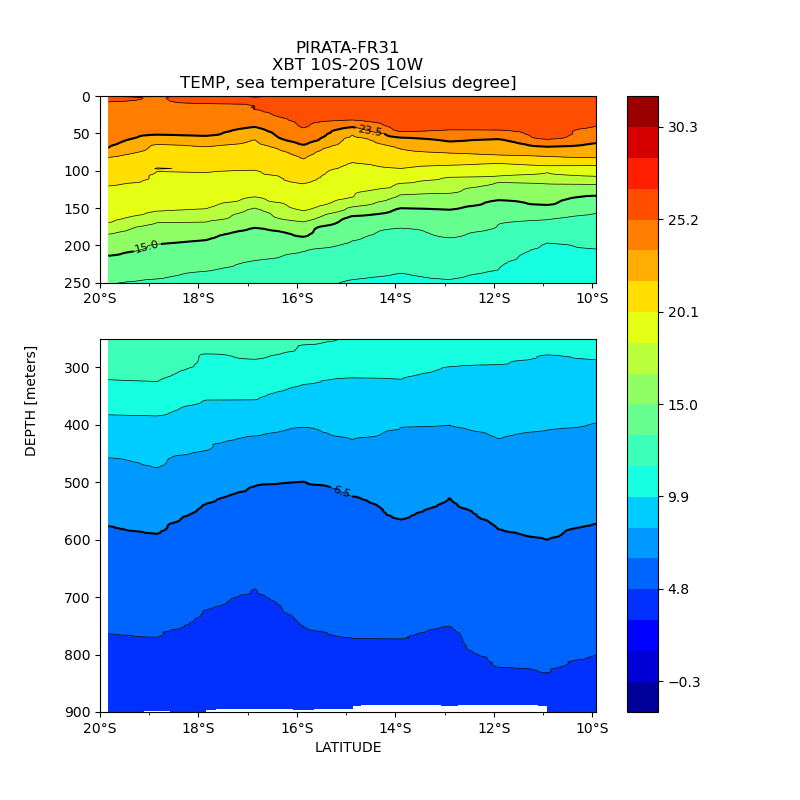
python plots.py netcdf/OS_PIRATA-FR31_XBT.nc -t XBT -s DEPTH TEMP -xaxis LATITUDE
python plots.py netcdf/OS_PIRATA-FR31_XBT.nc -t XBT -s DEPTH TEMP -xaxis TIME -l 29 36
This program read CTD NetCDF file and plot parameters vs PRES
positional arguments:
files netcdf file to parse
optional arguments:
-h, --help show this help message and exit
-a APPEND, --append APPEND
string to append in output filename
-t {CTD,XBT,ADCP}, --type {CTD,XBT,ADCP}
select type instrument CTD, XBT or LADCP
-p, --profiles, --profile
plot profiles
-k KEYS [KEYS ...], --keys KEYS [KEYS ...]
select physical parameters key(s), (default: None)
-l LIST [LIST ...], --list LIST [LIST ...]
select first and last profile, default (none) is all
-e [EXCLUDE [EXCLUDE ...]], --exclude [EXCLUDE [EXCLUDE ...]]
give a list of profile(s) to exclude
-c COLORS [COLORS ...], --colors COLORS [COLORS ...]
select colors, ex: k- b- r- m- g-
-g, --grid add grid
-s, --sections, --section
plot sections
--xaxis {LATITUDE,LONGITUDE,TIME}
select xaxis for sections
--yscale [YSCALE [YSCALE ...]]
select vartical scale for sections, ex: 0 2000 or 0 250 250 2000
--xinterp XINTERP horizontal interpolation points
--yinterp YINTERP vertical interpolation step, none plot raw data
--clevels CLEVELS contour levels
--autoscale [AUTOSCALE [AUTOSCALE ...]]
None: use NetCDF valid min and max
True: use min(Z) and max(Z)
[min, max]: define manually min and max
--display, --display_profiles
display profiles number on top axes
-o OUT, --out OUT output path, default is plots/
-d, --debug display debug informations
J. Grelet IRD US191 - March 2021 / April 2021See the shell script used in PIRATA-FR31 cruise launch with cron job:


