The research project mainly focuses on the detection of glaucoma in the retinal fundus images through the means of Cup to Disc Ratio(CDR), Disc Damage Likelihood Scale(DDLS) and the ISNT rule.
Glaucoma is a retinal disease caused due to increased intraocular pressure in the eyes. It is the second most dominant cause of irreversible blindness after cataract, and if this remains undiagnosed, it may become the first common cause. Ophthalmologists use different comprehensive retinal examinations such as ophthalmoscopy, tonometry, perimetry, gonioscopy and pachymetry to diagnose glaucoma. But all these approaches are manual and time-consuming. Thus, a computer-aided diagnosis system may aid as an assistive measure for the initial screening of glaucoma for diagnosis purposes, thereby reducing the computational complexity. This paper presents a deep learning-based disc cup segmentation glaucoma network (DC-Gnet) for the extraction of structural features namely cup-to-disc ratio, disc damage likelihood scale and inferior superior nasal temporal regions for diagnosis of glaucoma. The proposed approach of segmentation has been trained and tested on RIM-One and Drishti-GS dataset. Further, based on experimental analysis, the DC-Gnet is found to outperform U-net, Gnet and Deep-lab architectures.
(i) DRISHTI-GS: The dataset comprises of 101 retinal fundus images with 30 normal images and 71 glaucomatous images acquired using a retinal fundus camera. The ground truth for comparison of implemented approaches comprises of the ‘normal/abnormal’ labels and soft segmented maps of ‘disc/cup’ generated by the researchers of the IIIT Hyderabad in alliance with Aravind eye hospital in Madurai, India. It also includes a .txt file for each retinal image comprising of CDR values, which is a significant diagnostic parameter for glaucoma. Further, the images in the data repository are gathered from people of varying age groups visiting the hospital, with images acquired under varying brightness and contrast. Link to dataset: (https://cvit.iiit.ac.in/projects/mip/drishti-gs/mip-dataset2/Home.php)
(ii) RIM-One: This dataset comprises of 166 retinal fundus images with labels “glaucoma” or “non-glaucoma” followed by ground truth of cup and disc. The images in the dataset are acquired under different brightness and contrast using Nidek AFC-210 retinal fundus camera. It includes 92 normal images and 74 abnormal images (glaucoma/suspect).
The approach used for the detection of glaucoma relies on precise segmentation of optic disc and optic cup. The fundus images available in the dataset were too large to be directly fed into the convolutional network; hence, cropping was used to reduce the size of the image. Further, as the training of network requires a large number of data, augmentation was performed to increase the number of images in the dataset. The images were then split into red, green and blue channels. Red channel was used for the segmentation of the optic disc due to better visibility of optic disc in the red channel as compared to green and blue channels. Whereas the blue channel was used for the segmentation of the optic cup due to the highest contrast of optic cup boundaries in this channel as compared to green and red channels. Thereafter, the images were fed into the CNN model as input and were trained to segment the optic disc and optic cup while passing through the different convolutional layers. Finally, the values of CDR, DDLS and ISNT were computed for diagnosis.
In order to speed up the process, autocropping was applied using the segmented disc from DC-Gnet.
The augmentation techniques used are shown in the figure below
The methodology of the project is shown in the figure below:
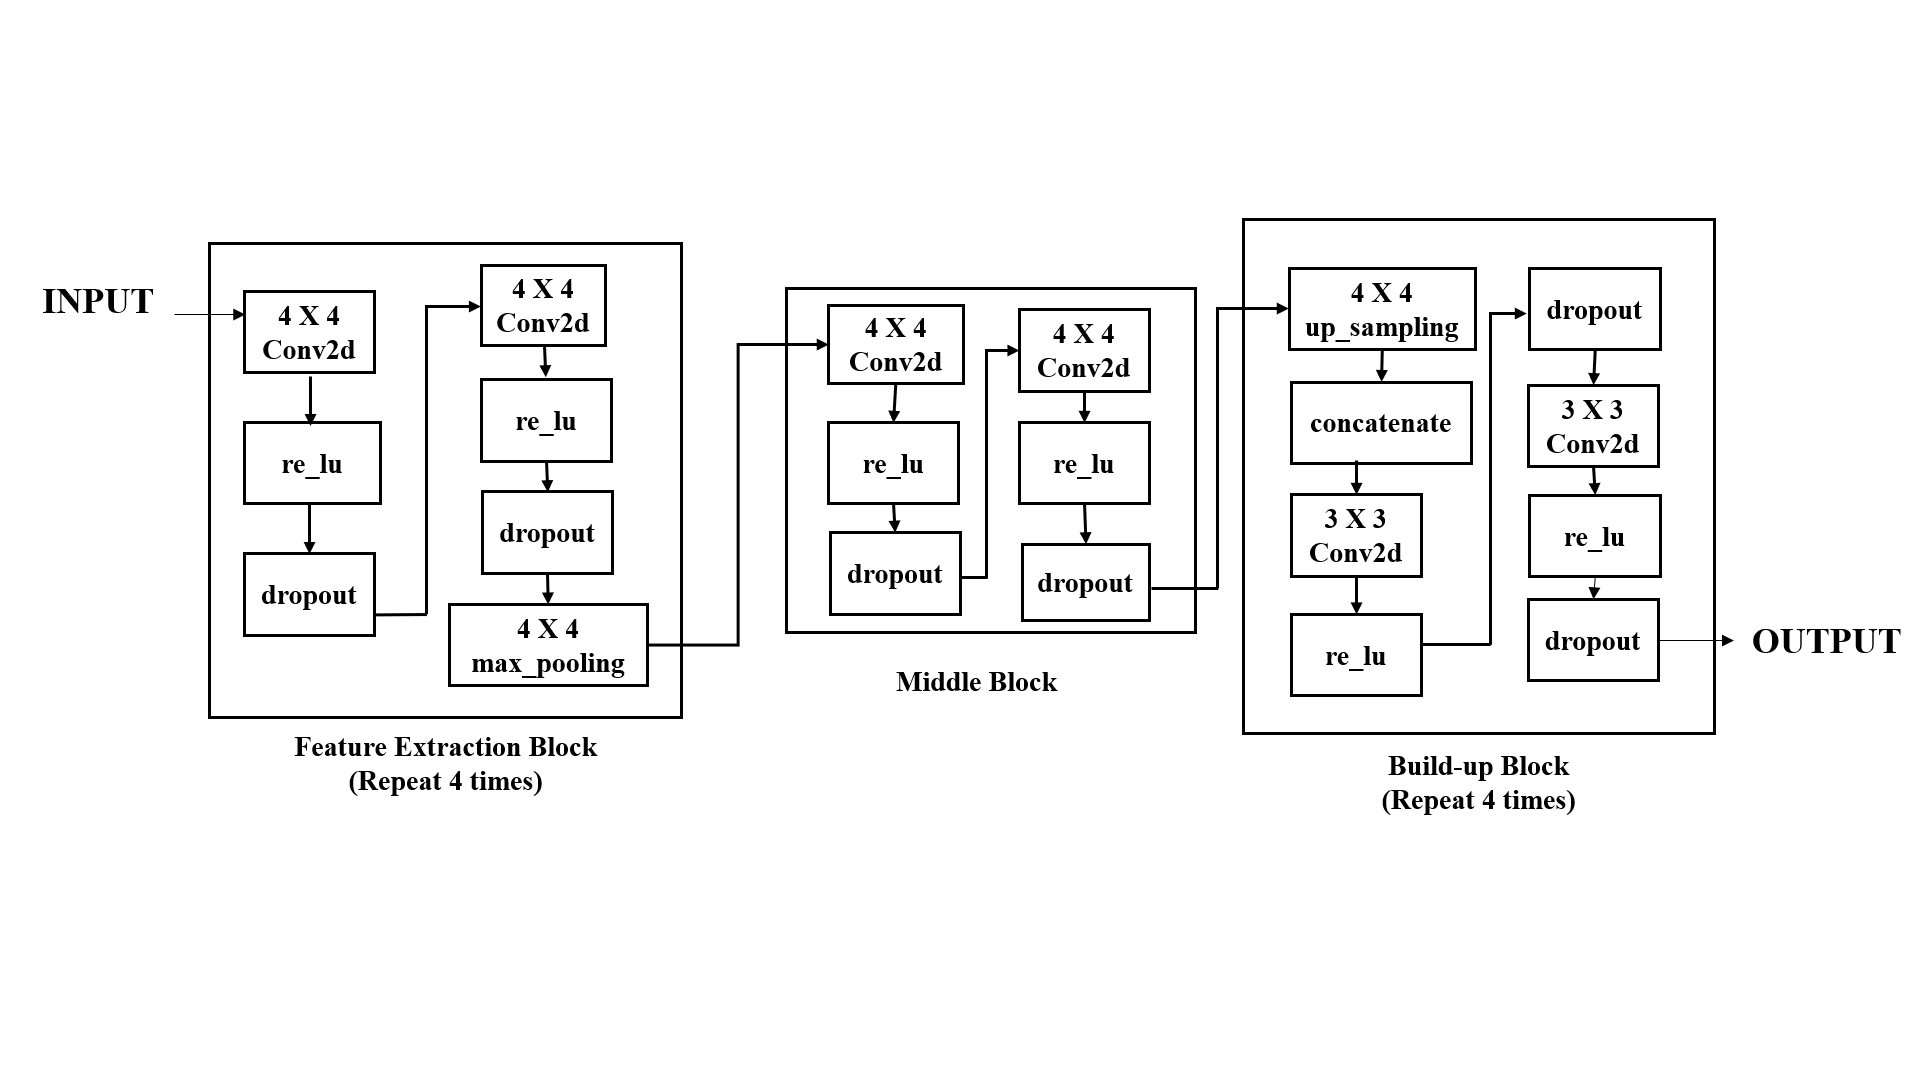
The figures below show our model architecture. Our model is the modified version of G-Net and is able to perform better than state of the art architectures like U-Net and Deeplab.
The block diagram of our model is shown below:

The model is able to successfully segment the optic disc and cup as shown in the figure below:

The segmented optic disc and cup were then used to trace the boundary and calculate the CDR, DDLS and ISNT values.


