Putting all of your money under the mattress is never a good choice. The goal of Inbestment is to help individuals easily come up with a financial plan and determine the amounts to fund each account. Using the Intuit Customer Account Data API, users are able to import real banking account information to their profiles. Inbestment uses relational database modeling and large datasets to provide a recommended investment portfolio based on risk tolerance and graphically present performance over time. Users can also compare other stock's performance to their portfolio.
Intuit Customer Account Data API, Quandl API Python, SQL, SQLAlchemy, Flask, Flask-Login, Flask-WTF, Python Passlib, Python Aggcat (client for Intuit API), Python unittest Jinja, Highcharts, Javascript, jQuery, HTML, CSS- controller.py: Main entry point and controls application routing
- utils.py: Utility functions for calculating large operations outside of controller.py
- model.py: Creates the local database model
- seed.py: Seeds the local database and allows use of Quandl API
- accounts.py: Allows use of Intuit API
- Allows user to add real banking information through the use of the Intuit Customer Account Data API and the Python aggcat client
- Passes the institution id for select institutions into the API call to pull account data (account number and balance amount)
- Creates a route to authenticate challenge scenarios
- If an account is being validated for the first time, the API may come back with the bank's challenge question to force additional user validation
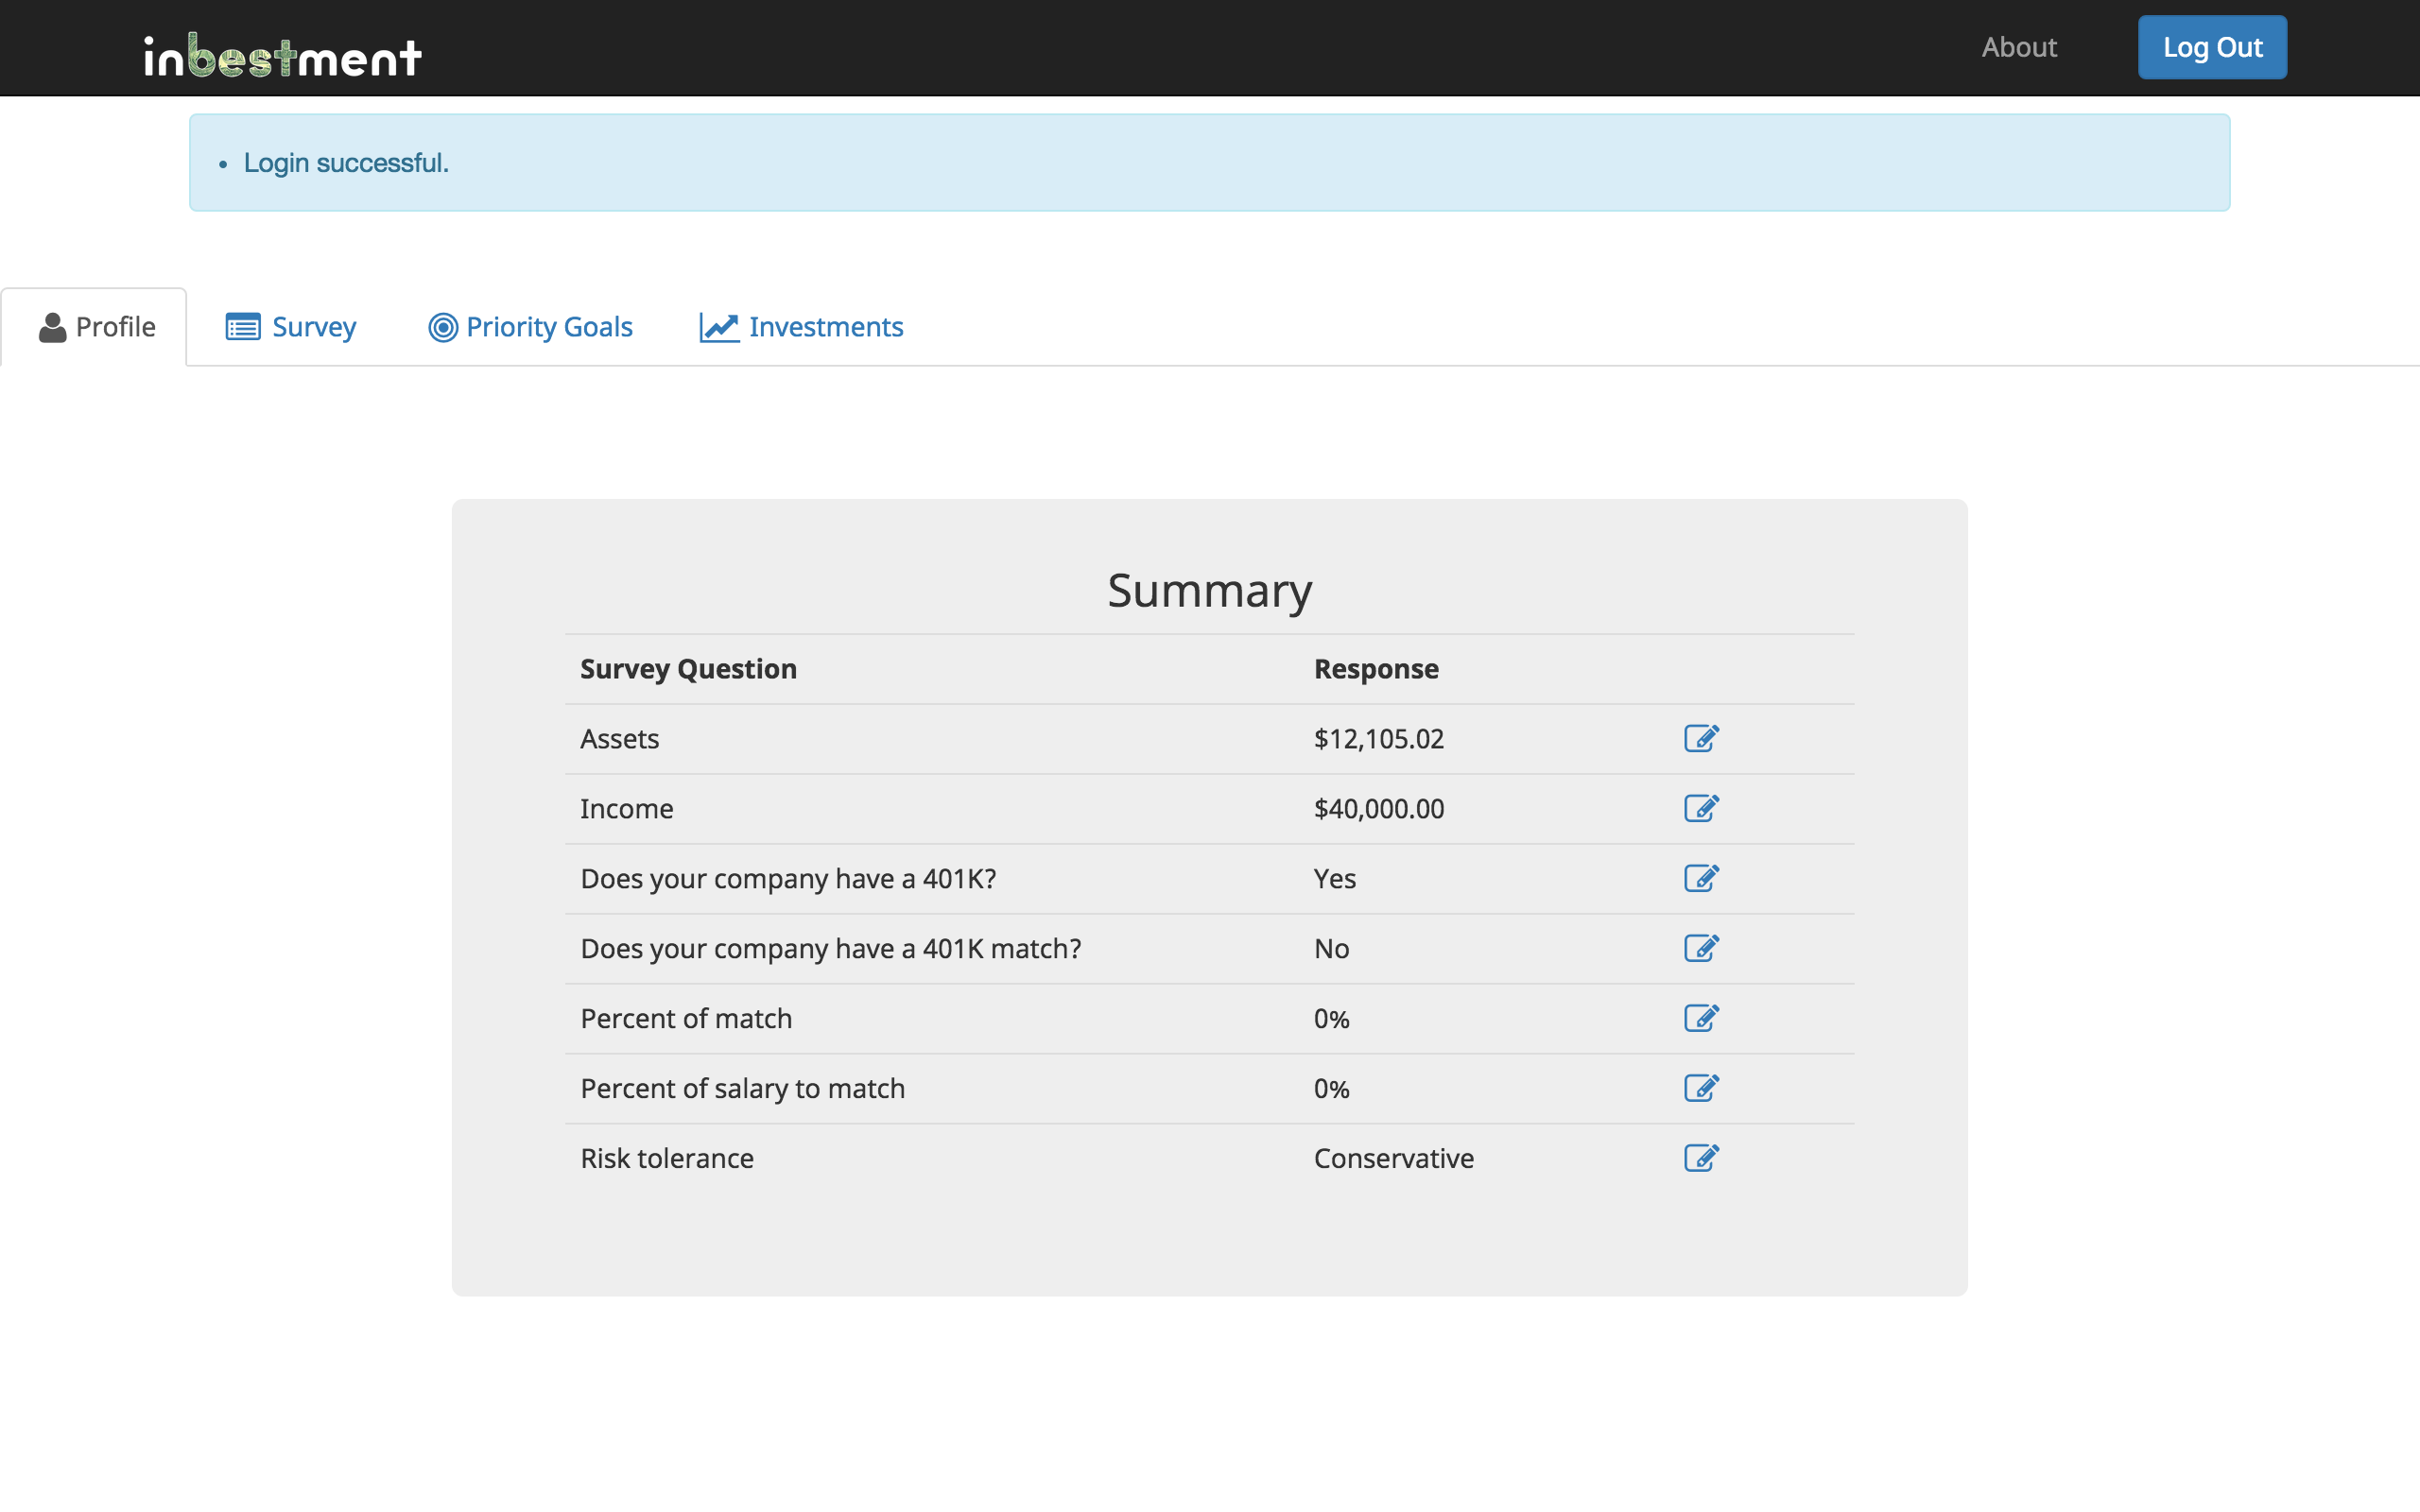
- User can easily get results based on a maximum of seven questions
- Values are updated to the database after each question allowing for a responsive survey (ex: if user answers that there is no 401k account, then disable and skip all-401K related questions)
- Profile saves all user inputs and shows it within the survey input field, allowing the user to easily edit any response
- Includes tooltips to assist the user in answering some of the questions
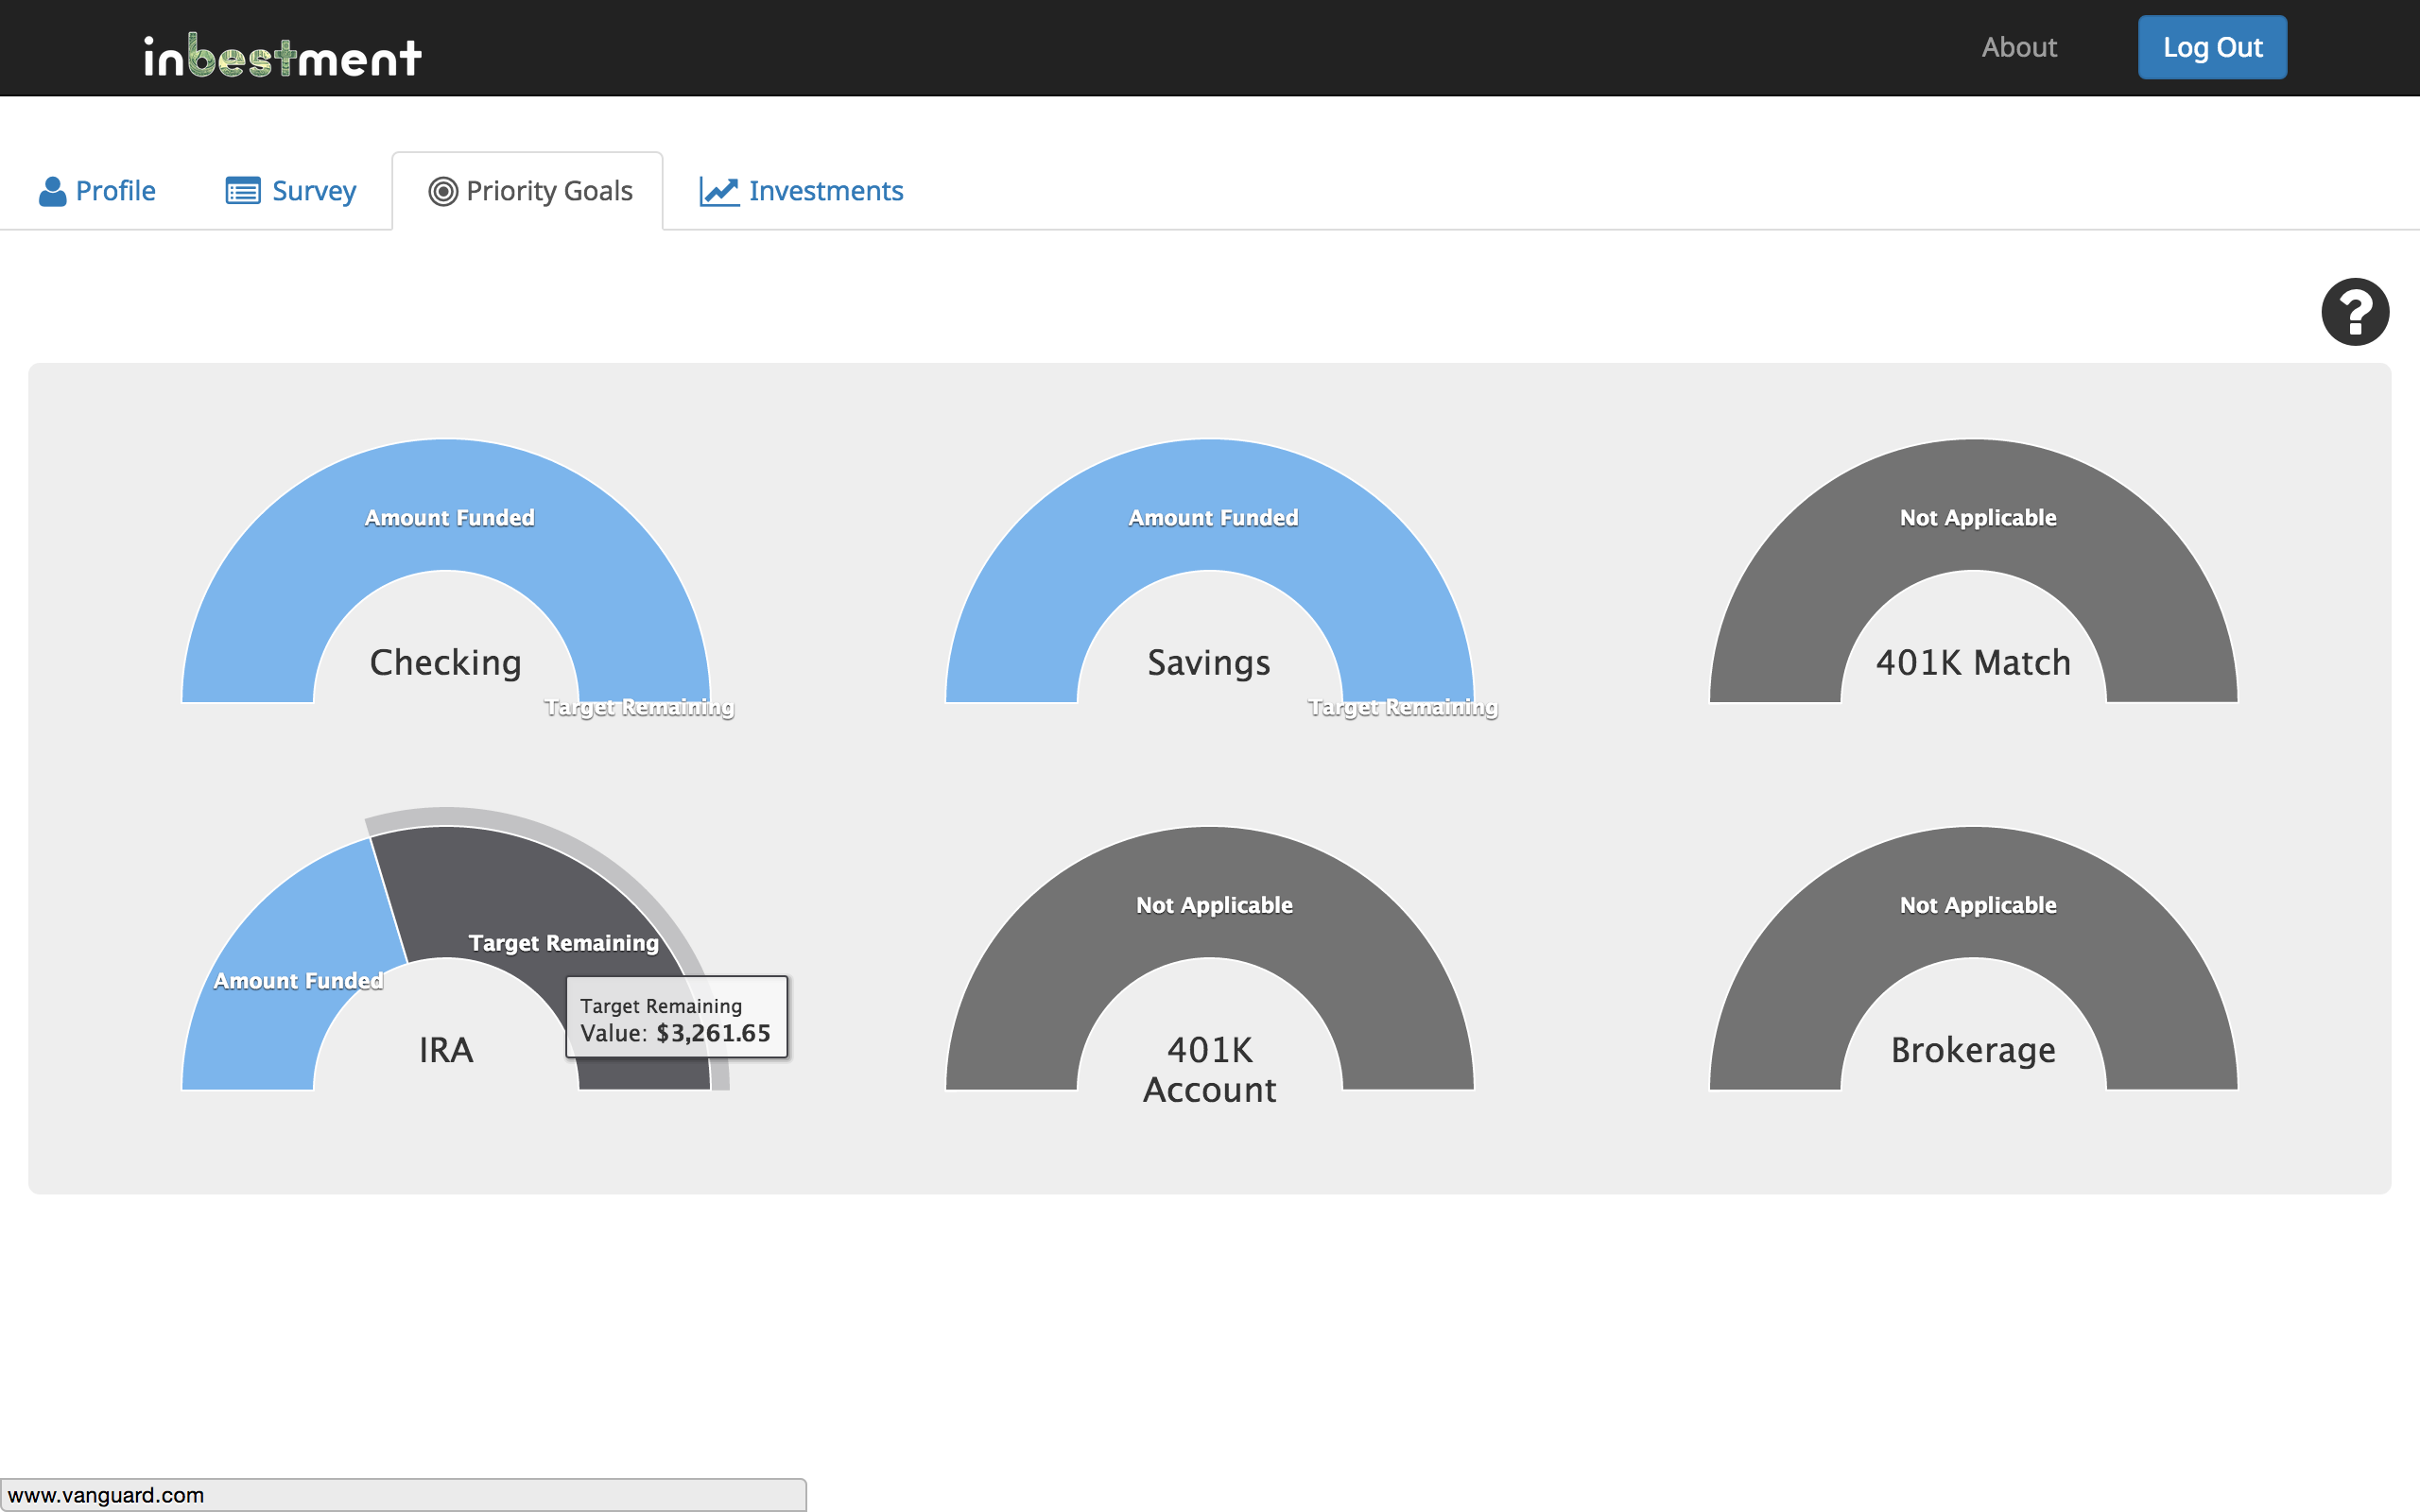
- Determines the target amount for each type of account and checks that against the user's assets
- Creates a flow through a hierarchy of accounts
-
- Checking - one month worth of living expenses, calculation based on user income
-
- Savings - three months worth of living expenses, calculation based on user income
-
- 401K match - (if applicable), calculation based on user percent match and percent of salary to match
-
- IRA - maximum $5,500 IRS contribution
-
- 401K - (if applicable), maximum $18,000 IRS contribution less 401K match
-
- Brokerage - remaining assets
-
- Includes modal to assist the user in interpreting their financial results
- Seeds the database with stock tickers and daily close prices using the Quandl API
- Uses raw SQL query to calculate the percent change for each individual date's close price compared to the inception's close price
- See "Technical Choices" on calculating portfolio performance
- Uses Highcharts (Javascript and jQuery) to pass JSON data objects
- Parses Quandl API JSON object for "stock" or "bond" to give the ticker a classification
- Implementes the ability for the user to input a ticker for comparison
- Checks a .csv file for the ticker's url identifier
- Calls the Quandl API to return the pricing information
- Saves the ticker's information and calculated percent change in the database
- Future requests for that ticker will pull straight from the database, rather than making another API call
- Creates a detailed data model leveraging cross-tables relationships
- Employes raw SQL and SQLAlchemy to query the database across relationships

(Data model created with Vertabelo)
- Encrypts and verifies user passwords through hashing and salting
- Uses Python Passlib and PBKDF2_SHA512 hash algorithm
- Checks back-end data validity using Flask-WTF and front-end using HTML fields, so the user is not able to input non-integers for assets and income or invalid email and password
- All routes use Flask-g to ensure the following scenarios:
- A user who is not logged in will be directed to the login page
- A user who is logged in but has not completed the survey will be directed to completing the survey before accessing any other route
- Integrates unit tests and Flask integration tests
- Unit tests check that the results calculation is working properly depending on various user inputs
- Flask integration tests ensure that all routes are working when user is logged in or logged out
- Checks Python files in PEP8 style guide for formatting consistency
- Strong workflow and bug tracking using Git to create issues and hunking commits with detailed messages
Since stock prices are relative, I could not add the daily prices for each ticker together. I initially decided to normalize the data by calculating a daily percent change from the day before, but this resulted in an undynamic line graph. Then, I decided to still calculate a daily percent change, but since inception. This resulted in a more dynamic and interesting line graph. However, a stock ticker that has 10% growth since inception 10 years ago cannot be accurately compared to another stock ticker that has 20% growth since inception 5 years ago.
Another option I considered would be to annualize the returns, but I would lose some fidelity when displaying the data in a line graph with less data points. I decided to take the latest inception date of all of my stock tickers in the risk tolerance portfolios (4/10/2007) and mark that as the since inception date for all percent changes to be calculated off of.
At this point, I could now aggregate the percent change of the stock tickers for each daily data point. Since each stock ticker comprises a different weighting in the portfolio, I used a weighted average to calculate the aggregate percent change.
As an example, for the "Conservative" risk profile and one day's data point:
| Stock Ticker | Portfolio Weighting | Percent Change (since inception) |
|---|---|---|
| VV | 25% | 0.01 |
| VB | 20% | 0.02 |
| VEU | 5% | 0.03 |
| BIV | 40% | 0.04 |
| BSV | 10% | 0.05 |
One day's aggregated performance (weighted average) =
(0.25 * 0.01) + (0.20 * 0.02) + (0.05 * 0.03) + (0.40 * 0.04) + (0.10 * 0.05)
My original query was a nested loop using SQLAlchemy that resulted in the line graph taking 18+ seconds to generate. By changing to a raw SQL query, I was able to have a much more powerful query that resulted in an instanteous response:
linegraph_sql_query = """
    SELECT date, sum(percent_change * prof_allocs.ticker_weight_percent)
    FROM prices
    JOIN prof_allocs on (prices.ticker_id = prof_allocs.ticker_id)
    WHERE prof_allocs.risk_profile_id == :sql_risk_prof
    AND prices.date > "2007-04-10"
    GROUP by prices.date
    ORDER by prices.date
    """
- Short-term plans can be found in my github Issues
- Improve methodology of determining total portfolio performance by taking a stock ticker's real inception date and still allowing apples-to-apples comparison
- Use machine learning to estimate user's assets, income, and company 401K information (to limit number of user inputted fields)
- More customizations and options in risk tolerance portfolios
- Allow user to input all assets from multiple sources (current accounts and investments) and re-allocates their portfolio to Inbestment's recommendation
-
Clone this repo
-
Create and activate a new, empty virtual environment
virtualenv env
source env/bin/activate -
Use pip to install the packages required in requirements.txt
pip install -r requirements.txt -
Initialize account with the Intuit Customer Account Data API and put the following keys in
intuit_tokens.txtin this order:-
- OAuth Consumer Key
-
- OAuth Consumer Secret
-
- SAML Identity Provider ID
-
-
Initialize account with the Quandl API and put the key in
quandl_tokens.txt -
Put the Flask secret key in
flask_tokens.txt -
Start the application by running
controller.py -
Navigate to http://localhost:5000 and start exploring the app
Copyright (c) 2015 Alice Tsao
Permission is hereby granted, free of charge, to any person obtaining a copy of this software and associated documentation files (the "Software"), to deal in the Software without restriction, including without limitation the rights to use, copy, modify, merge, publish, distribute, sublicense, and/or sell copies of the Software, and to permit persons to whom the Software is furnished to do so, subject to the following conditions:
The above copyright notice and this permission notice shall be included in all copies or substantial portions of the Software.
THE SOFTWARE IS PROVIDED "AS IS", WITHOUT WARRANTY OF ANY KIND, EXPRESS OR IMPLIED, INCLUDING BUT NOT LIMITED TO THE WARRANTIES OF MERCHANTABILITY, FITNESS FOR A PARTICULAR PURPOSE AND NONINFRINGEMENT. IN NO EVENT SHALL THE AUTHORS OR COPYRIGHT HOLDERS BE LIABLE FOR ANY CLAIM, DAMAGES OR OTHER LIABILITY, WHETHER IN AN ACTION OF CONTRACT, TORT OR OTHERWISE, ARISING FROM, OUT OF OR IN CONNECTION WITH THE SOFTWARE OR THE USE OR OTHER DEALINGS IN THE SOFTWARE.


