This is a simulation of basic features of a Finance System. This Architecture has all the feature which should be available in a Cloud Native, Distributed architecture.
- Become Customer
- Open Account
- Send money to another customer
- Take loan
- Customer Service - Done
- Account Service - Done
- Payment Service - Done
- Messaging Layer - Done
- Create Maven module for different service - DONE
- Create Customer Service - DONE
- Create Account Service - DONE
- Create Payment Service - DONE
- Payment fail if messaging layer is not available
- If accounts is not available payments events should be cached and replayed when account is available
- Loan Service
- Using DTO
- MapStruct
- Using lombok with mapstruck
- Spring Configuration properties
- Application Monitoring using Prometheus and Grafana
- Api Testing with Rest Assured
- Rest input Validations
- Logging
- Tracing
- Dockerize each service
- Db and Redis in its own container
- Docker compose
- Kubernets
- Authentication
- Jwt token
- Casandra
- Deploy the services on Azure
- Implement Circuit breaker
- Error Handling
- Integration Adapter, Configuration
- Use Flyway
- Service Discovery
- Load Balancing
- Configuration Management
- Data and state management
- Log Aggregation
- Distributed Tracing - Zipkin
- Fault and Latency tolerance - Circuit Breaker, Hystrix
- Edge Service
- Auto Scaling
- Feature Toggle - ff4j, togglz
- Health Check - Spring boot actuator
- Monitoring Dashboard
Currently services can either be run standalone or as docker containers
- config-server
- messaging-layer
- account
- customer
- payment
mvn clean install -Ddocker-build
docker run config-server -p8085:8085docker run messaging-layer -p8085:6379docker run accounts -p8085:8081docker run customer -p8085:8083docker run payment -p8085:8082
https://documenter.getpostman.com/view/3772012/SVSKKnyZ?version=latest
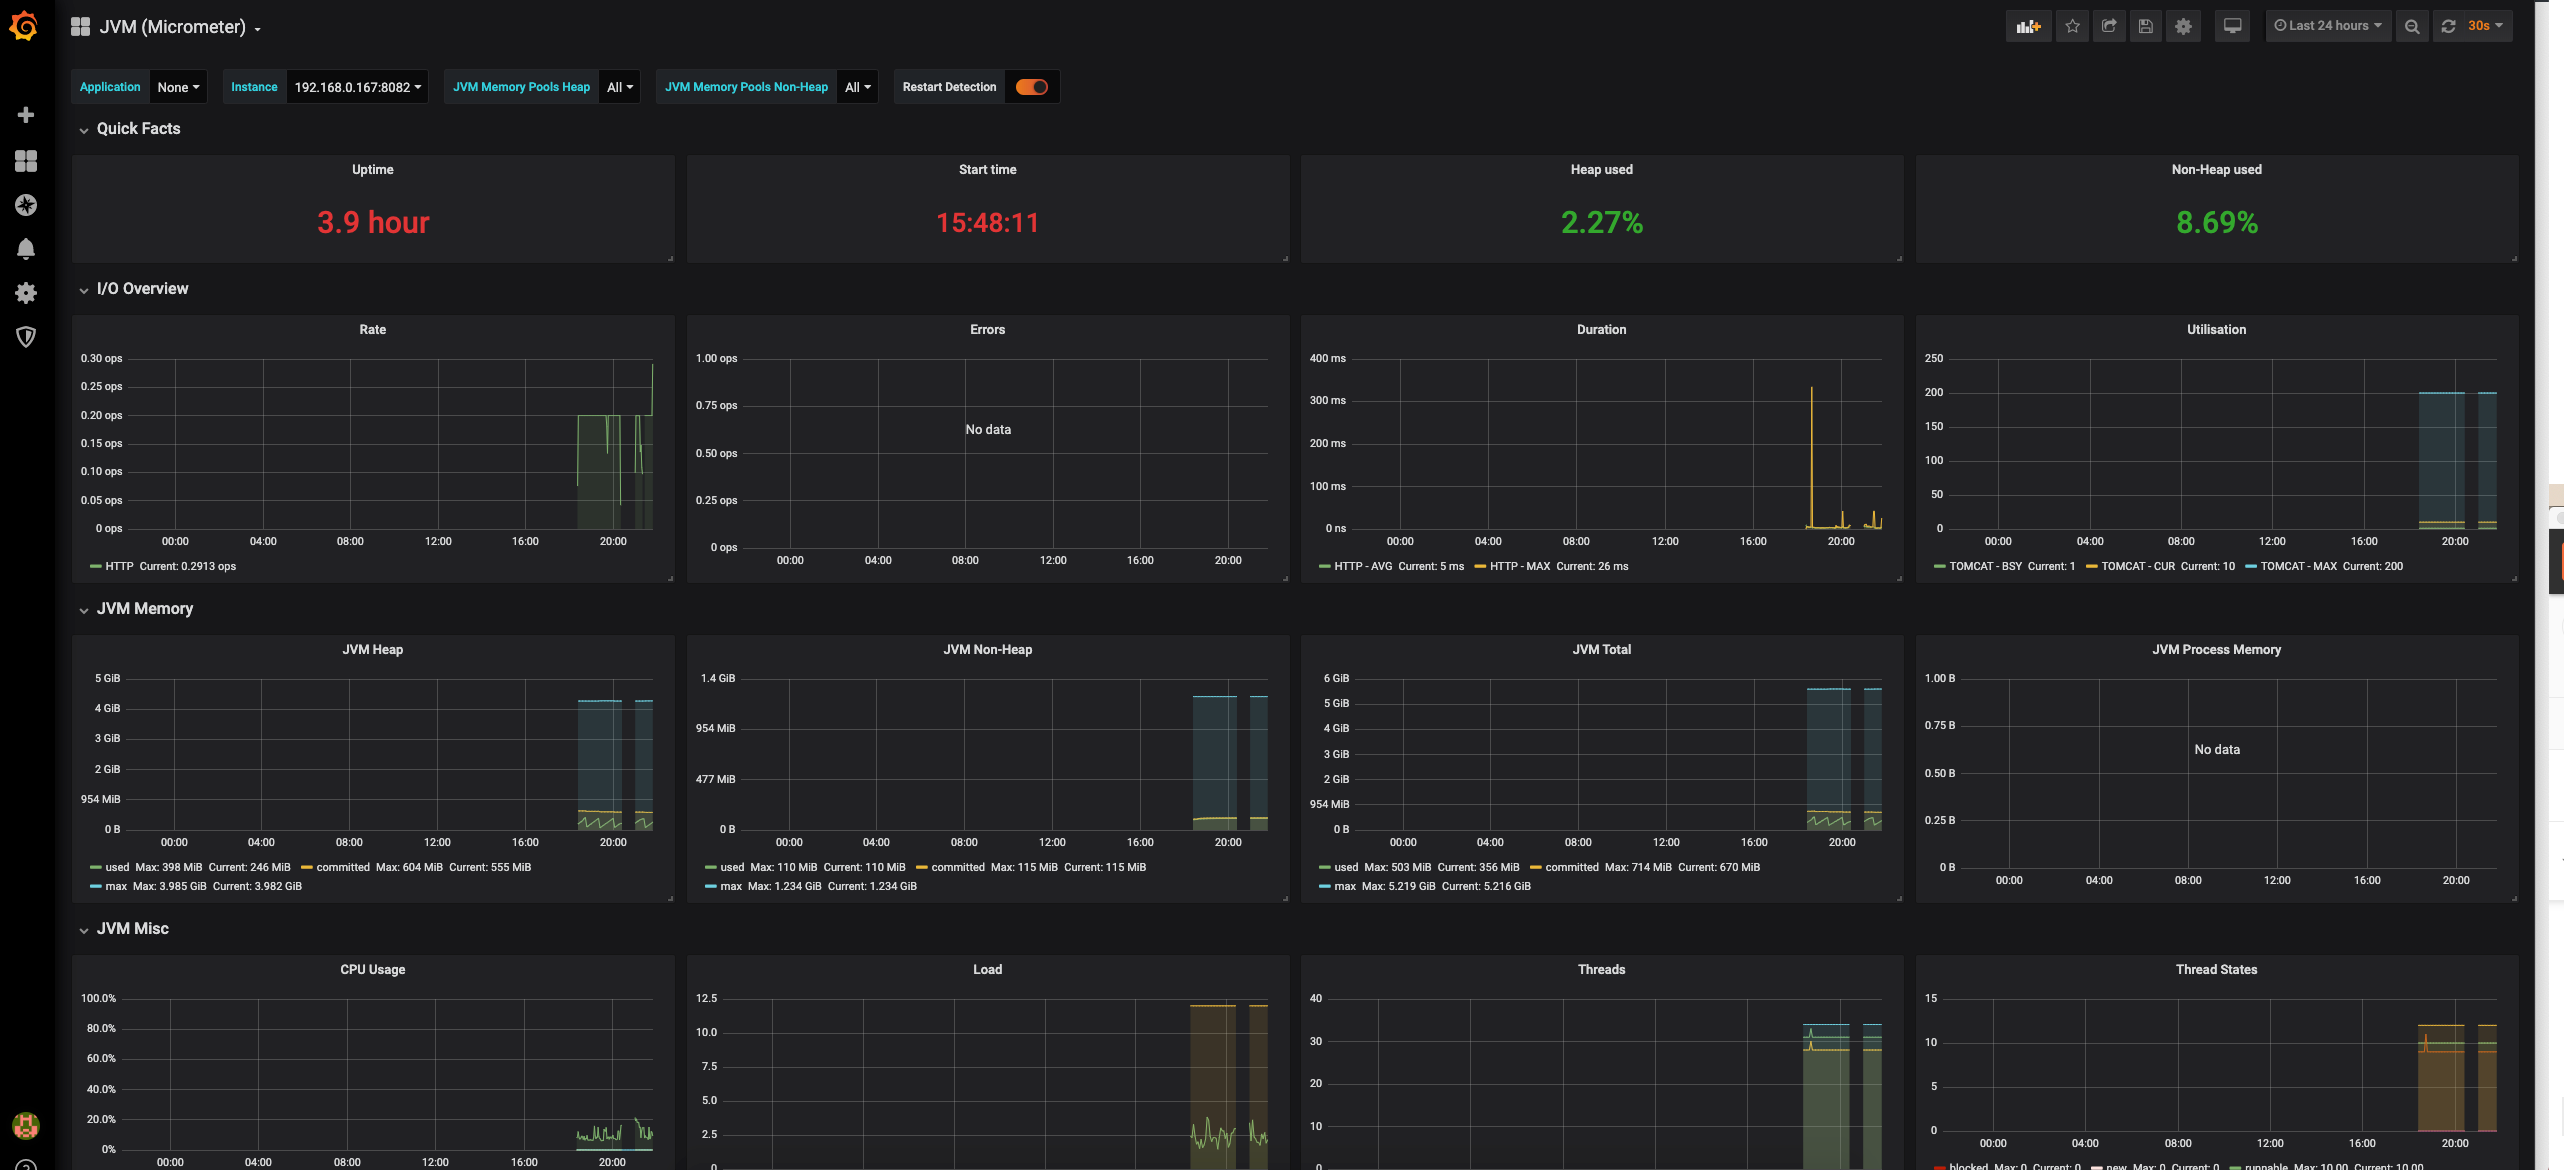
Application Monitoring for this Finance System is done using Prometheus and Grafana. Different metrics from all the service is exposed and periodically scraped by Prometheus.
Grafana is used to visualize these metrics. More details can be found at Application Monitoring
