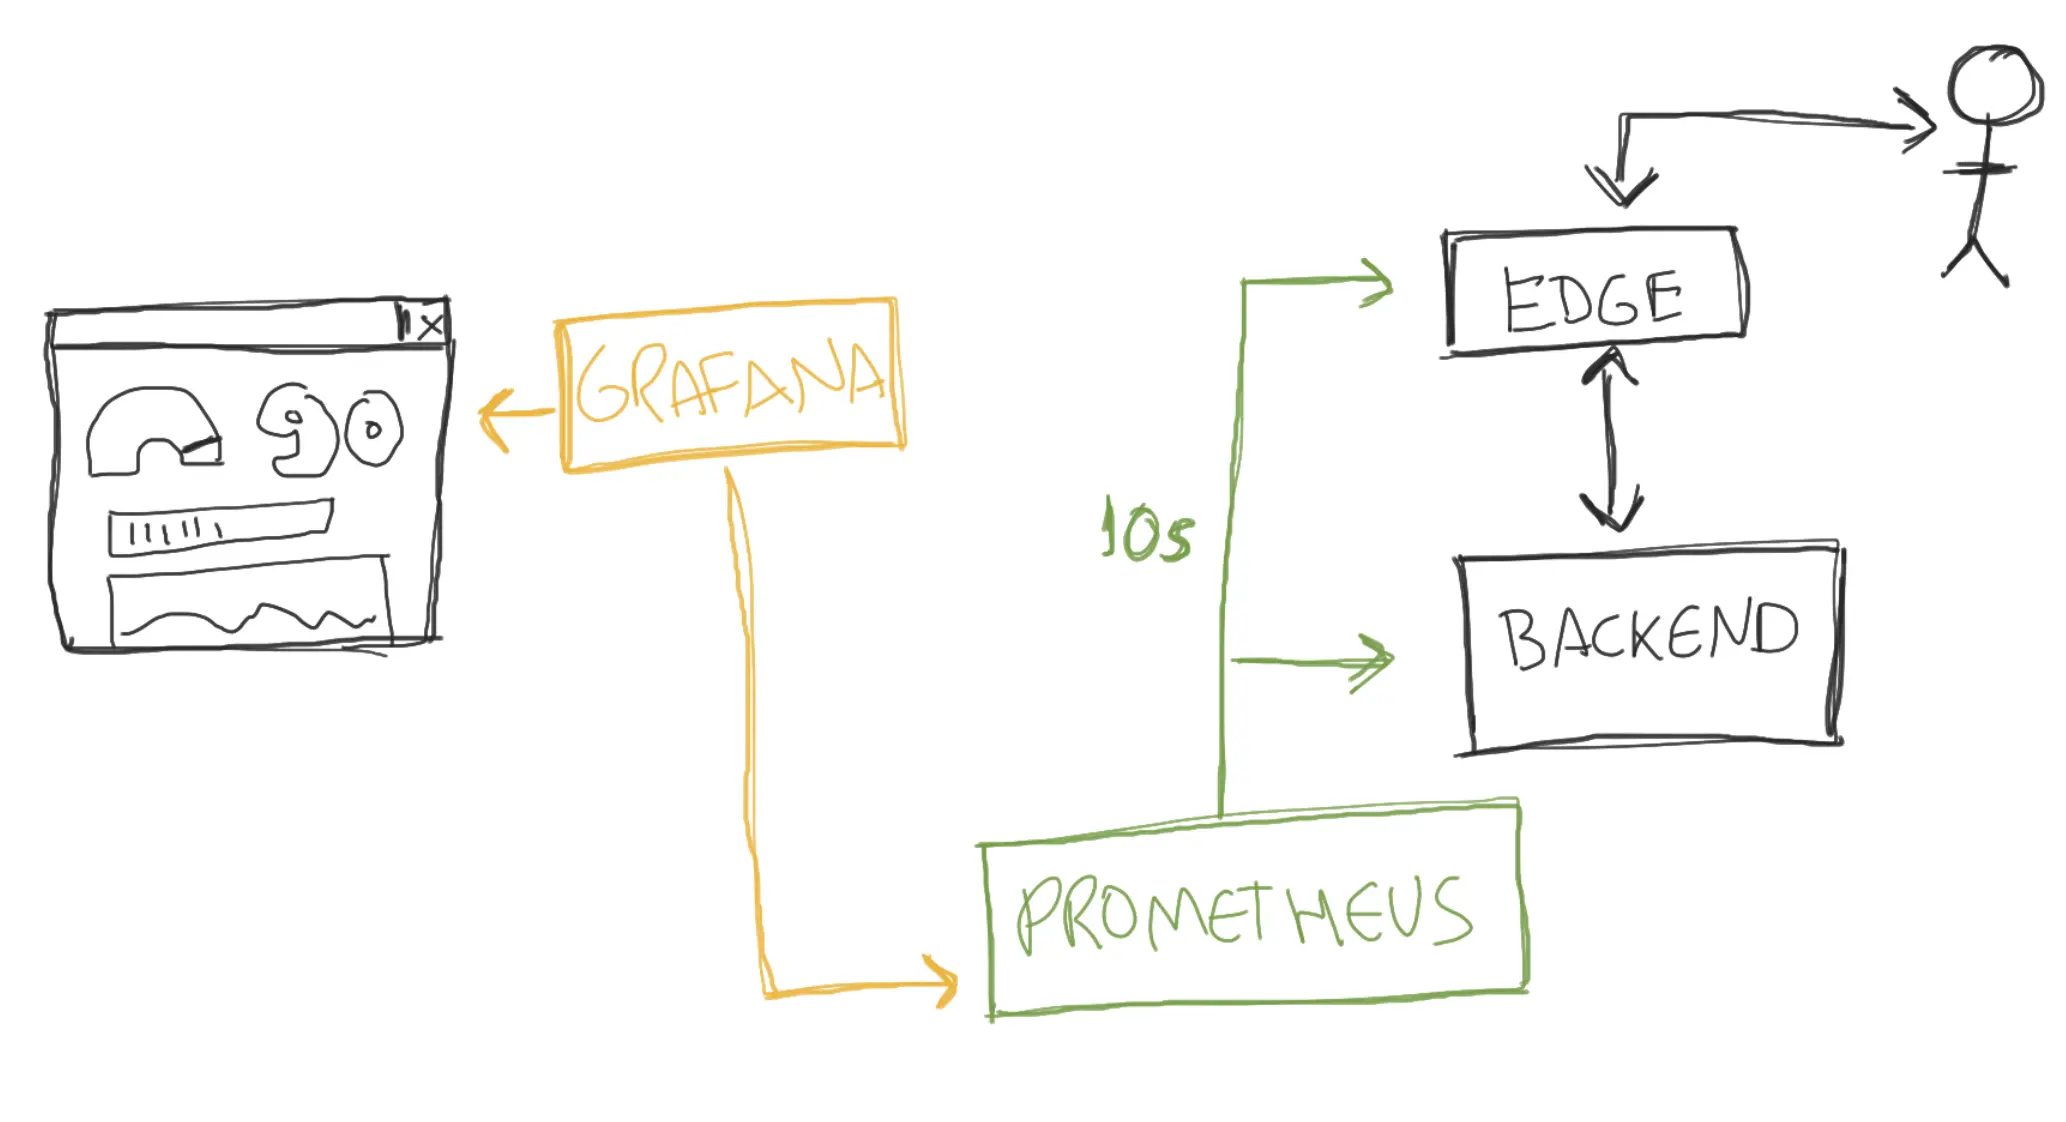
The objective of this repo is to build a body of knowledge on how CDNs work by coding one from "scratch". The CDN we're going to design uses: nginx, lua, docker, docker-compose, Prometheus, grafana, and wrk.
We'll start creating a single backend service and expand from there to a multi-node, latency simulated, observable, and testable CDN. In each section, there are discussions regarding the challenges and trade-offs of building/managing/operating a CDN.
A Content Delivery Network is a set of computers, spatially distributed in order to provide high availability and better performance for systems that have their work cached on this network.
A CDN helps to improve:
- loading times (smoother streaming, instant page to buy, quick friends feed, etc)
- accommodate traffic spikes (black friday, popular streaming release, breaking news, etc)
- decrease costs (traffic offloading)
- scalability for millions
CDNs are able to make services faster by placing the content (media files, pages, games, javascript, a json response, etc) closer to the users.
When a user wants to consume a service, the CDN routing system will deliver the "best" node where the content is likely already cached and closer to the client. Don't worry about the loose use of the word best in here. I hope that throughout the reading, the understanding of what is the best node will be elucidated.
The CDN we'll build relies on:
Linux/GNU/Kernel- a kernel / operating system with outstanding networking capabilities as well as IO excellence.Nginx- an excellent web server that can be used as a reverse proxy providing caching capability.Lua(jit)- a simple powerful language to add features into nginx.Prometheus- A system with a dimensional data model, flexible query language, efficient time series database.Grafana- An open source analytics & monitoring tool that plugs with many sources, including prometheus.Containers- technology to package, deploy, and isolate applications, we'll use docker and docker compose.
Origin is the system where the content is created - or at least it's the source to the CDN. The sample service we're going to build will be a straightforward JSON API. The backend service could be returning an image, video, javascript, HTML page, game, or anything you want to deliver to your clients.
We'll use Nginx and Lua to design the backend service. It's a great excuse to introduce Nginx and Lua since we're going to use them a lot here.
Heads up: the backend service could be written in any language you like.
Nginx is a web server that will follow its configuration. The config file uses directives as the dominant factor. A directive is a simple construction to set properties in nginx. There are two types of directives: simple and block (context).
A simple directive is formed by its name followed by parameters ending with a semicolon.
# Syntax: <name> <parameters>;
# Example
add_header X-Header AnyValue;
The block directive follows the same pattern, but instead of a semicolon, it ends surrounded by curly braces. A block directive can also have directives within it. This block is also known as context.
# Syntax: <name> <parameters> <block>
location / {
  add_header X-Header AnyValue;
}
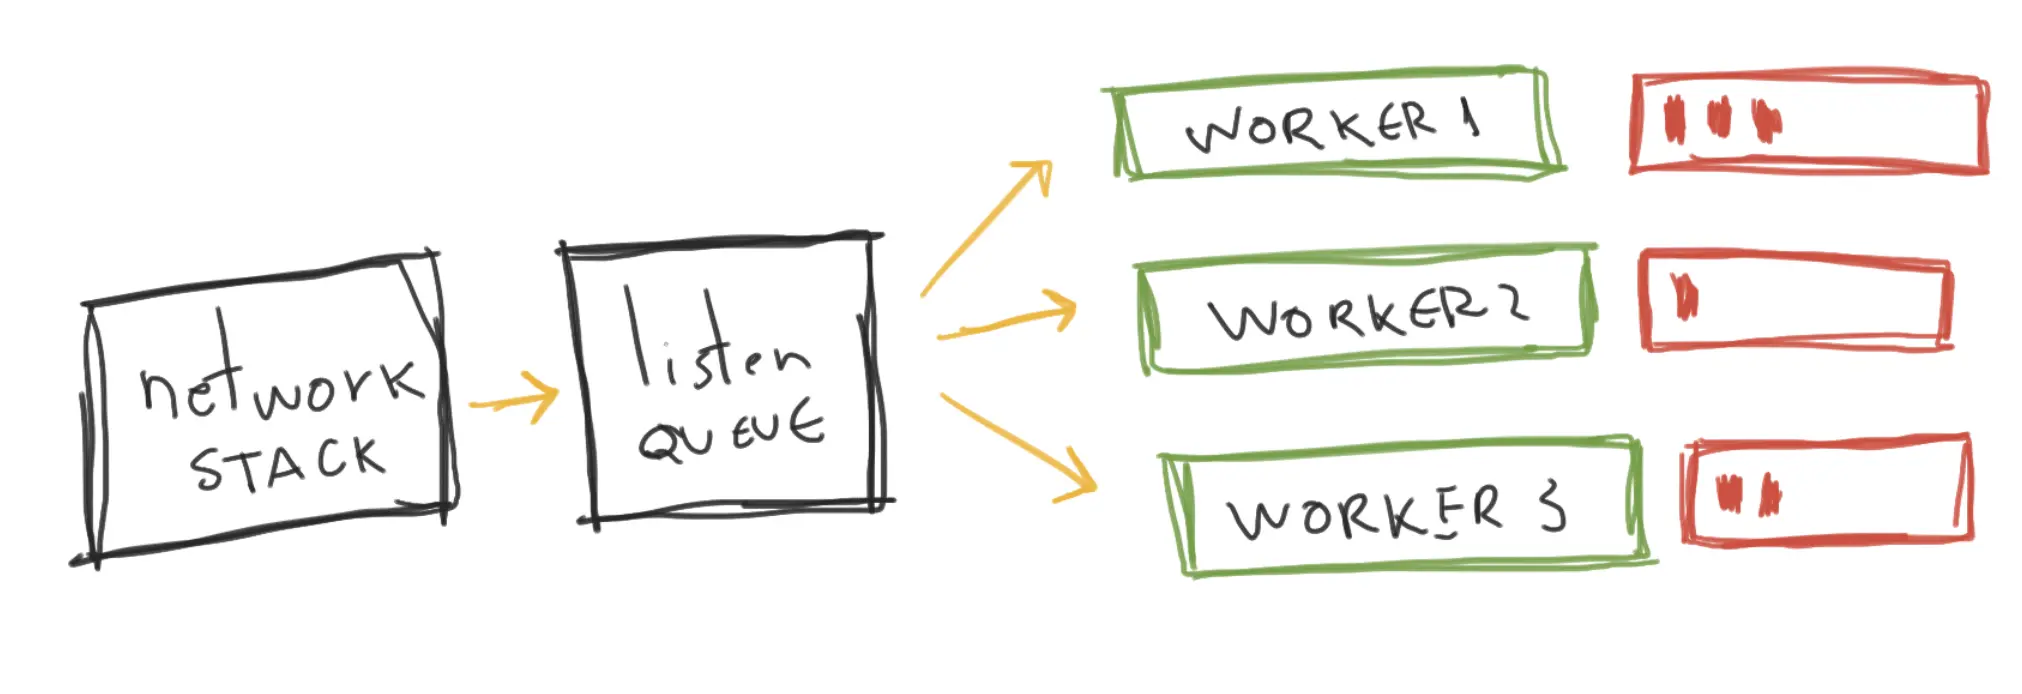
Nginx uses workers (processes) to handle the requests. The nginx architecture plays a crucial role in its performance.
Heads up: Although a single accept queue serving multiple workers is common, there are other models to load balance the incoming requests.
Let's walk through the backend JSON API nginx configuration. I think it'll be much easier if we see it in action.
events {
  worker_connections 1024;
}
error_log stderr;

http {
  access_log /dev/stdout;

  server {
    listen 8080;

    location / {
      content_by_lua_block {
        ngx.header['Content-Type'] = 'application/json'
        ngx.say('{"service": "api", "value": 42}')
      }
    }
  }
}
Were you able to understand what this config is doing? In any case, let's break it down by making comments on each directive.
The events provides context for connection processing configurations, and the worker_connections defines the maximum number of simultaneous connections that can be opened by a worker process.
events {
  worker_connections 1024;
}
The error_log configures logging for error. Here we just send all the errors to the stdout (error)
error_log stderr;The http provides a root context to set up all the http/s servers.
http {}The access_log configures the path (and optionally format, etc) for the access logging.
access_log /dev/stdout;The server sets the root configuration for a server, aka where we're going to setup specific behavior to the server. You can have multiple server blocks per http context.
server {}Within the server we can set the listen directive controlling the address and/or the port on which the server will accept requests.
listen 8080;In the server configuration, we can specify a route by using the location directive. This will be used to provide specific configuration for that matching request path.
location / {}Within this location (by the way, / will handle all the requests) we'll use Lua to create the response. There's a directive called content_by_lua_block which provides a context where the Lua code will run.
content_by_lua_block {}Finally, we'll use Lua and the basic Nginx Lua API to set the desired behavior.
-- ngx.header sets the current response header that is to be sent.
ngx.header['Content-Type'] = 'application/json'
-- ngx.say will write the response body
ngx.say('{"service": "api", "value": 42}')
Notice that most of the directives contain their scope. For instance, the location is only applicable within the location (recursively) and server context.
Heads up: we won't comment on each directive we add from now on, we'll only describe the most relevant for the section.
Let's see what we did.
git checkout 1.0.0 # going back to specific configuration
docker-compose run --rm --service-ports backend # run the containers exposing the service
http http://localhost:8080/path/to/my/content.ext # consuming the service, I used httpie but you can use curl or anything you like

# you should see the json response :)For the backend service to be cacheable we need to set up the caching policy. We'll use the HTTP header Cache-Control to setup what caching behavior we want.
-- we want the content to be cached by 10 seconds OR the provided max_age (ex: /path/to/service?max_age=40 for 40 seconds)
ngx.header['Cache-Control'] = 'public, max-age=' .. (ngx.var.arg_max_age or 10)
And, if you want, make sure to check the returned response header Cache-Control.
git checkout 1.0.1 # going back to specific configuration
docker-compose run --rm --service-ports backend
http "http://localhost:8080/path/to/my/content.ext?max_age=30"Checking the logging is fine for debugging. But once we're reaching more traffic, it'll be nearly impossible to understand how the service is operating. To tackle this case, we're going to use VTS, an nginx module which adds metrics measurements.
vhost_traffic_status_zone shared:vhost_traffic_status:12m;
vhost_traffic_status_filter_by_set_key $status status::*;
vhost_traffic_status_histogram_buckets 0.005 0.01 0.05 0.1 0.5 1 5 10; # buckets are in seconds
The vhost_traffic_status_zone sets a memory space required for the metrics. The vhost_traffic_status_filter_by_set_key groups metrics by a given variable (for instance, we decided to group metrics by status) and finally, the vhost_traffic_status_histogram_buckets provides a way to bucketize the metrics in seconds. We decided to create buckets varying from 0.005 to 10 seconds, because they will help us to create percentiles (p99, p50, etc).
location /status {
  vhost_traffic_status_display;
  vhost_traffic_status_display_format html;
}
We also must expose the metrics in a location. We will use the /status to do it.
git checkout 1.1.0
docker-compose run --rm --service-ports backend
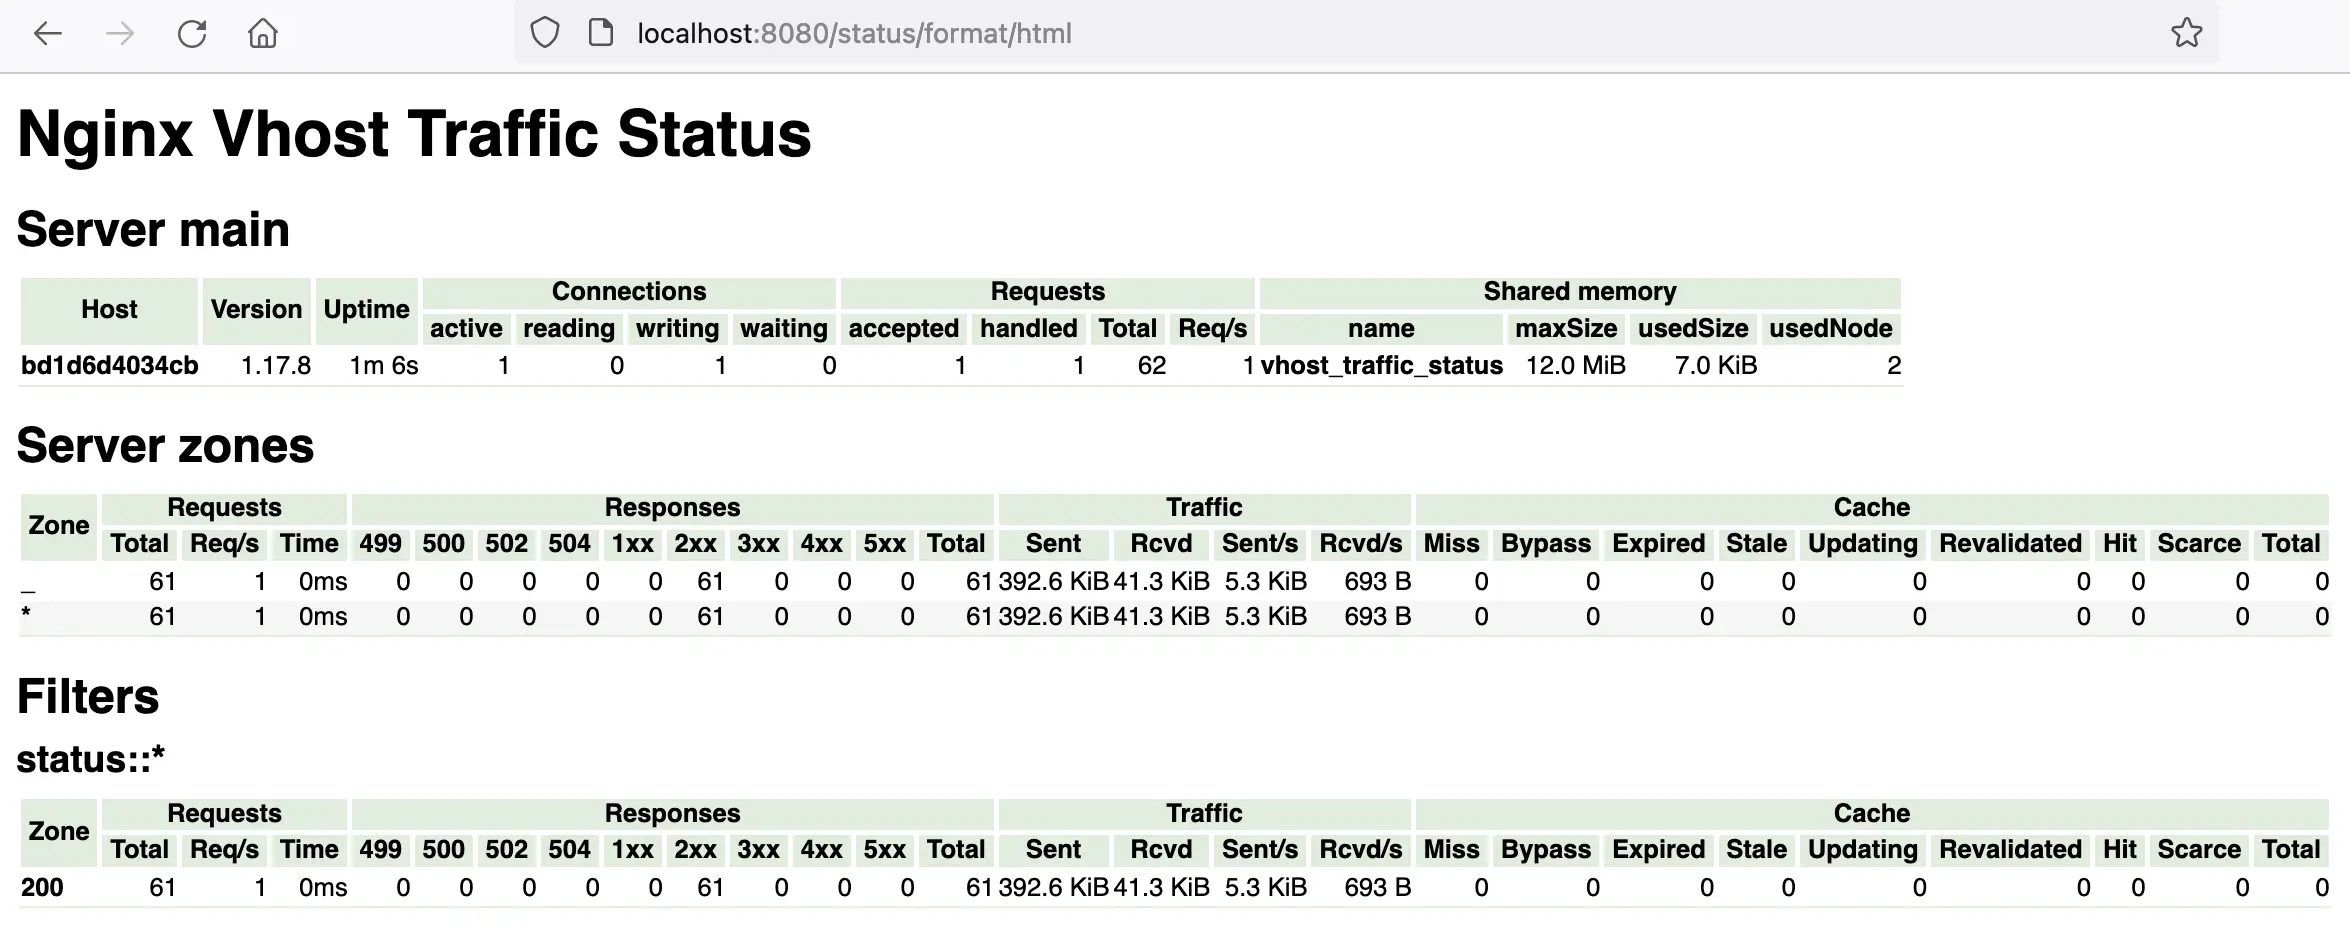
# if you go to http://localhost:8080/status/format/html you'll see information about the server 8080
# notice that VTS also provides other formats such as status/format/prometheus, which will be pretty helpful for us in near future
With metrics, we can run (load) tests and see if the configuration changes we made are resulting in a better performance or not.
Heads up: You can group the metrics under a custom namespace. This is useful when you have a single location that behaves differently depending on the context.
As the configuration becomes bigger, it also gets harder to comprehend. Nginx offers a neat directive called include which allows us to create partial config files and include them into the root configuration file.
-    location /status {
-      vhost_traffic_status_display;
-      vhost_traffic_status_display_format html;
-    }
+    include basic_vts_location.conf;
We can extract location, group configurations per similarities, or anything that makes sense to a file. We can do a similar thing for the Lua code as well.
       content_by_lua_block {
-        ngx.header['Content-Type'] = 'application/json'
-        ngx.header['Cache-Control'] = 'public, max-age=' .. (ngx.var.arg_max_age or 10)
-
-        ngx.say('{"service": "api", "value": 42, "request": "' .. ngx.var.uri .. '"}')
+        local backend = require "backend"
+        backend.generate_content()
       }
All these modifications were made to improve readability, but it also promotes reuse.
What we did so far has nothing to do with the CDN. Now it's time to start building the CDN. For that, we'll create another node with nginx, just adding a few new directives to connect the edge (CDN) node with the backend node.
There's really nothing fancy here, it's just an upstream block with a server pointing to our backend endpoint. In the location, we do not provide the content, but instead we point to the upstream, using the proxy_pass, we just created.
upstream backend {
  server backend:8080;
  keepalive 10;  # connection pool for reuse
}

server {
  listen 8080;

  location / {
    proxy_pass http://backend;
    add_header X-Cache-Status $upstream_cache_status;
  }
}
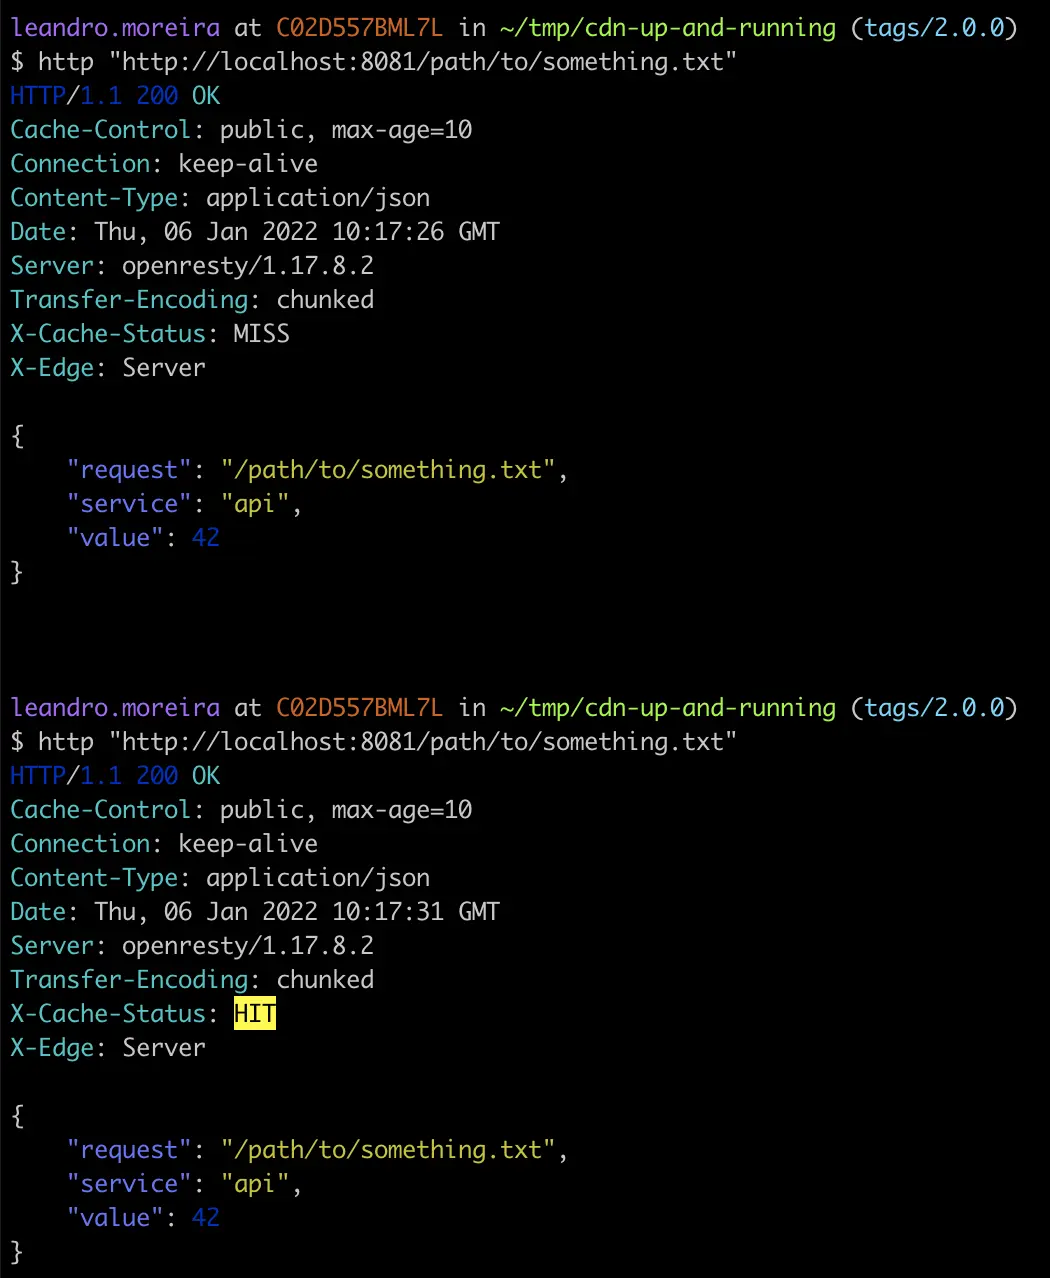
We also added a new header (X-Cache-Status) to indicate whether the cache was used or not.
- HIT: when the content is in the CDN, the
X-Cache-Statusshould return a hit. - MISS: when the content isn't in the CDN, the
X-Cache-Statusshould return a miss.
git checkout 2.0.0
docker-compose up
# we still can fetch the content from the backend
http "http://localhost:8080/path/to/my/content.ext"
# but we really want to access the content through the edge (CDN)
http "http://localhost:8081/path/to/my/content.ext"When we try to fetch content, the X-Cache-Status header is absent. It seems that the edge node is always invariably requesting the backend. This is not the way a CDN should work, right?
backend_1     | 172.22.0.4 - - [05/Jan/2022:17:24:48 +0000] "GET /path/to/my/content.ext HTTP/1.0" 200 70 "-" "HTTPie/2.6.0"
edge_1        | 172.22.0.1 - - [05/Jan/2022:17:24:48 +0000] "GET /path/to/my/content.ext HTTP/1.1" 200 70 "-" "HTTPie/2.6.0"
The edge is just proxying the clients to the backend. What are we missing? Is there any reason to use a "simple" proxy at all? Well, it does, maybe you want to provide throttling, authentication, authorization, tls termination, or a gateway for multiple services, but that's not what we want.
We need to create a cache area on nginx through the directive proxy_cache_path. It's setting up the path where the cached content will reside, the shared memory key_zone, and policies such as inactive, max_size, among others, to control how we want the cache to behave.
proxy_cache_path /cache/ levels=2:2 keys_zone=zone_1:10m max_size=10m inactive=10m use_temp_path=off;Once we've configured a proper cache, we must also set up the proxy_cache pointing to the right zone (via proxy_cache_path keys_zone=<name>:size), and the proxy_pass linking to the upstream we've created.
location / {
    # ...
    proxy_pass http://backend;
    proxy_cache zone_1;
}
There is another important aspect of caching which is managed by the directive proxy_cache_key.
When a client requests content from nginx, it will (highly simplified):
- Receive the request (let's say:
GET /path/to/something.txt) - Apply a hash md5 function over the cache key value (let's assume that the cache key is the
uri)- md5("/path/to/something.txt") =>
b3c4c5e7dc10b13dc2e3f852e52afcf3- you can check that on your terminarl
echo -n "/path/to/something.txt" | md5
- you can check that on your terminarl
- md5("/path/to/something.txt") =>
- It checks whether the content (hash
b3c4..) is cached or not - If it's cached, it just returns the object otherwise it fetches the content from the backend
- It also saves locally (in memory and on disk) to avoid future requests
Let's create a variable called cache_key using the lua directive set_by_lua_block. It will, for each incoming request, fill the cache_key with the uri value. Beyond that, we also need to update the proxy_cache_key.
location / {
    set_by_lua_block $cache_key {
      return ngx.var.uri
    }
    # ...
    proxy_cache_key $cache_key;
}
Heads up: Using
urias cache key will make the following two requests http://example.com/path/to/content.ext and http://example.edu/path/to/content.ext (if they're using the same cache proxy) as if they were a single object. If you do not provide a cache key, nginx will use a reasonable default value$scheme$proxy_host$request_uri.
Now we can see the caching properly working.
git checkout 2.1.0
docker-compose up
http "http://localhost:8081/path/to/my/content.ext"
# the second request must get the content from the CDN without leaving to the backend
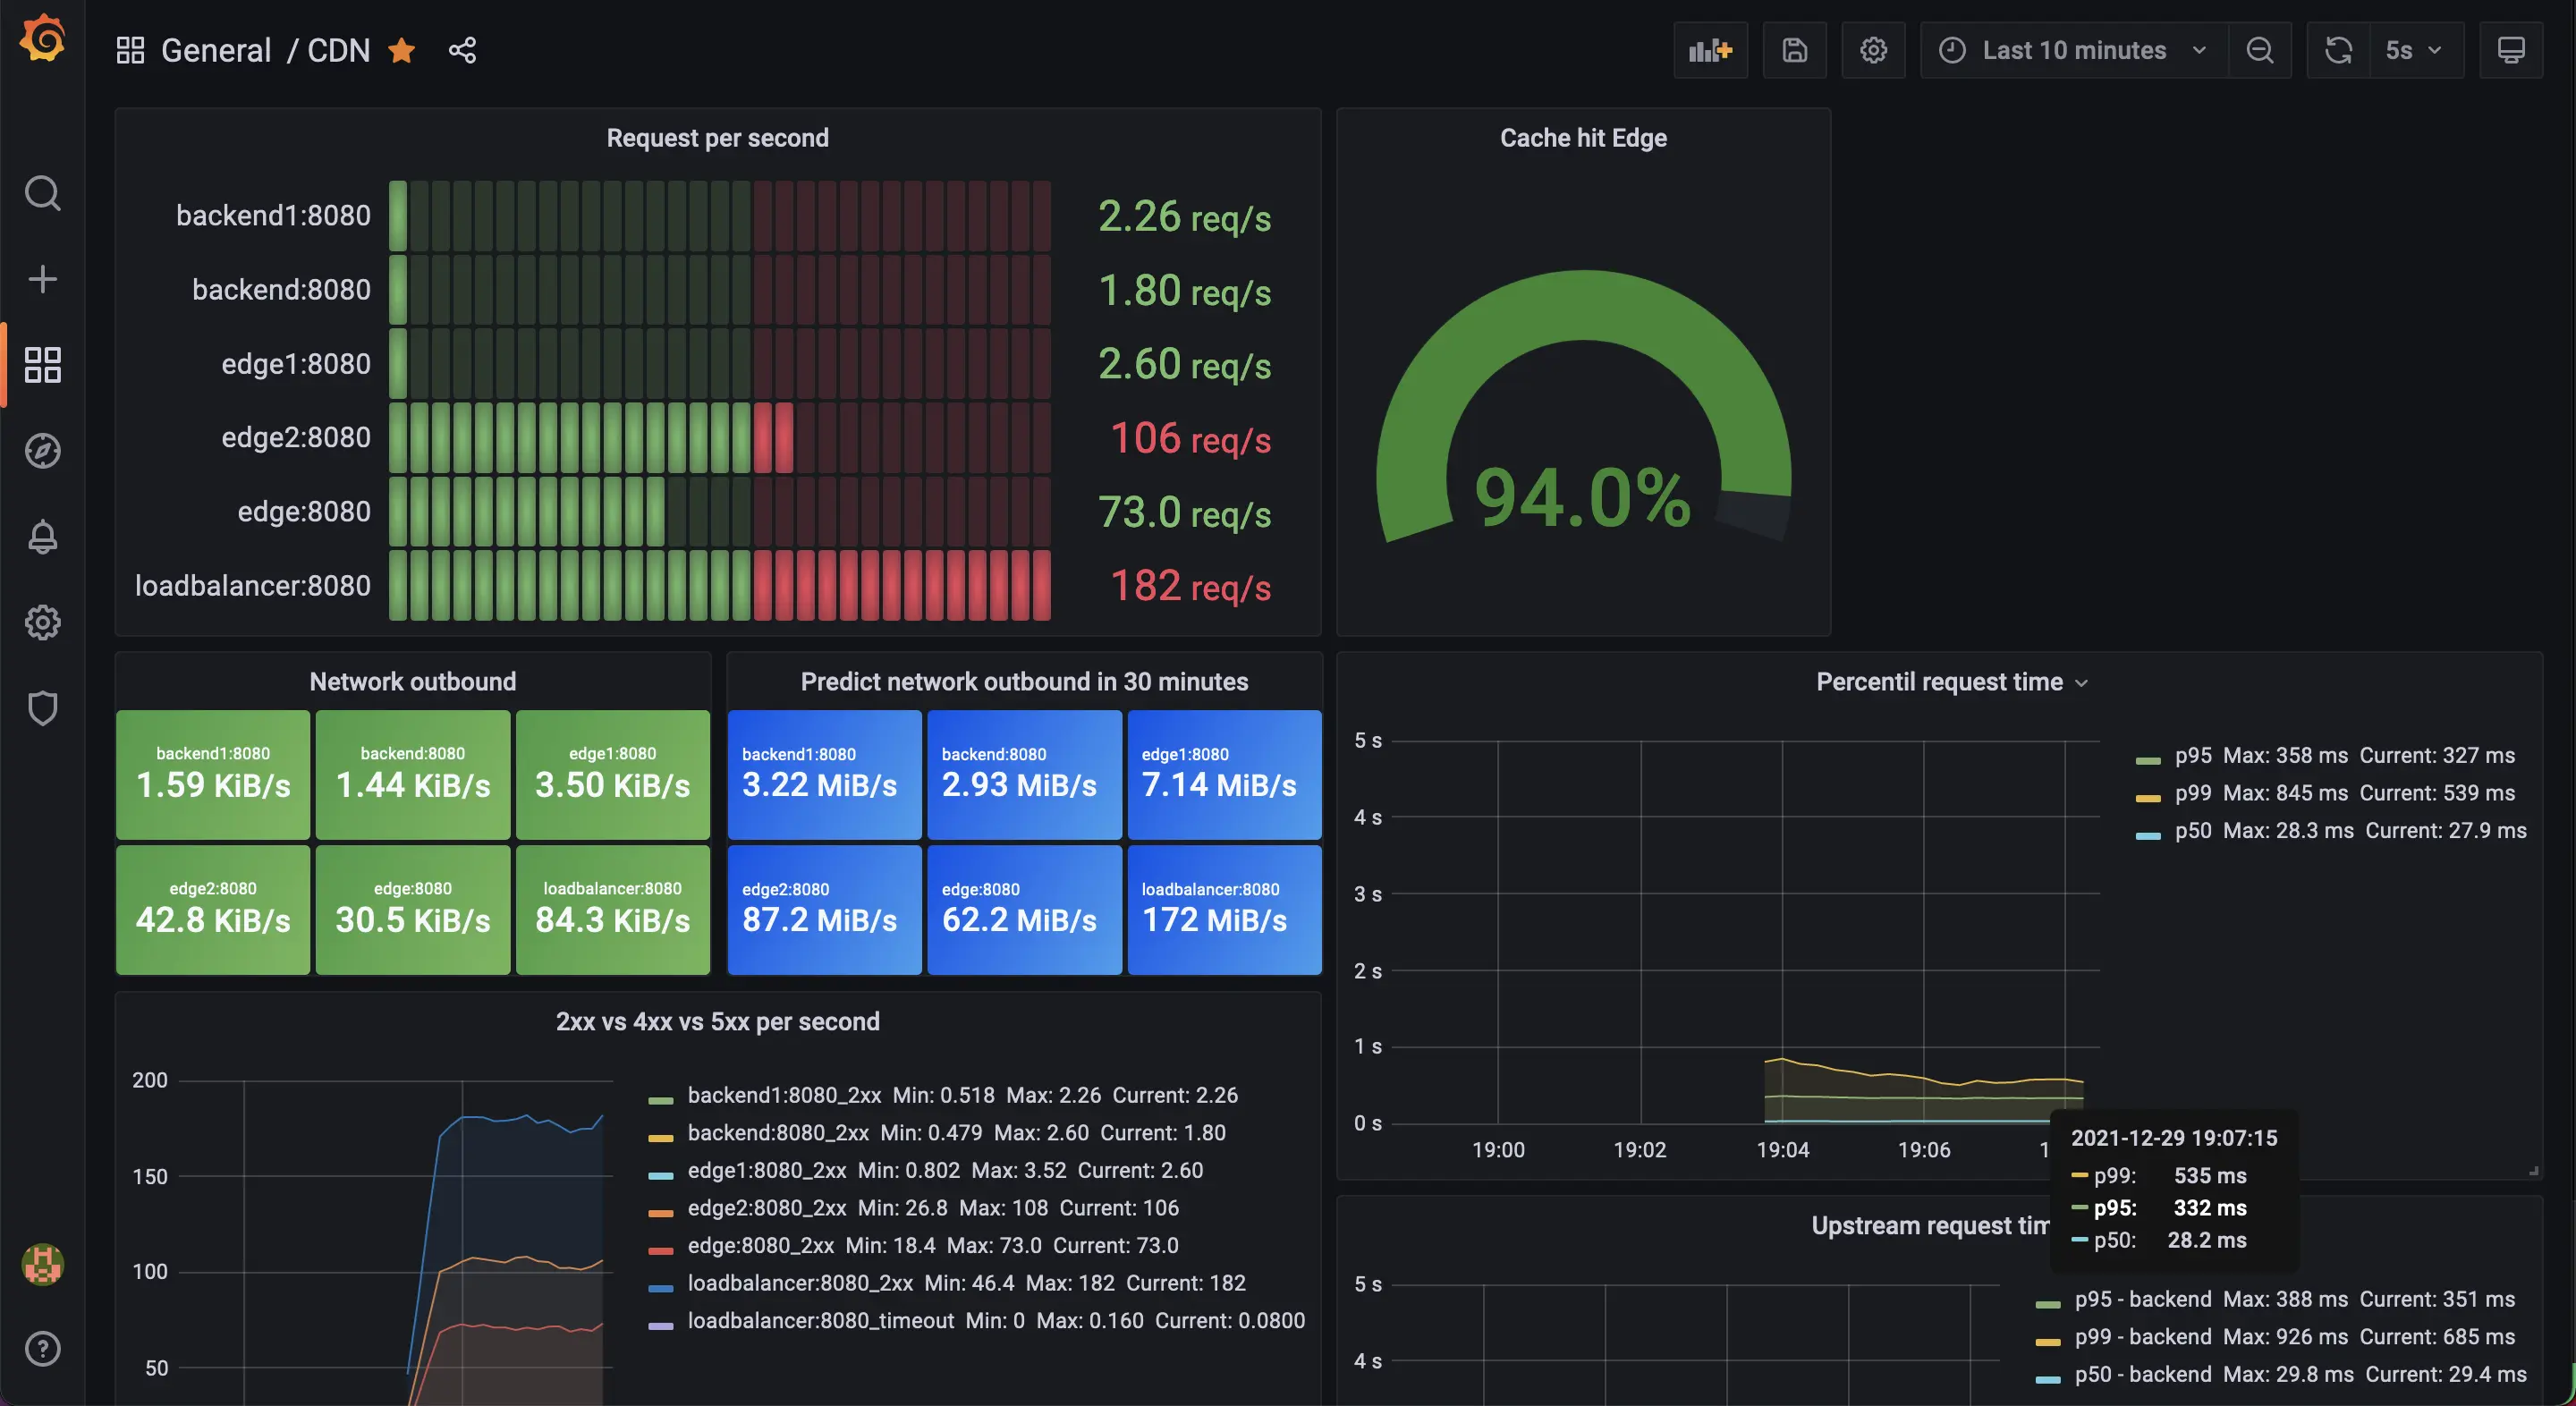
http "http://localhost:8081/path/to/my/content.ext"Checking the cache effectiveness by looking at the command line isn't efficient. It's better if we use a tool for that. Prometheus will be used to scrape metrics on all servers, and Grafana will show graphics based on the metrics collected by the prometheus.
Prometheus configuration will look like this.
global:
  scrape_interval:     10s # each 10s prometheus will scrape targets
  evaluation_interval: 10s
  scrape_timeout: 2s

  external_labels:
      monitor: 'CDN'

scrape_configs:
  - job_name: 'prometheus'
    metrics_path: '/status/format/prometheus'
    static_configs:
      - targets: ['edge:8080', 'backend:8080'] # the server list to be scrapped by the scrap_path
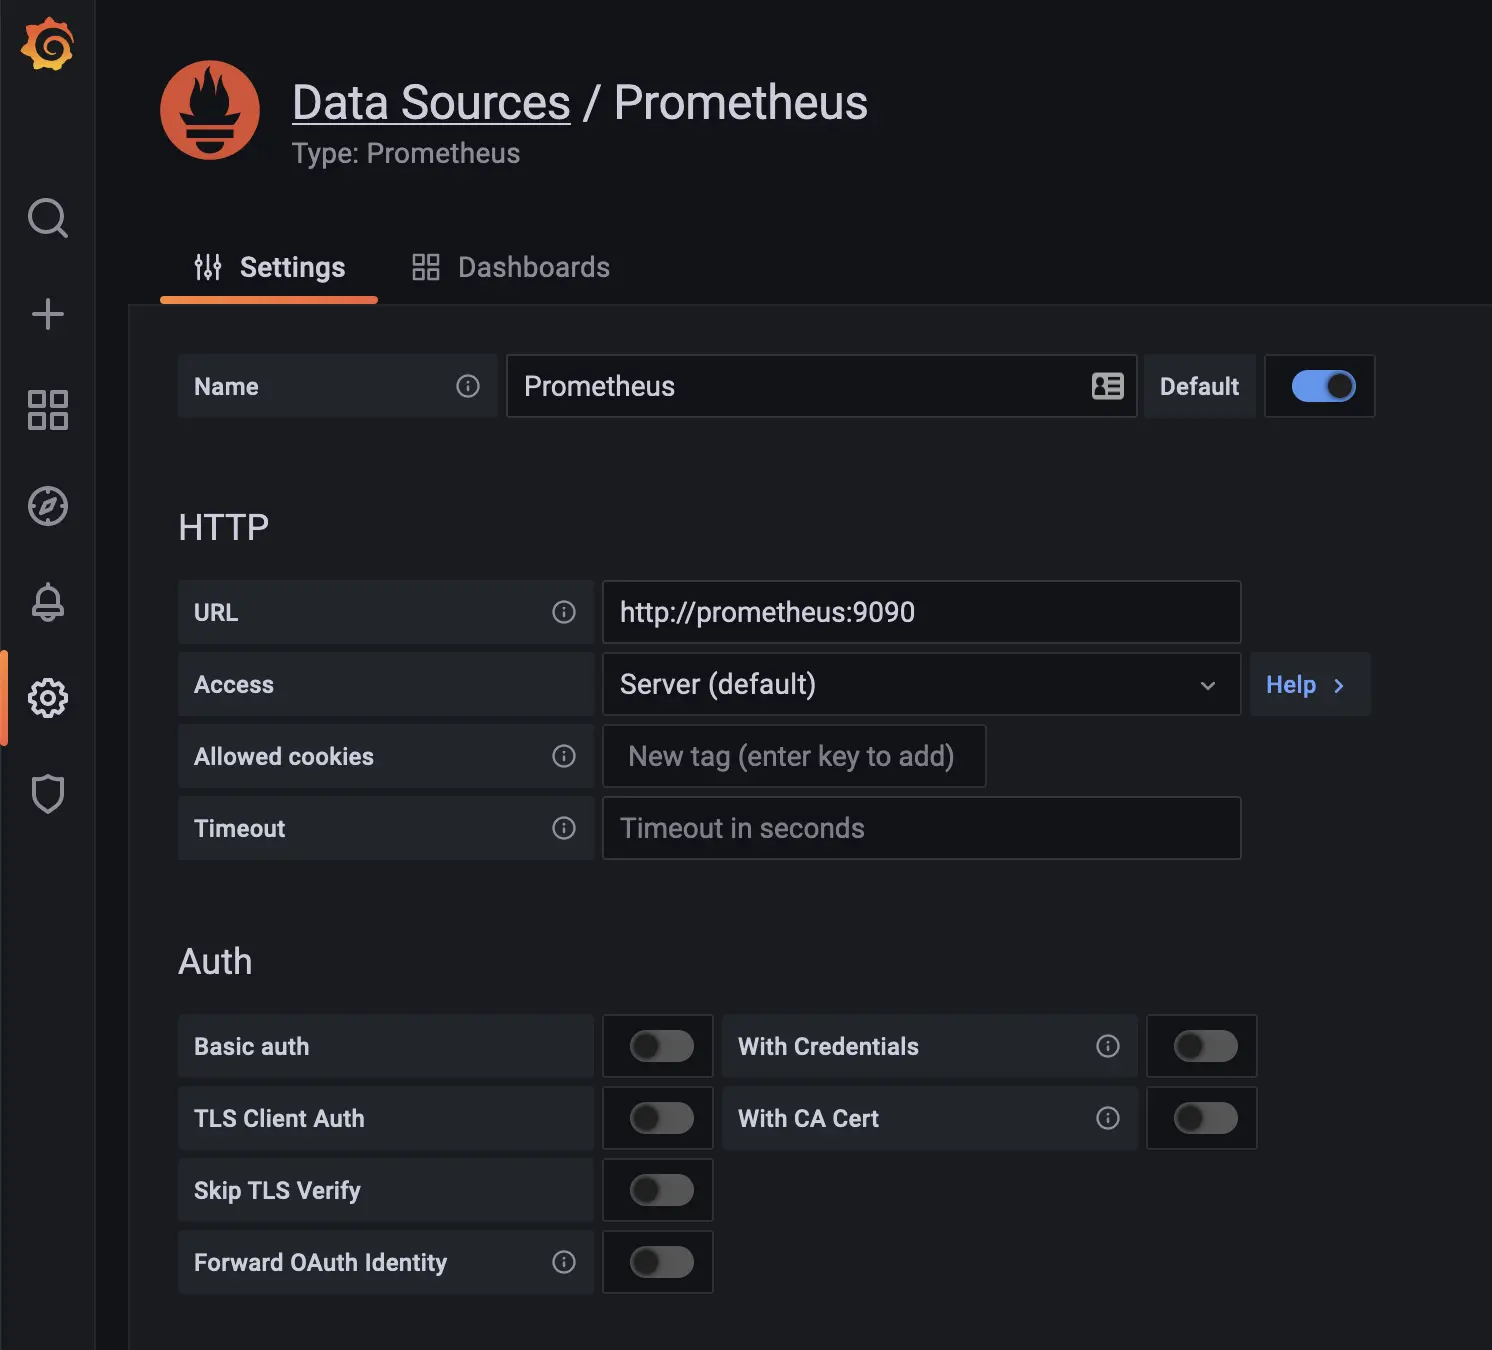
Now, we need to add a prometheus source for Grafana.
And set the proper prometheus server.
The backend server is artificially creating responses. We'll add simulated latency using lua. The idea is to make it closer to real-world situations. We're going to model the latency using percentiles.
percentile_config={
    {p=50, min=1, max=20,}, {p=90, min=21, max=50,}, {p=95, min=51, max=150,}, {p=99, min=151, max=500,},
}
We randomly pick a number from 1 to 100, and then we apply another random using the respective percentile profile ranging from the min to the max. Finally, we sleep that duration.
local current_percentage = random(1, 100) -- decide with percentile this request will be
-- let's assume we picked 94
-- therefore we'll use the percentile_config with p90
local sleep_duration = random(p90.min, p90.max)
sleep(sleep_seconds)
This model lets us freely try to emulate closer to real-world observed latencies.
We'll run some load testing to learn more about the solution we're building. Wrk is an HTTP benchmarking tool that you can dynamically configure using lua. We pick a random number from 1 to 100 and request that item.
request = function()
  local item = "item_" .. random(1, 100)

  return wrk.format(nil, "/" .. item .. ".ext")
end
The command line will run the tests for 10 minutes (600s), using two threads, and 10 connections.
wrk -c10 -t2 -d600s -s ./src/load_tests.lua --latency http://localhost:8081Of course, you can run this on your machine:
git checkout 2.2.0
docker-compose up

# run the tests
./load_test.sh

# go check on grafana, how the system is behaving
http://localhost:9091
The wrk output was as shown bellow. There were 37k requests with 674 failing requests in total.
Running 10m test @ http://localhost:8081
  2 threads and 10 connections
  Thread Stats   Avg      Stdev     Max   +/- Stdev
    Latency   218.31ms  236.55ms   1.99s    84.32%
    Req/Sec    35.14     29.02   202.00     79.15%
  Latency Distribution
     50%  162.73ms
     75%  350.33ms
     90%  519.56ms
     99%    1.02s
  37689 requests in 10.00m, 15.50MB read
  Non-2xx or 3xx responses: 674
Requests/sec:     62.80
Transfer/sec:     26.44KB
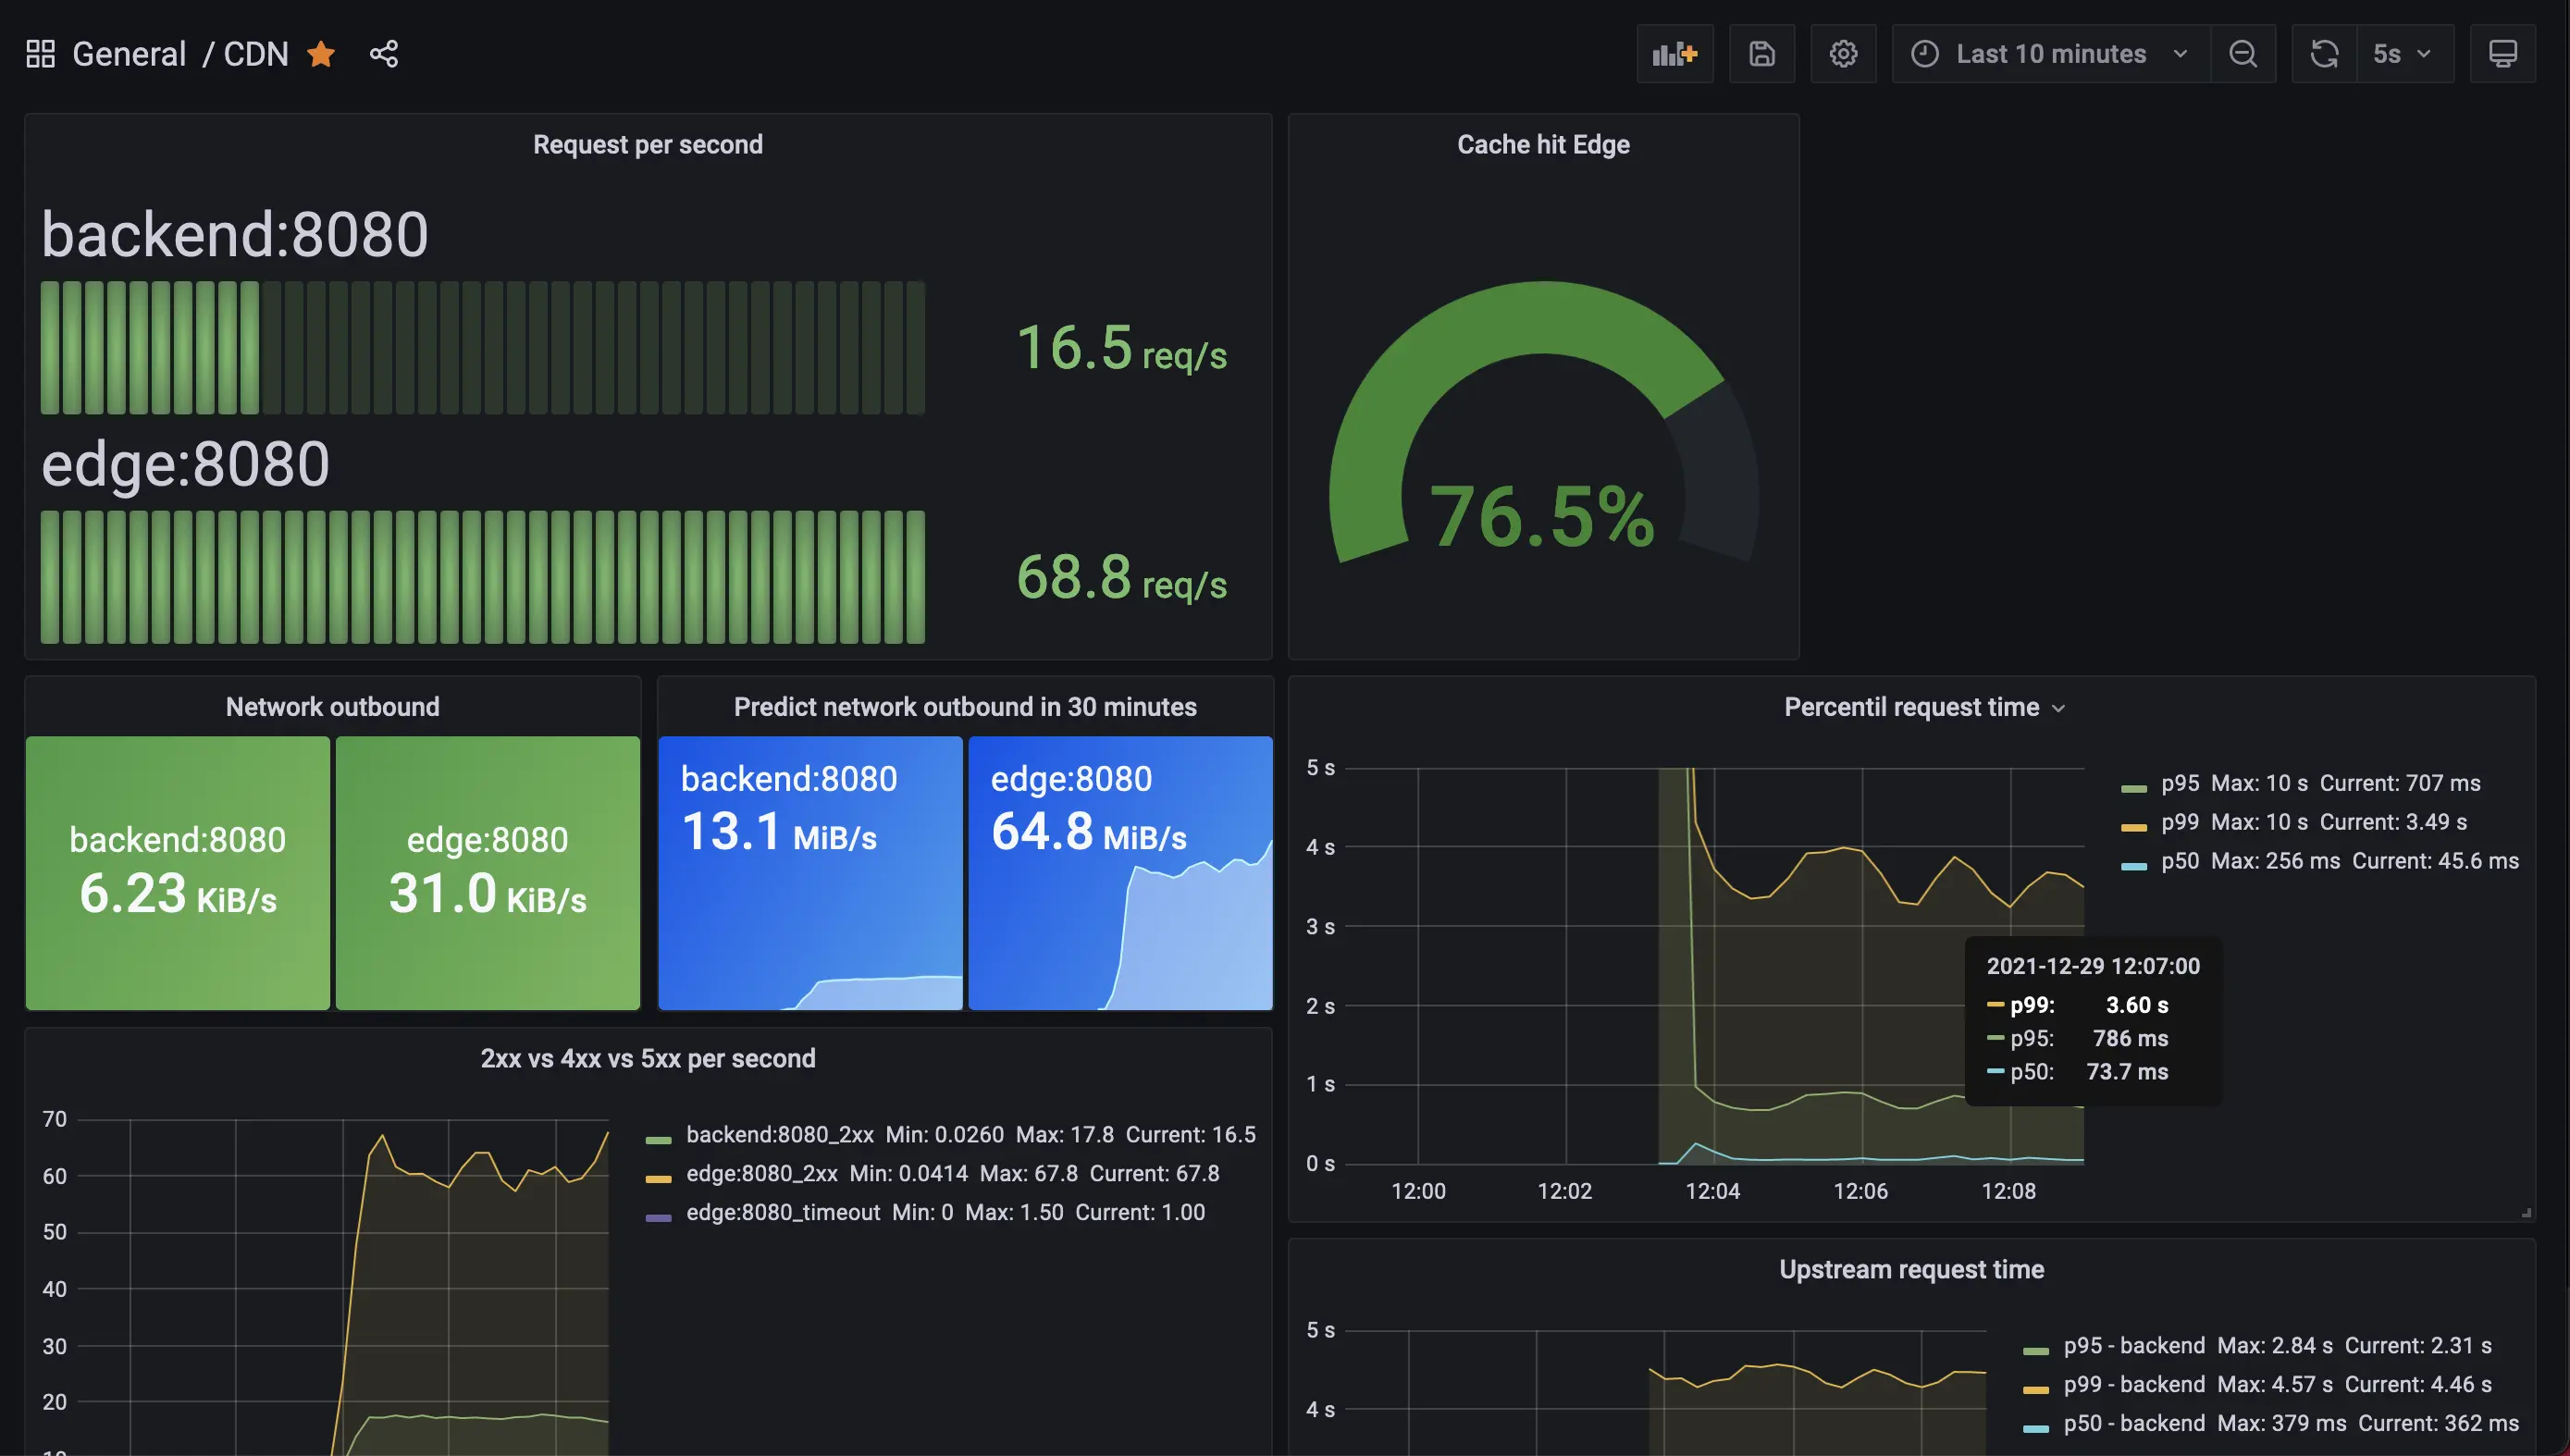
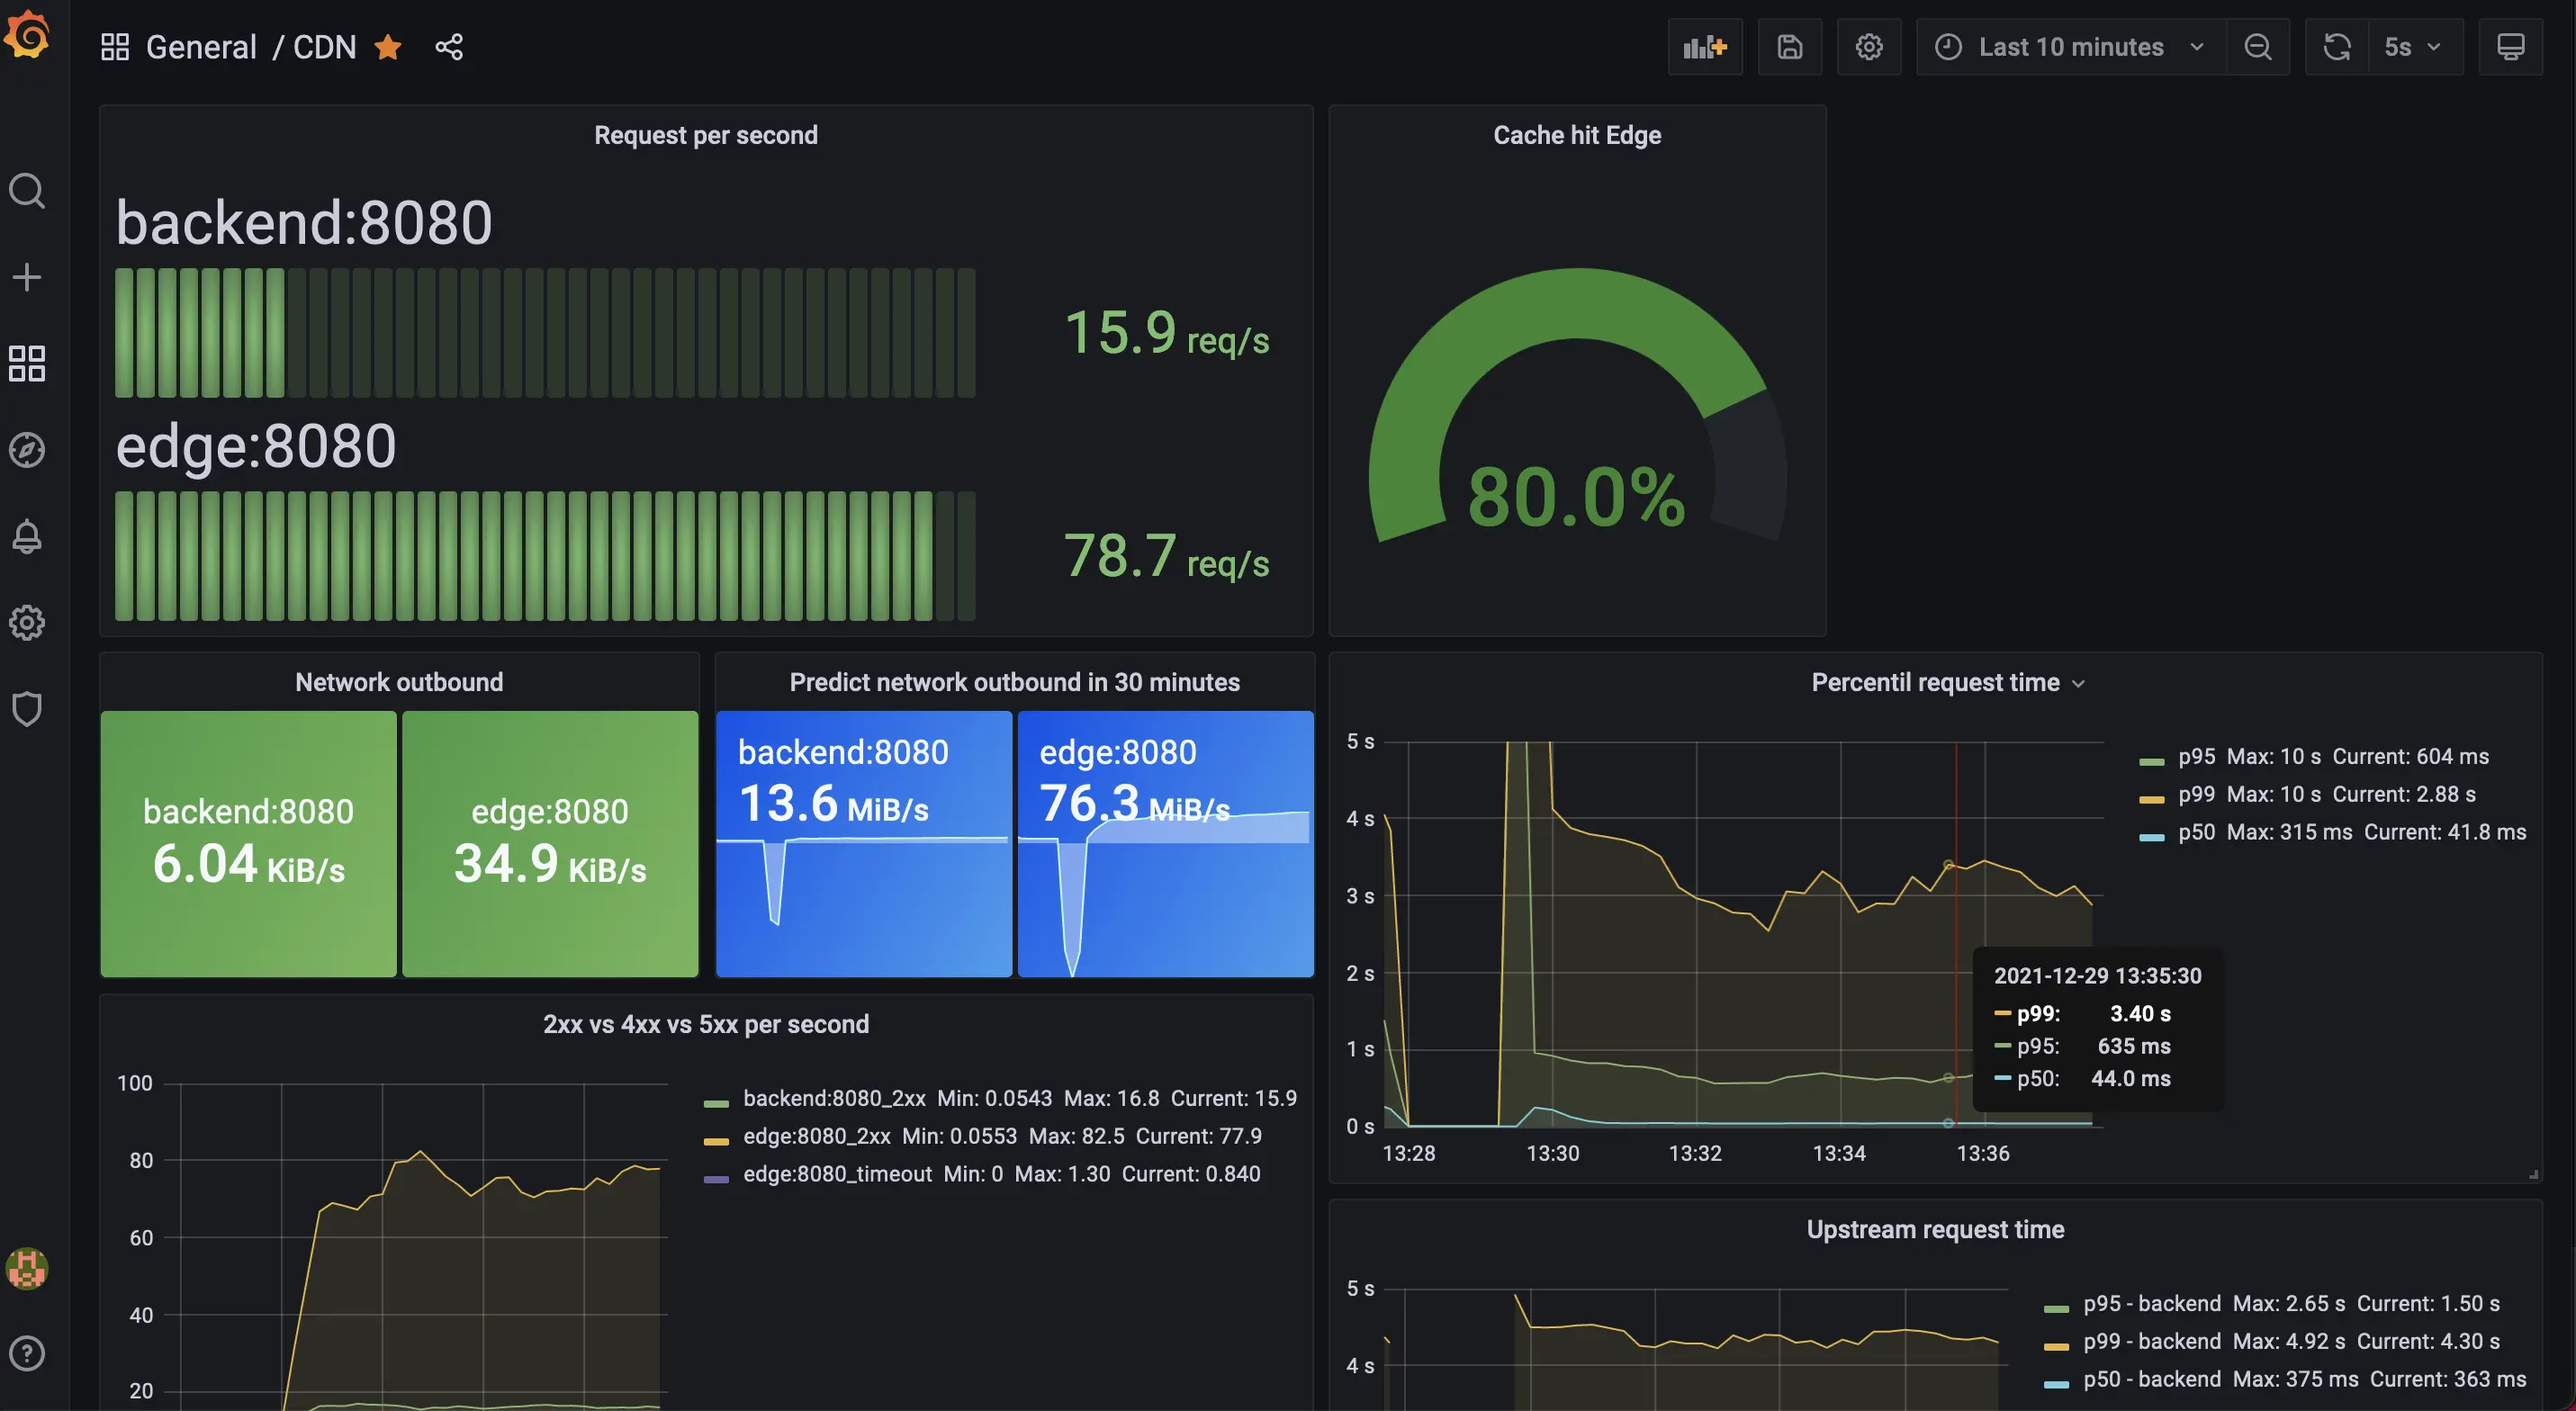
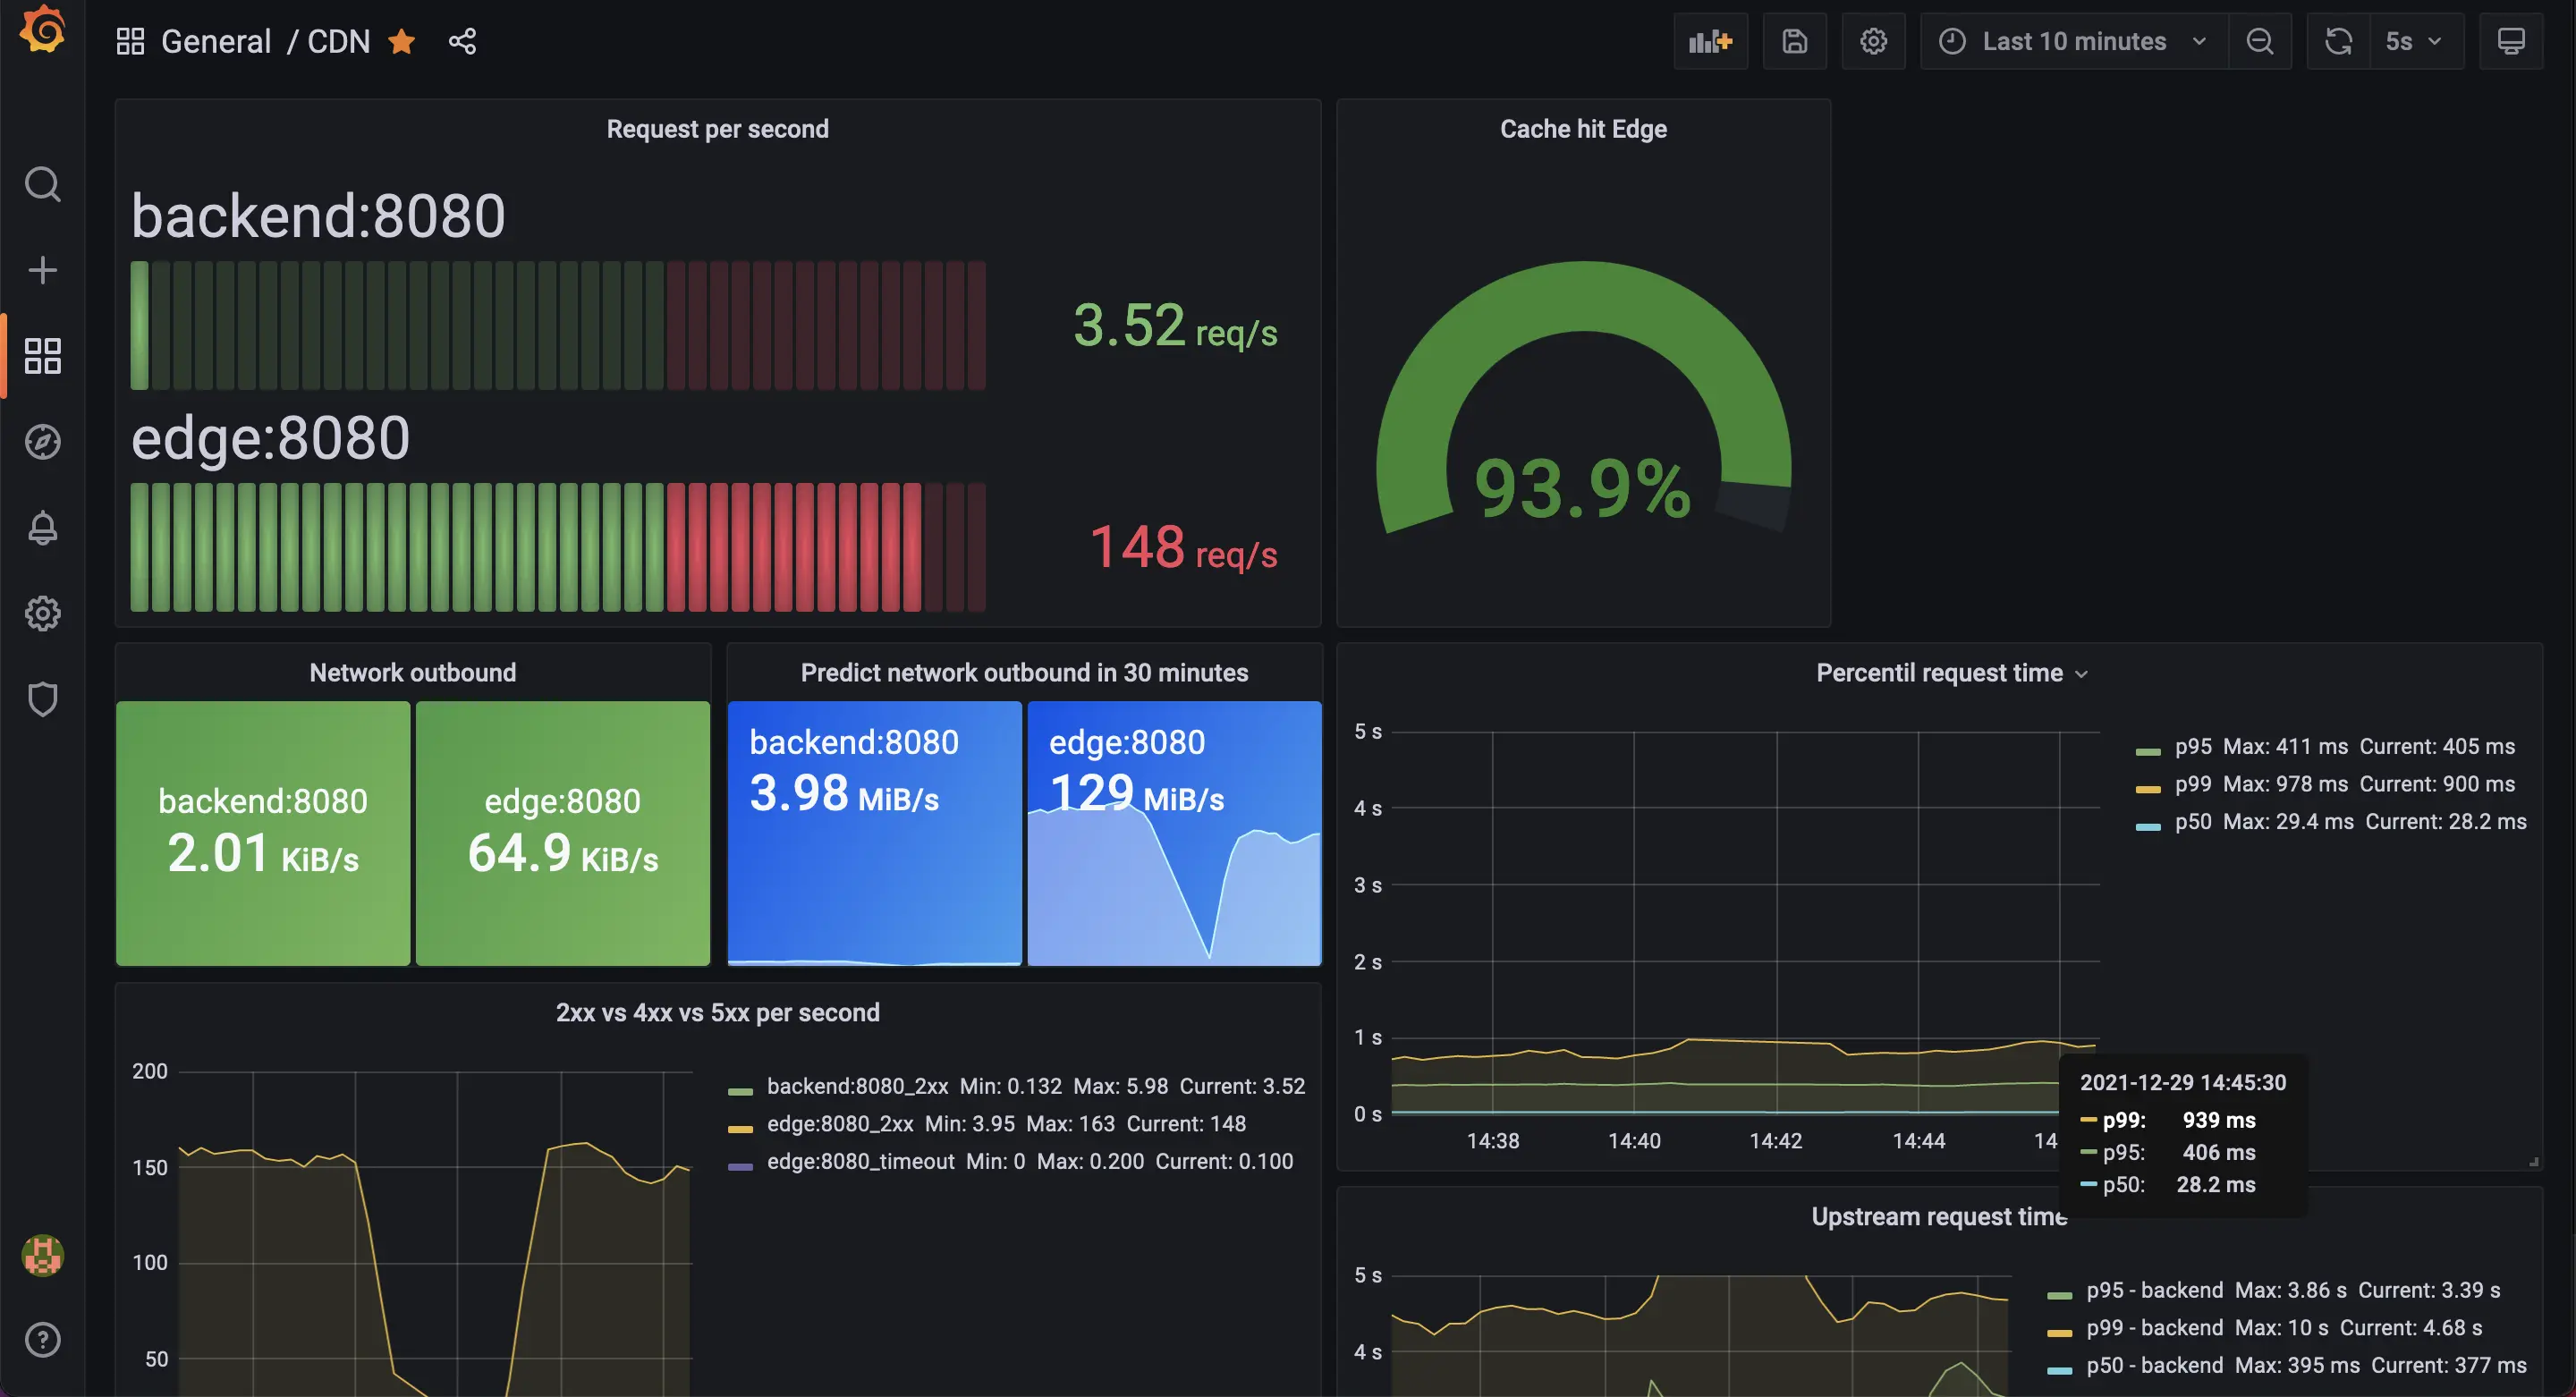
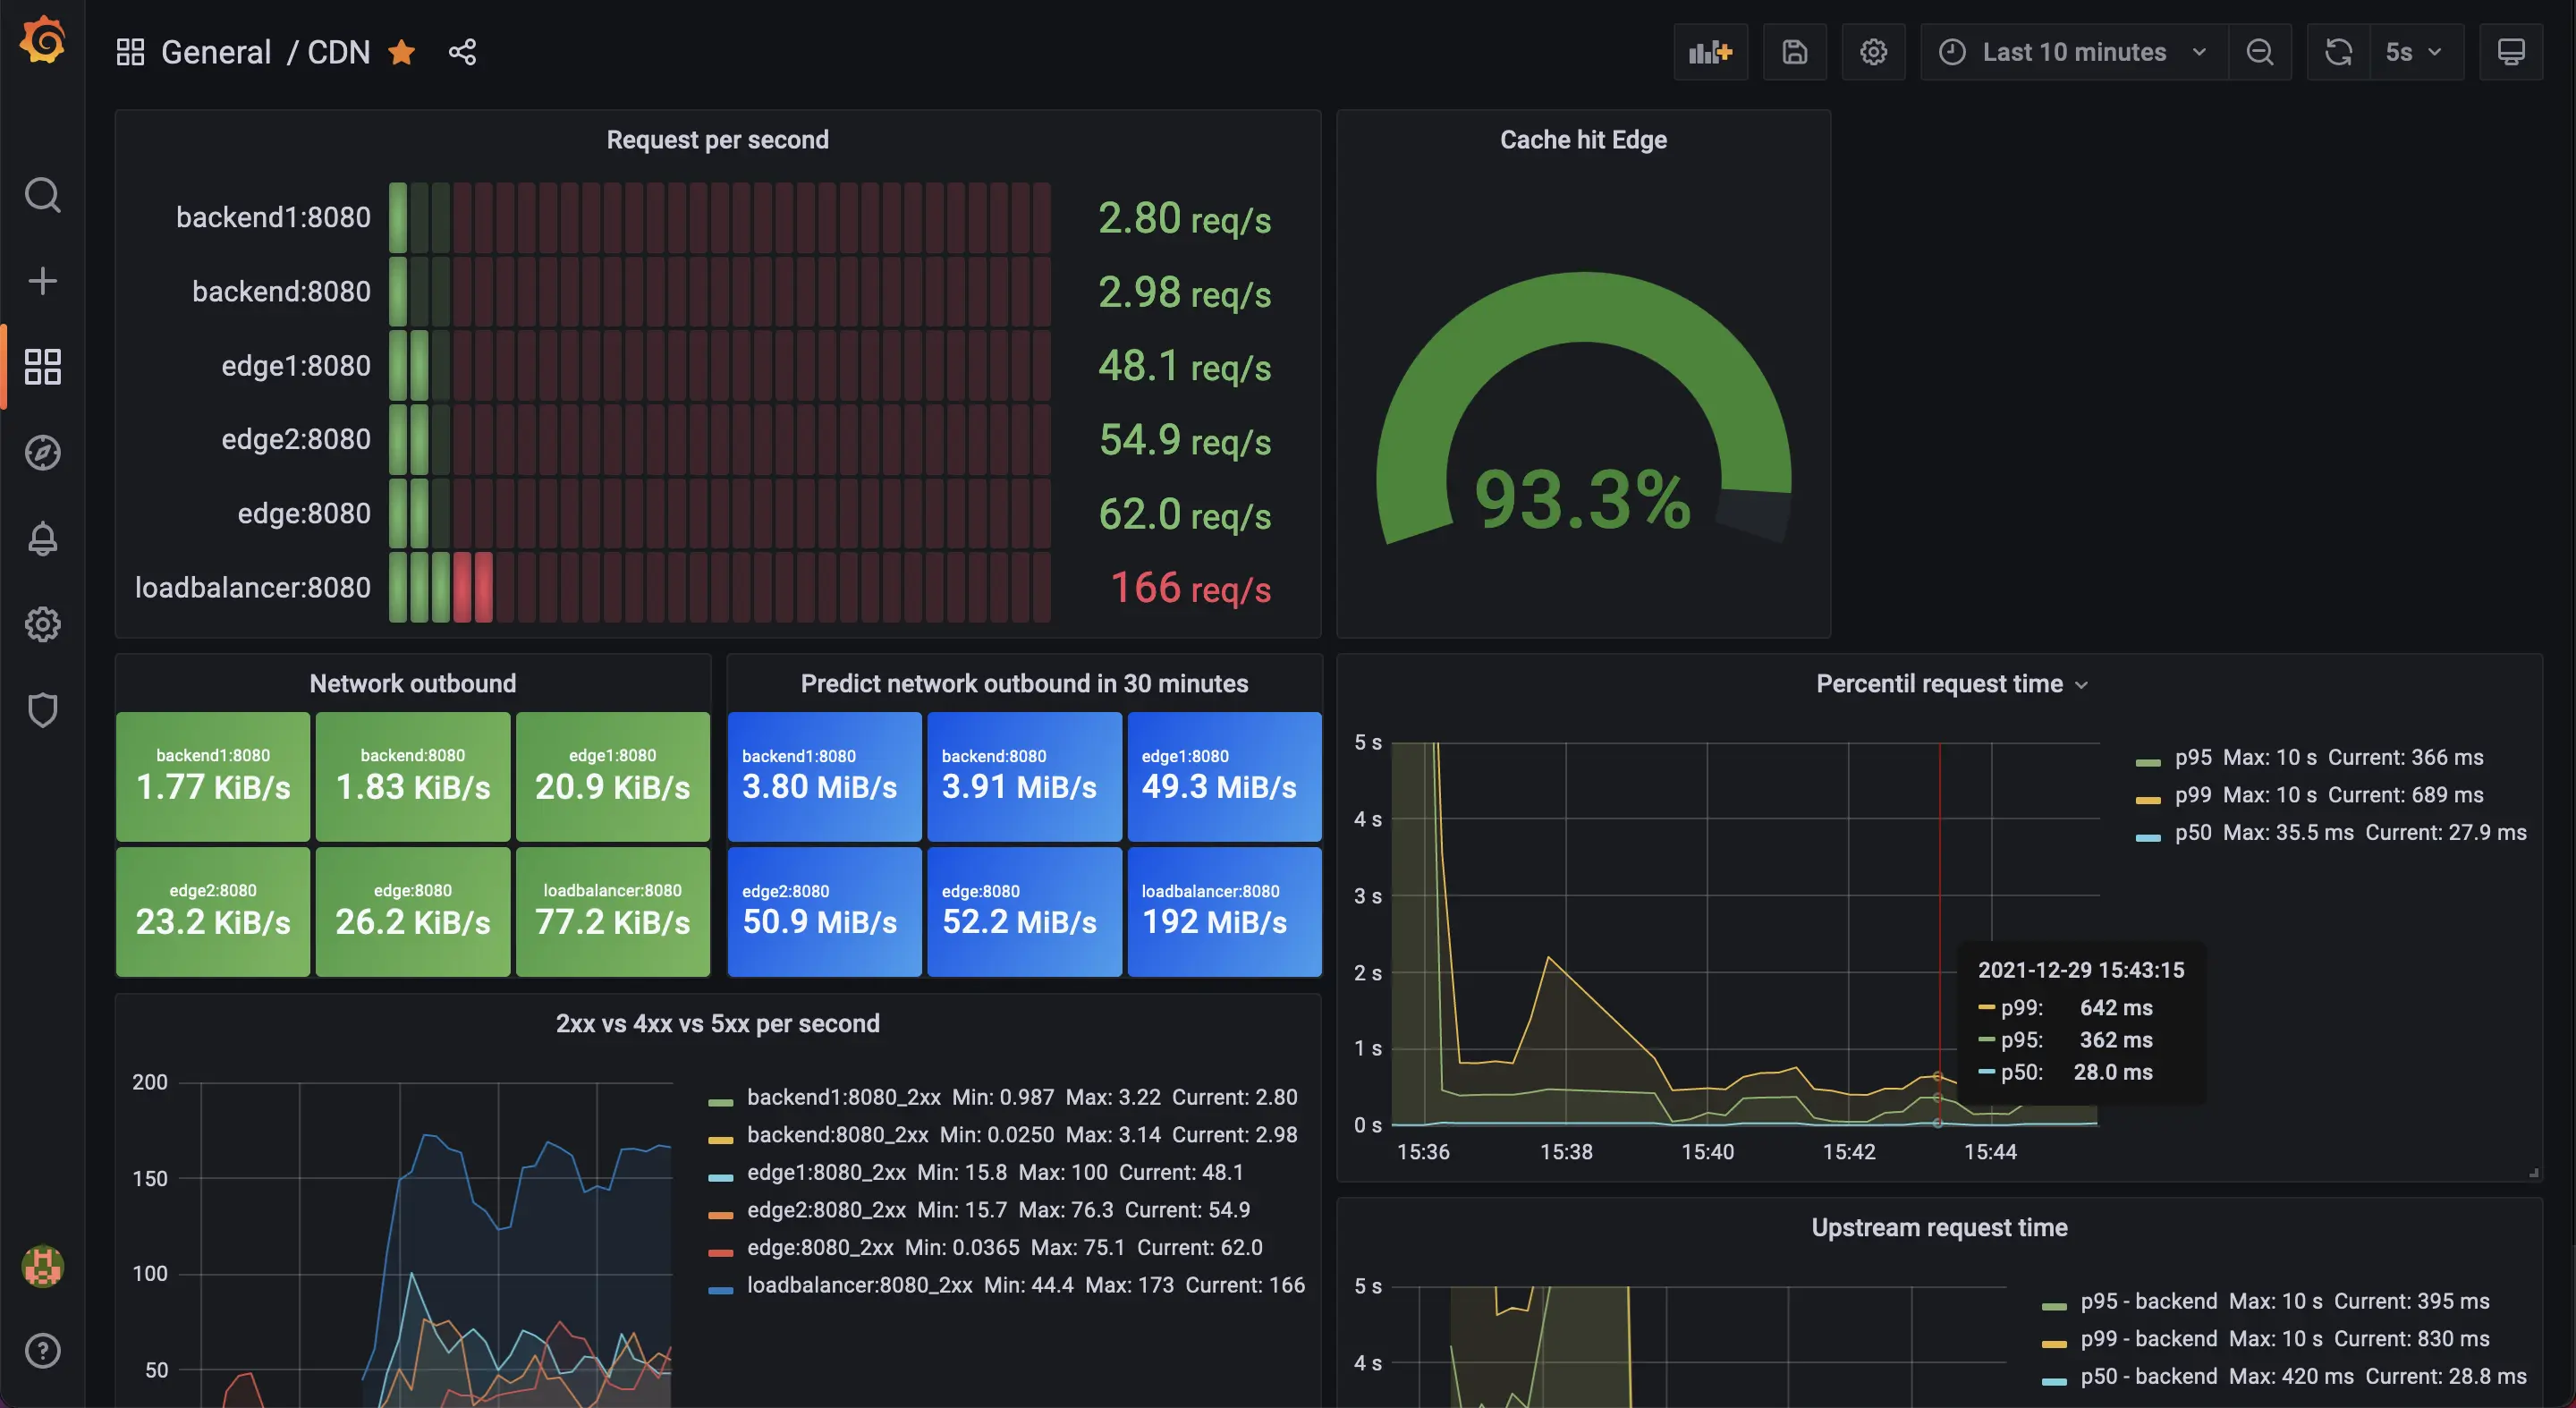
Grafana showed that in a given instant, 68 requests were responded by the edge. From these requests, 16 went through the backend. The cache efficiency was 76%, 1% of the request's latency was longer than 3.6s, 5% observed more than 786ms, and the median was around 73ms.
This project should engage you to experiment, change parameters values, run load testing, and check the results. I think this loop can be a great to learn. Let's try to see what happens when we change the cache behavior.
Using 1s for cache validity.
request = function()
  local item = "item_" .. random(1, 100)

  return wrk.format(nil, "/" .. item .. ".ext?max_age=1")
end
Run the tests, and the result is: only 16k requests with 773 errors.
Running 10m test @ http://localhost:8081
  2 threads and 10 connections
  Thread Stats   Avg      Stdev     Max   +/- Stdev
    Latency   378.72ms  254.21ms   1.46s    68.40%
    Req/Sec    15.11      9.98    90.00     74.18%
  Latency Distribution
     50%  396.15ms
     75%  507.22ms
     90%  664.18ms
     99%    1.05s
  16643 requests in 10.00m, 6.83MB read
  Non-2xx or 3xx responses: 773
Requests/sec:     27.74
Transfer/sec:     11.66KB
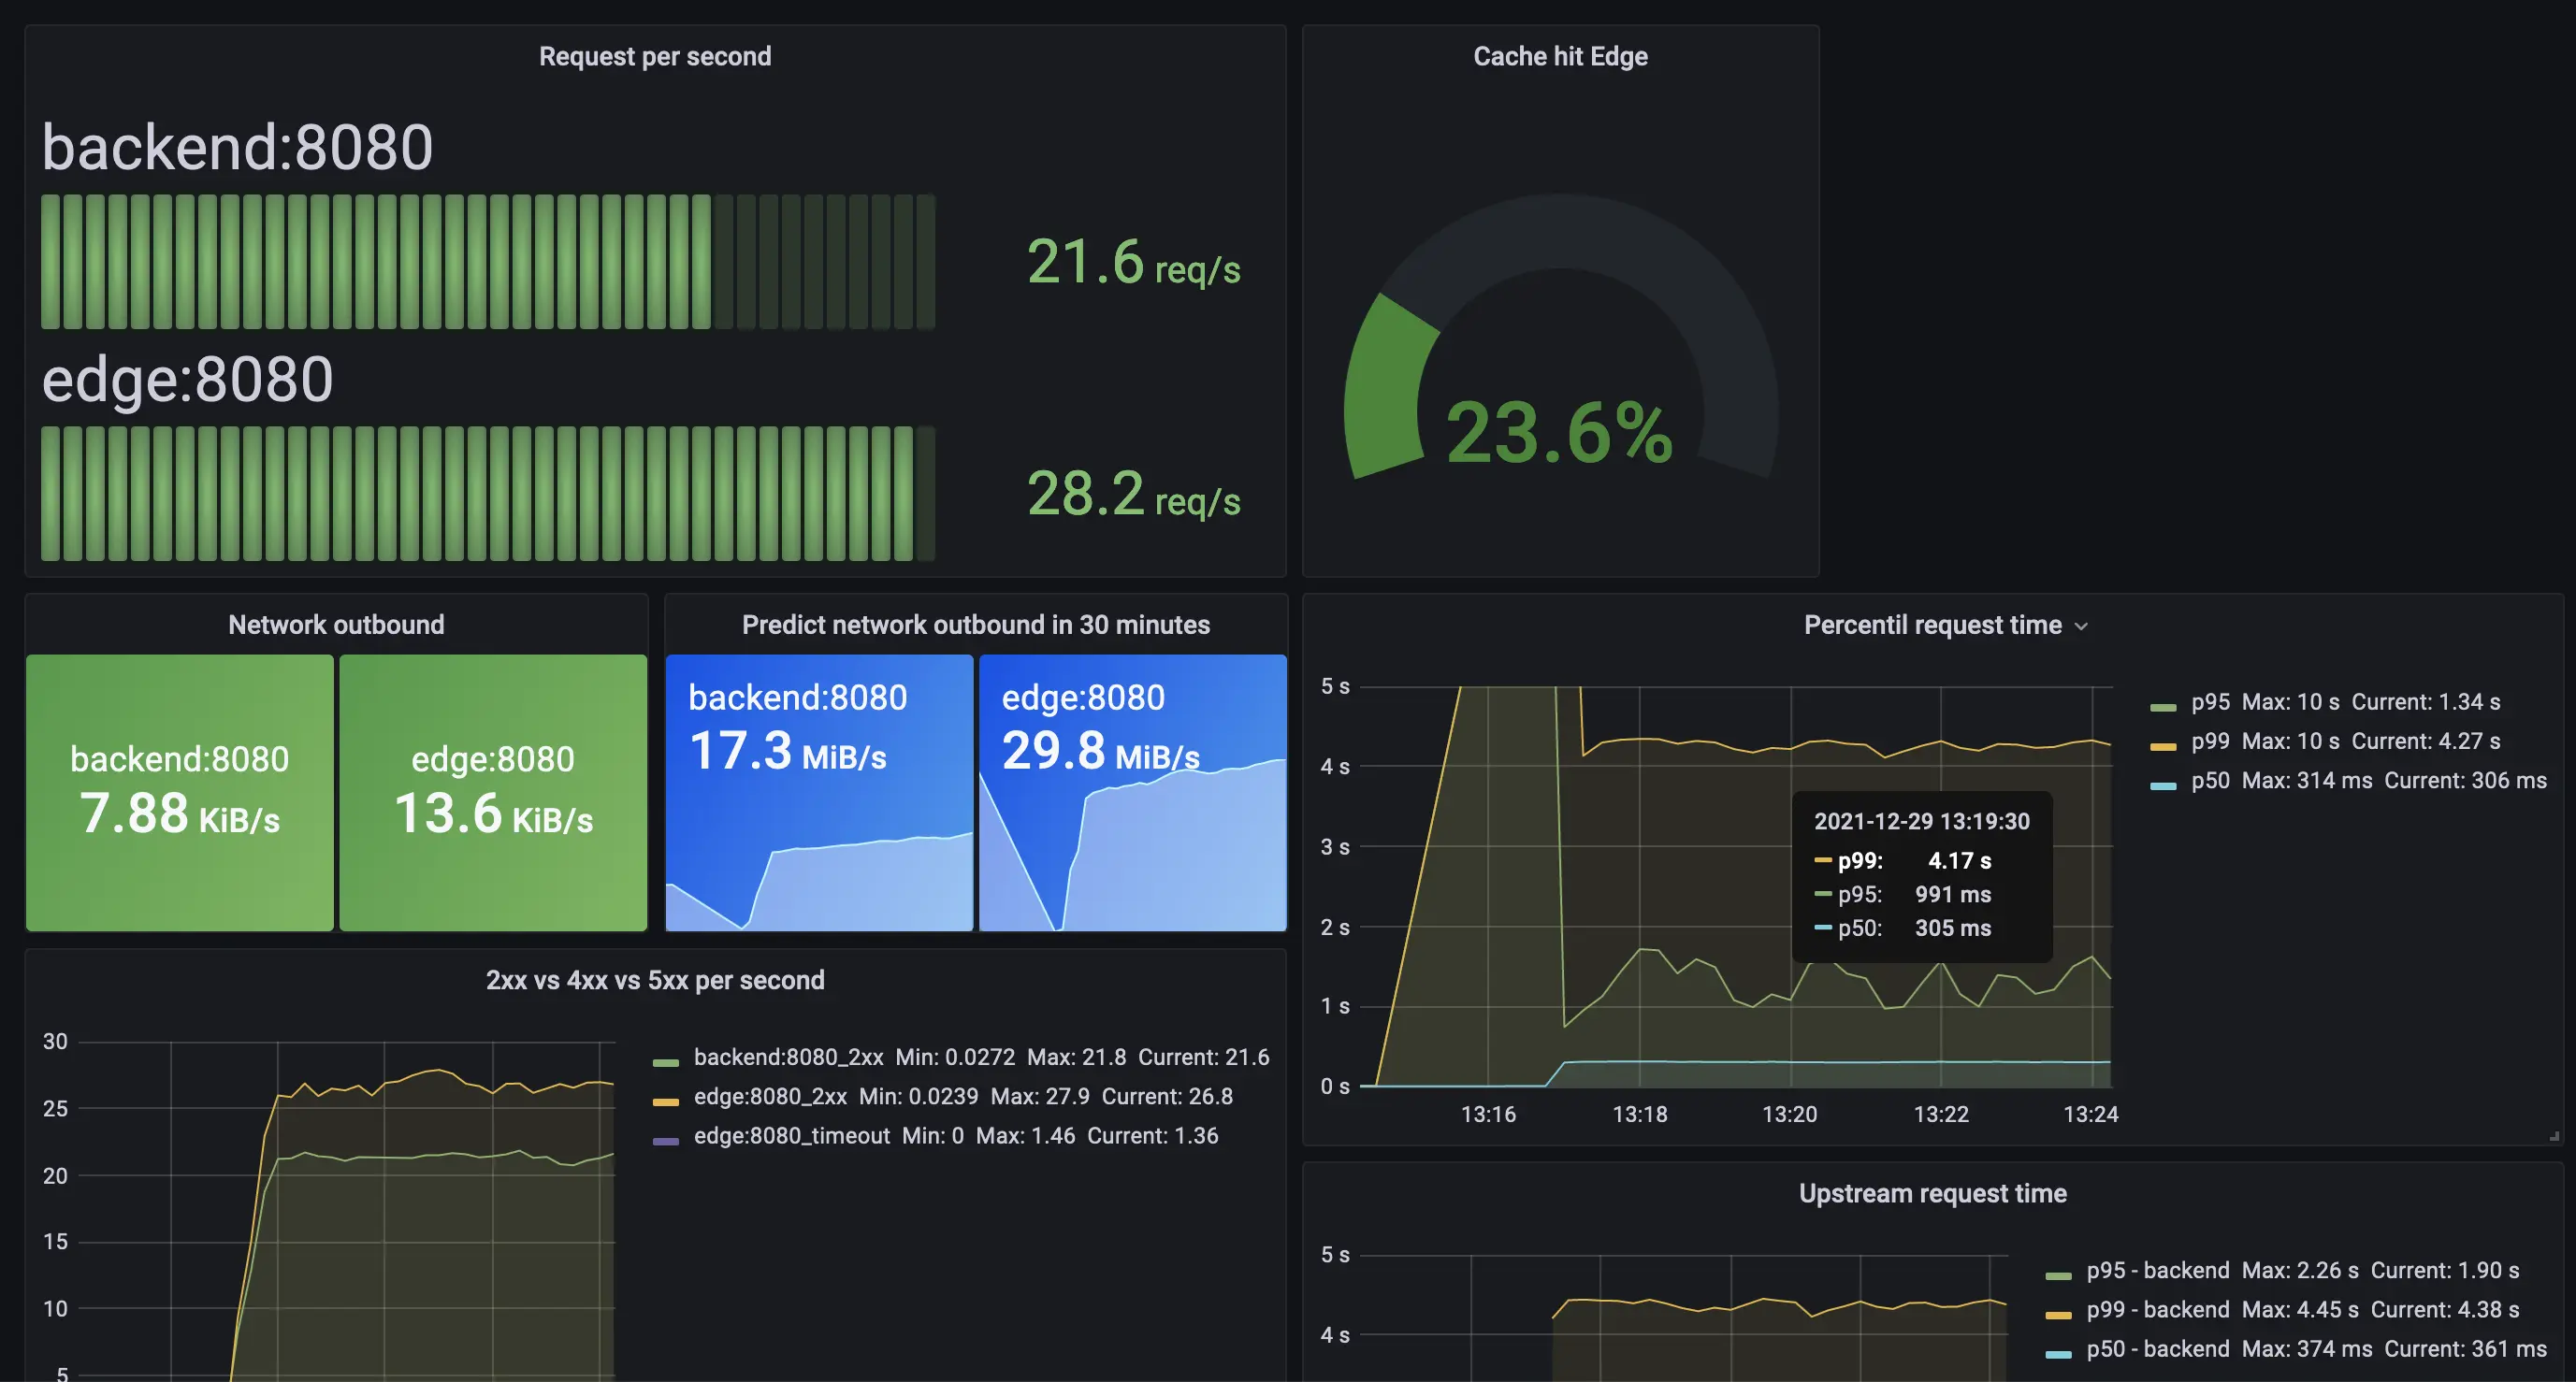
We also noticed that the cache hit went down significantly (23%), and many more requests leaked to the backend.
What if instead we increase the caching expire to a complete minute?!
request = function()
  local item = "item_" .. random(1, 100)

  return wrk.format(nil, "/" .. item .. ".ext?max_age=60")
end
Run the tests, and the result now is: 45k requests with 551 errors.
Running 10m test @ http://localhost:8081
  2 threads and 10 connections
  Thread Stats   Avg      Stdev     Max   +/- Stdev
    Latency   196.27ms  223.43ms   1.79s    84.74%
    Req/Sec    42.31     34.80   242.00     78.01%
  Latency Distribution
     50%   79.67ms
     75%  321.06ms
     90%  494.41ms
     99%    1.01s
  45695 requests in 10.00m, 18.79MB read
  Non-2xx or 3xx responses: 551
Requests/sec:     76.15
Transfer/sec:     32.06KB
We see a much better cache efficiency (80% vs 23%) and throughput (45k vs 16k requests).
Heads up: caching for longer helps improve performance but at the cost of stale content.
Using default configurations for Nginx, linux, and others will be sufficient for many small workloads. But when you're goal is more ambitious, you will inevitably need to fine-tune the CDN for your need.
The process of fine-tuning a web server is gigantic. It goes from managing how nginx/Linux process sockets, to linux network queuing, how io affects performance, among other aspects. There is a lot of symbiosis between the application and OS with direct implications to the performance, for instance saving user land switch context with ktls.
You'll be reading a lot of man pages, mostly tweaking timeouts and buffers. The test loop can help you build confidence in your ideas, let's see.
- You have a hypothesis or have observed something weird and want to test a parameter value
- stick to a single set of related parameters each time
- Set the new value
- Run the tests
- Check results against the same server with the old parameter
Heads up: doing tests locally is fine for learning, but most of the time you'll only trust your production results. Be prepared to do a partial deployment, compare old system/config to newer test parameters.
Did you notice that the errors were all related to timeout? It seems that the backend is taking longer to respond than what the edge is willing to wait.
edge_1 | 2021/12/29 11:52:45 [error] 8#8: *3 upstream timed out (110: Operation timed out) while reading response header from upstream, client: 172.25.0.1, server: , request: "GET /item_34.ext HTTP/1.1", upstream: "http://172.25.0.3:8080/item_34.ext", host: "localhost:8081"
To solve this problem we can try to increase the proxy timeouts. We're also using a neat directive proxy_cache_use_stale that serves stale content when nginx is dealing with errors, timeout, or even updating the cache.
proxy_cache_lock_timeout 2s;
proxy_read_timeout 2s;
proxy_send_timeout 2s;
proxy_cache_use_stale error timeout updating;
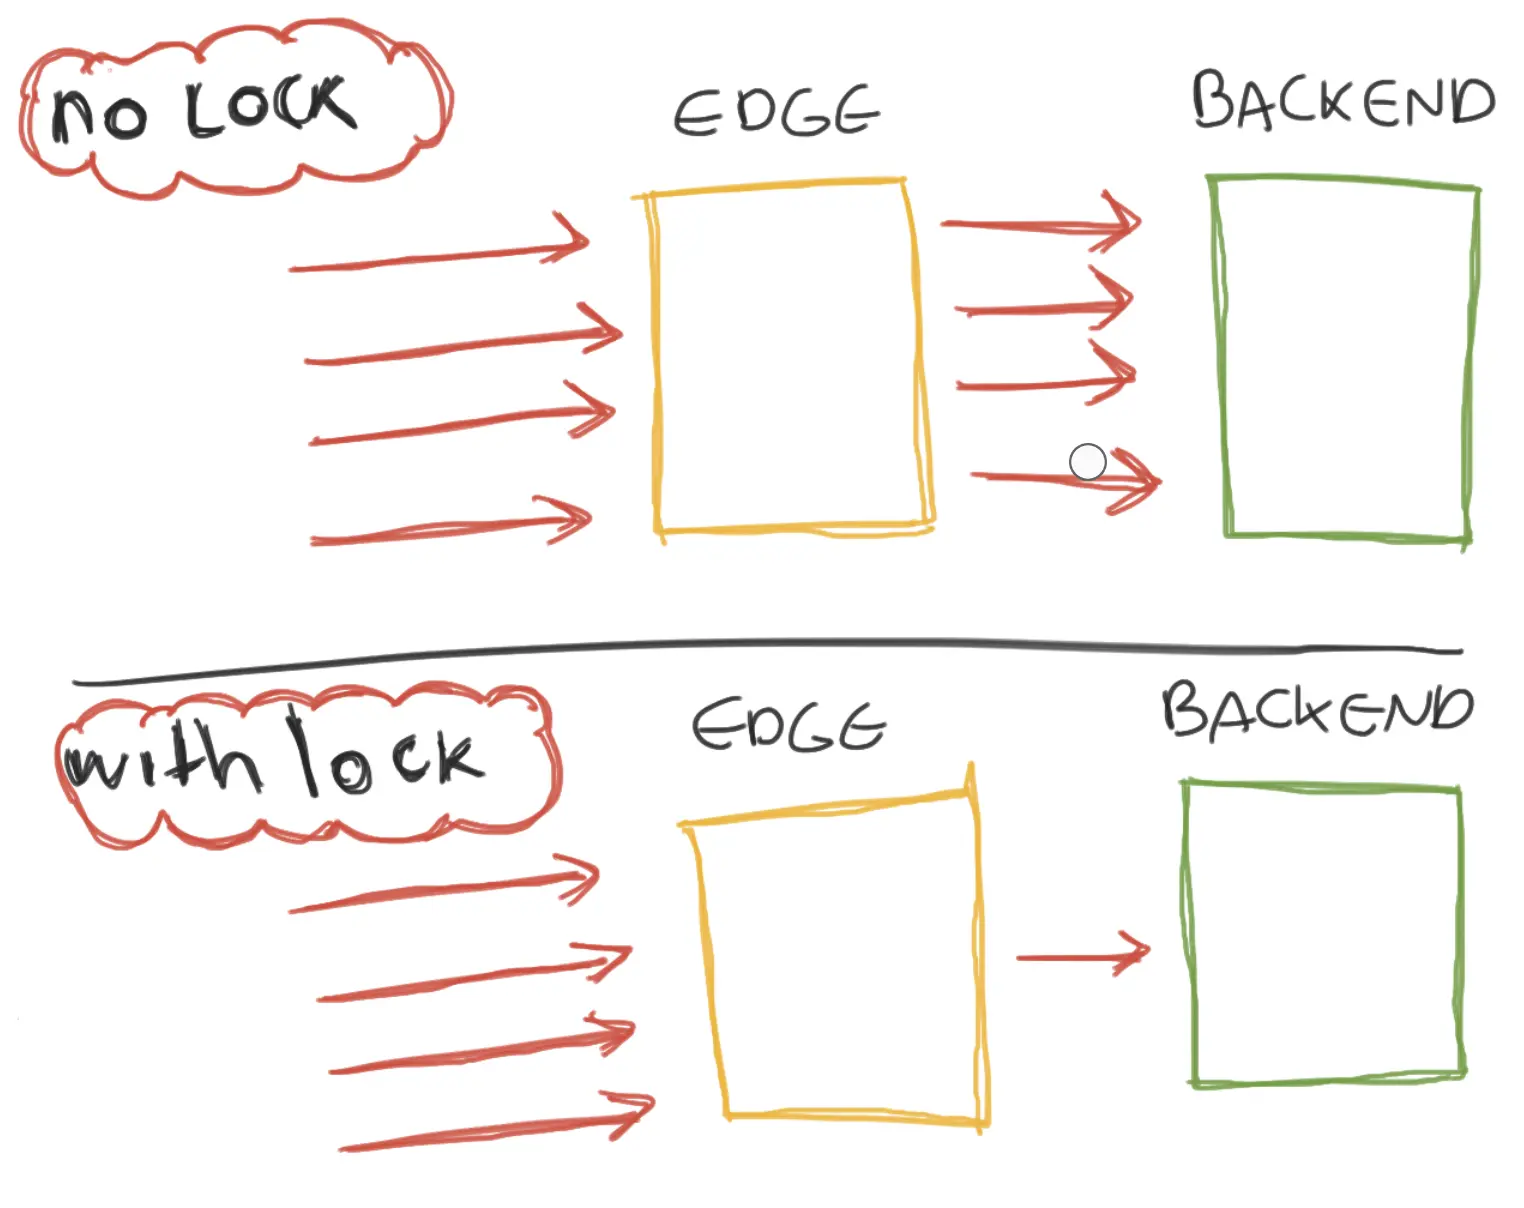
While we were reading about proxy caching, something catch our attention. There's a directive called proxy_cache_lock that collapses multiple user requests for the same content into a single request going upstream to fetch the content at a time. This is very often known as coalescing.
proxy_cache_lock onRunning the tests we observed that we decrease the timeout errors but we also got less throughput. Why? Maybe it's because of lock contention. The big benefit of this feature it's to avoid the thundering herd in the backend. Traffic went down from 6k to 3k and requests from 16 to 8.
We've been running load testing assuming a normal distribution but that's far from reality. What we might see in production is most of the requests will be towards a few items. To closer simulate that, we'll tweak our code to randomly pick a number from 1 to 100 and then decide if it's a popular item or not.
local popular_percentage = 96 -- 96% of users are requesting top 5 content
local popular_items_quantity = 5 -- top content quantity
local max_total_items = 200 -- total items clientes are requesting

request = function()
  local is_popular = random(1, 100) <= popular_percentage
  local item = ""

  if is_popular then -- if it's popular let's pick one of the top content
    item = "item-" .. random(1, popular_items_quantity)
  else -- otherwise let's pick any resting items
    item = "item-" .. random(popular_items_quantity + 1, popular_items_quantity + max_total_items)
  end

  return wrk.format(nil, "/path/" .. item .. ".ext")
endHeads-up: we could model the long tail using a formula, but for the purpose of this repo, this extrapolation might be good enough.
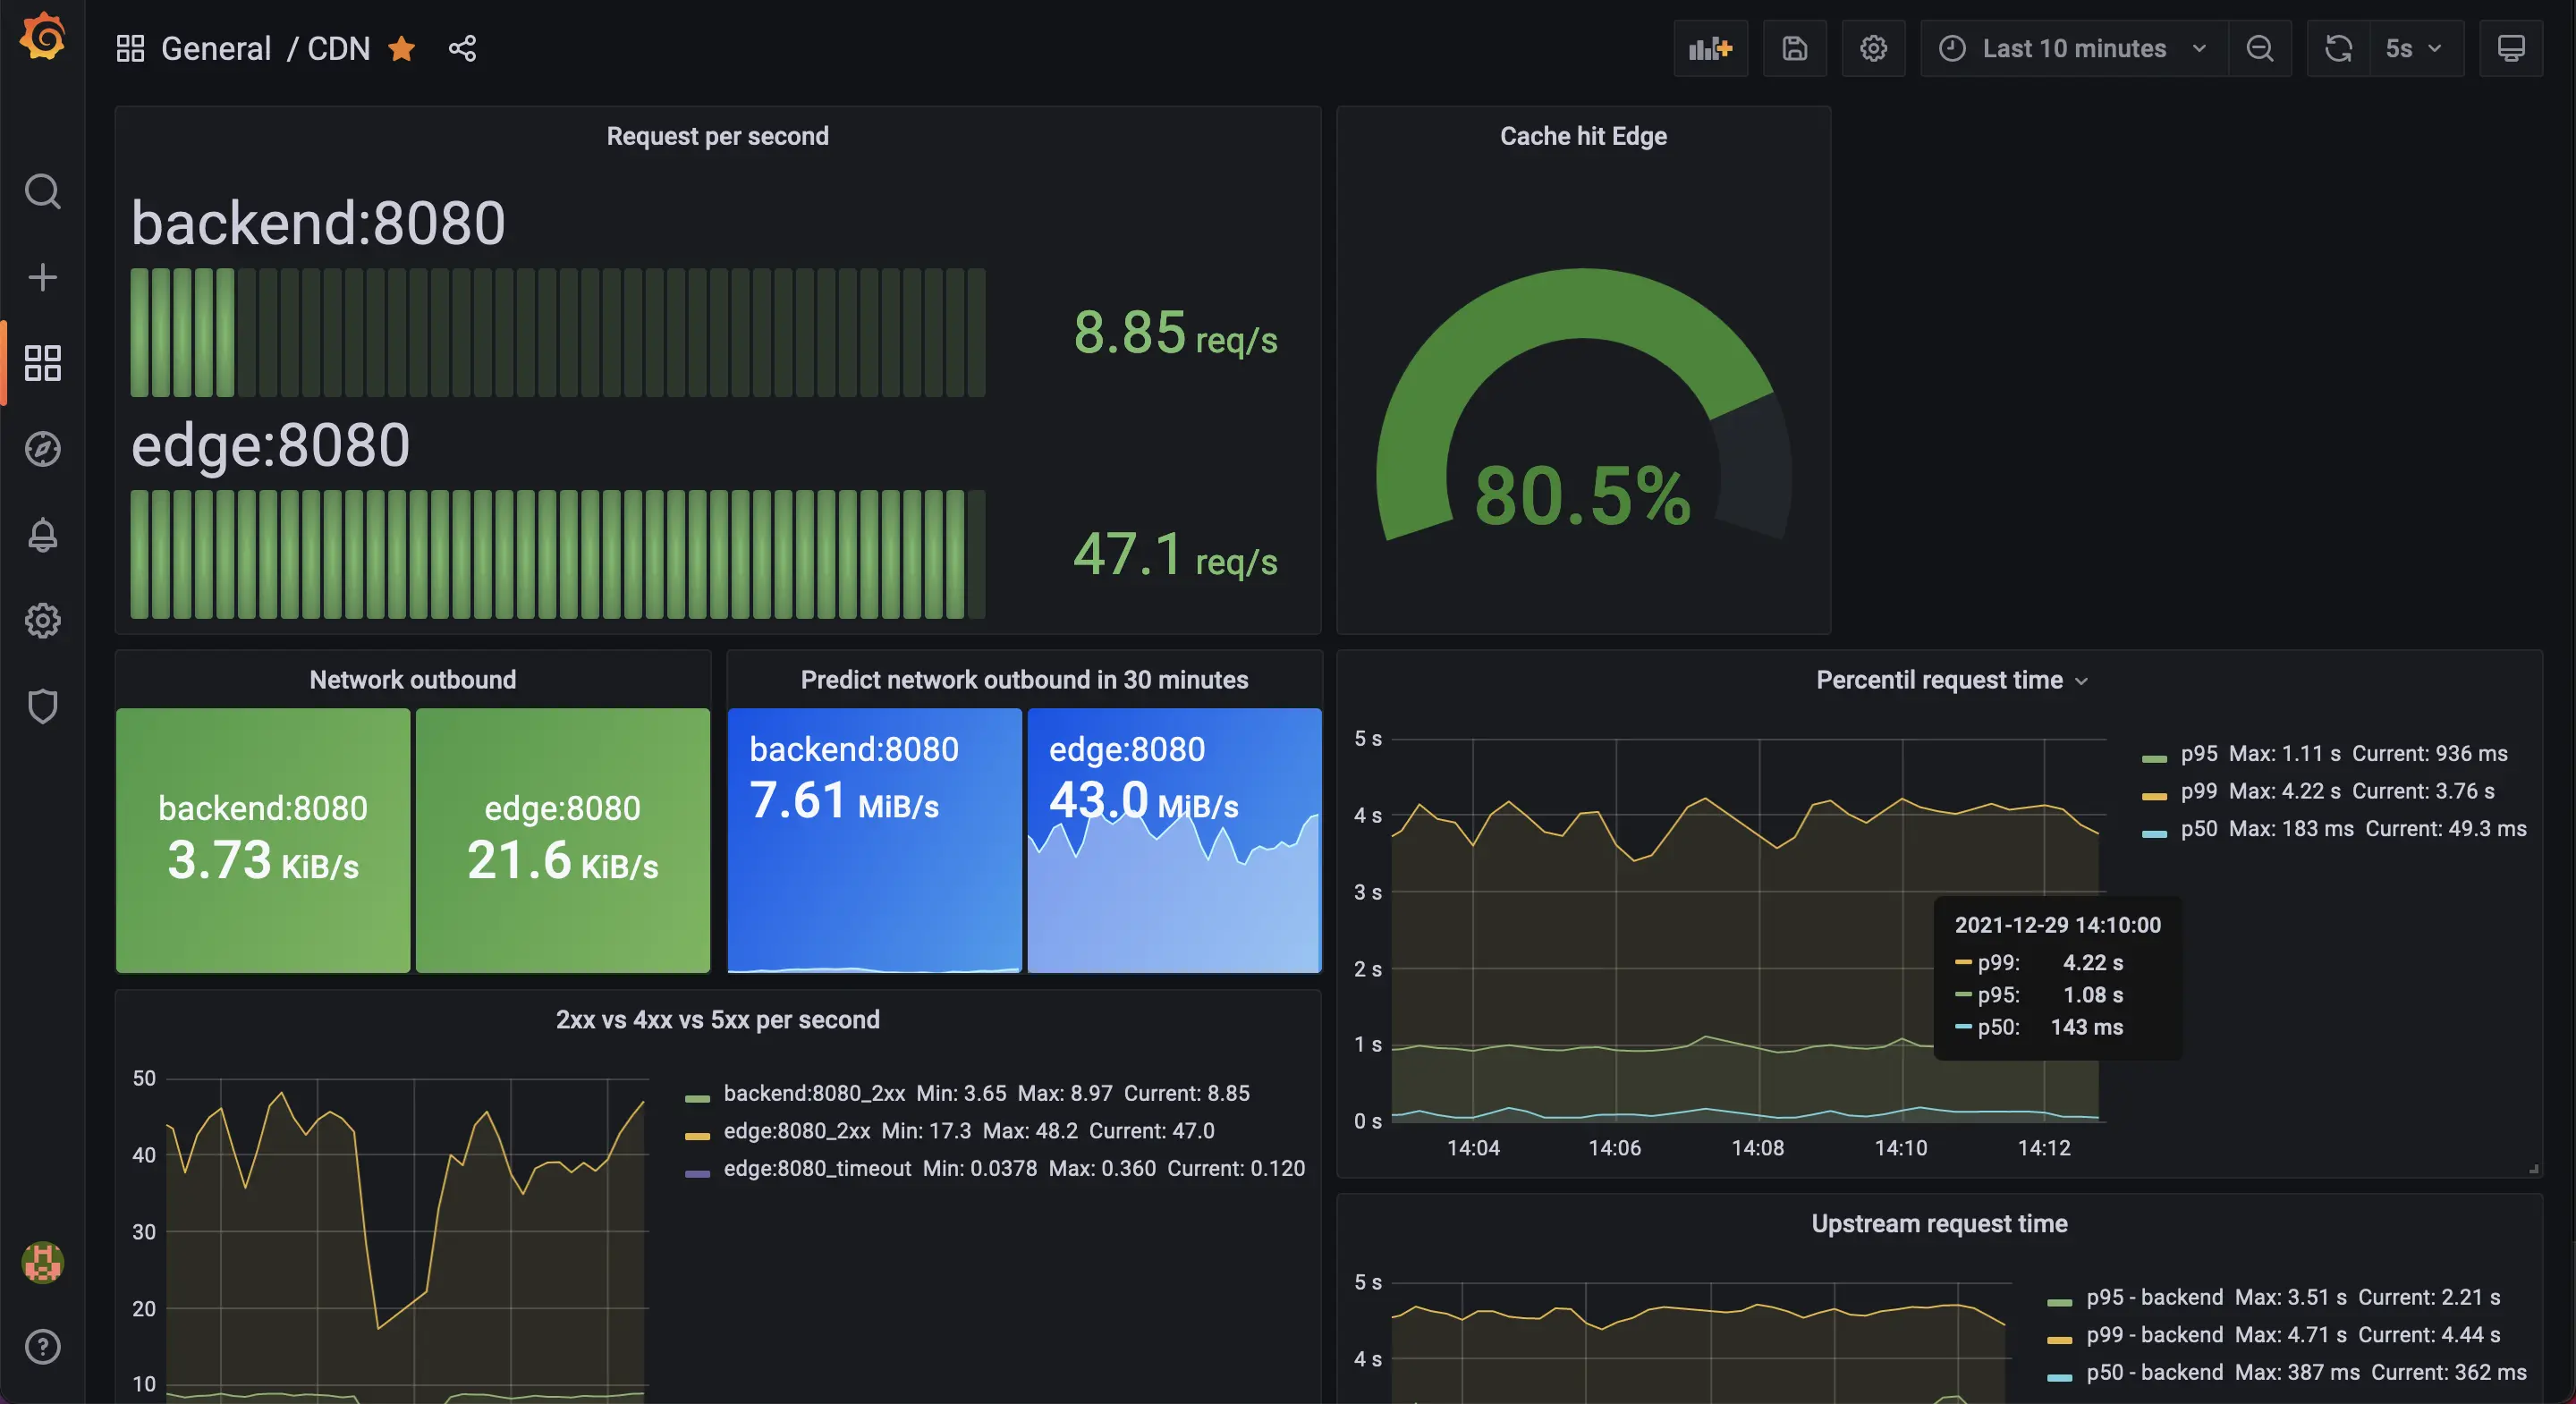
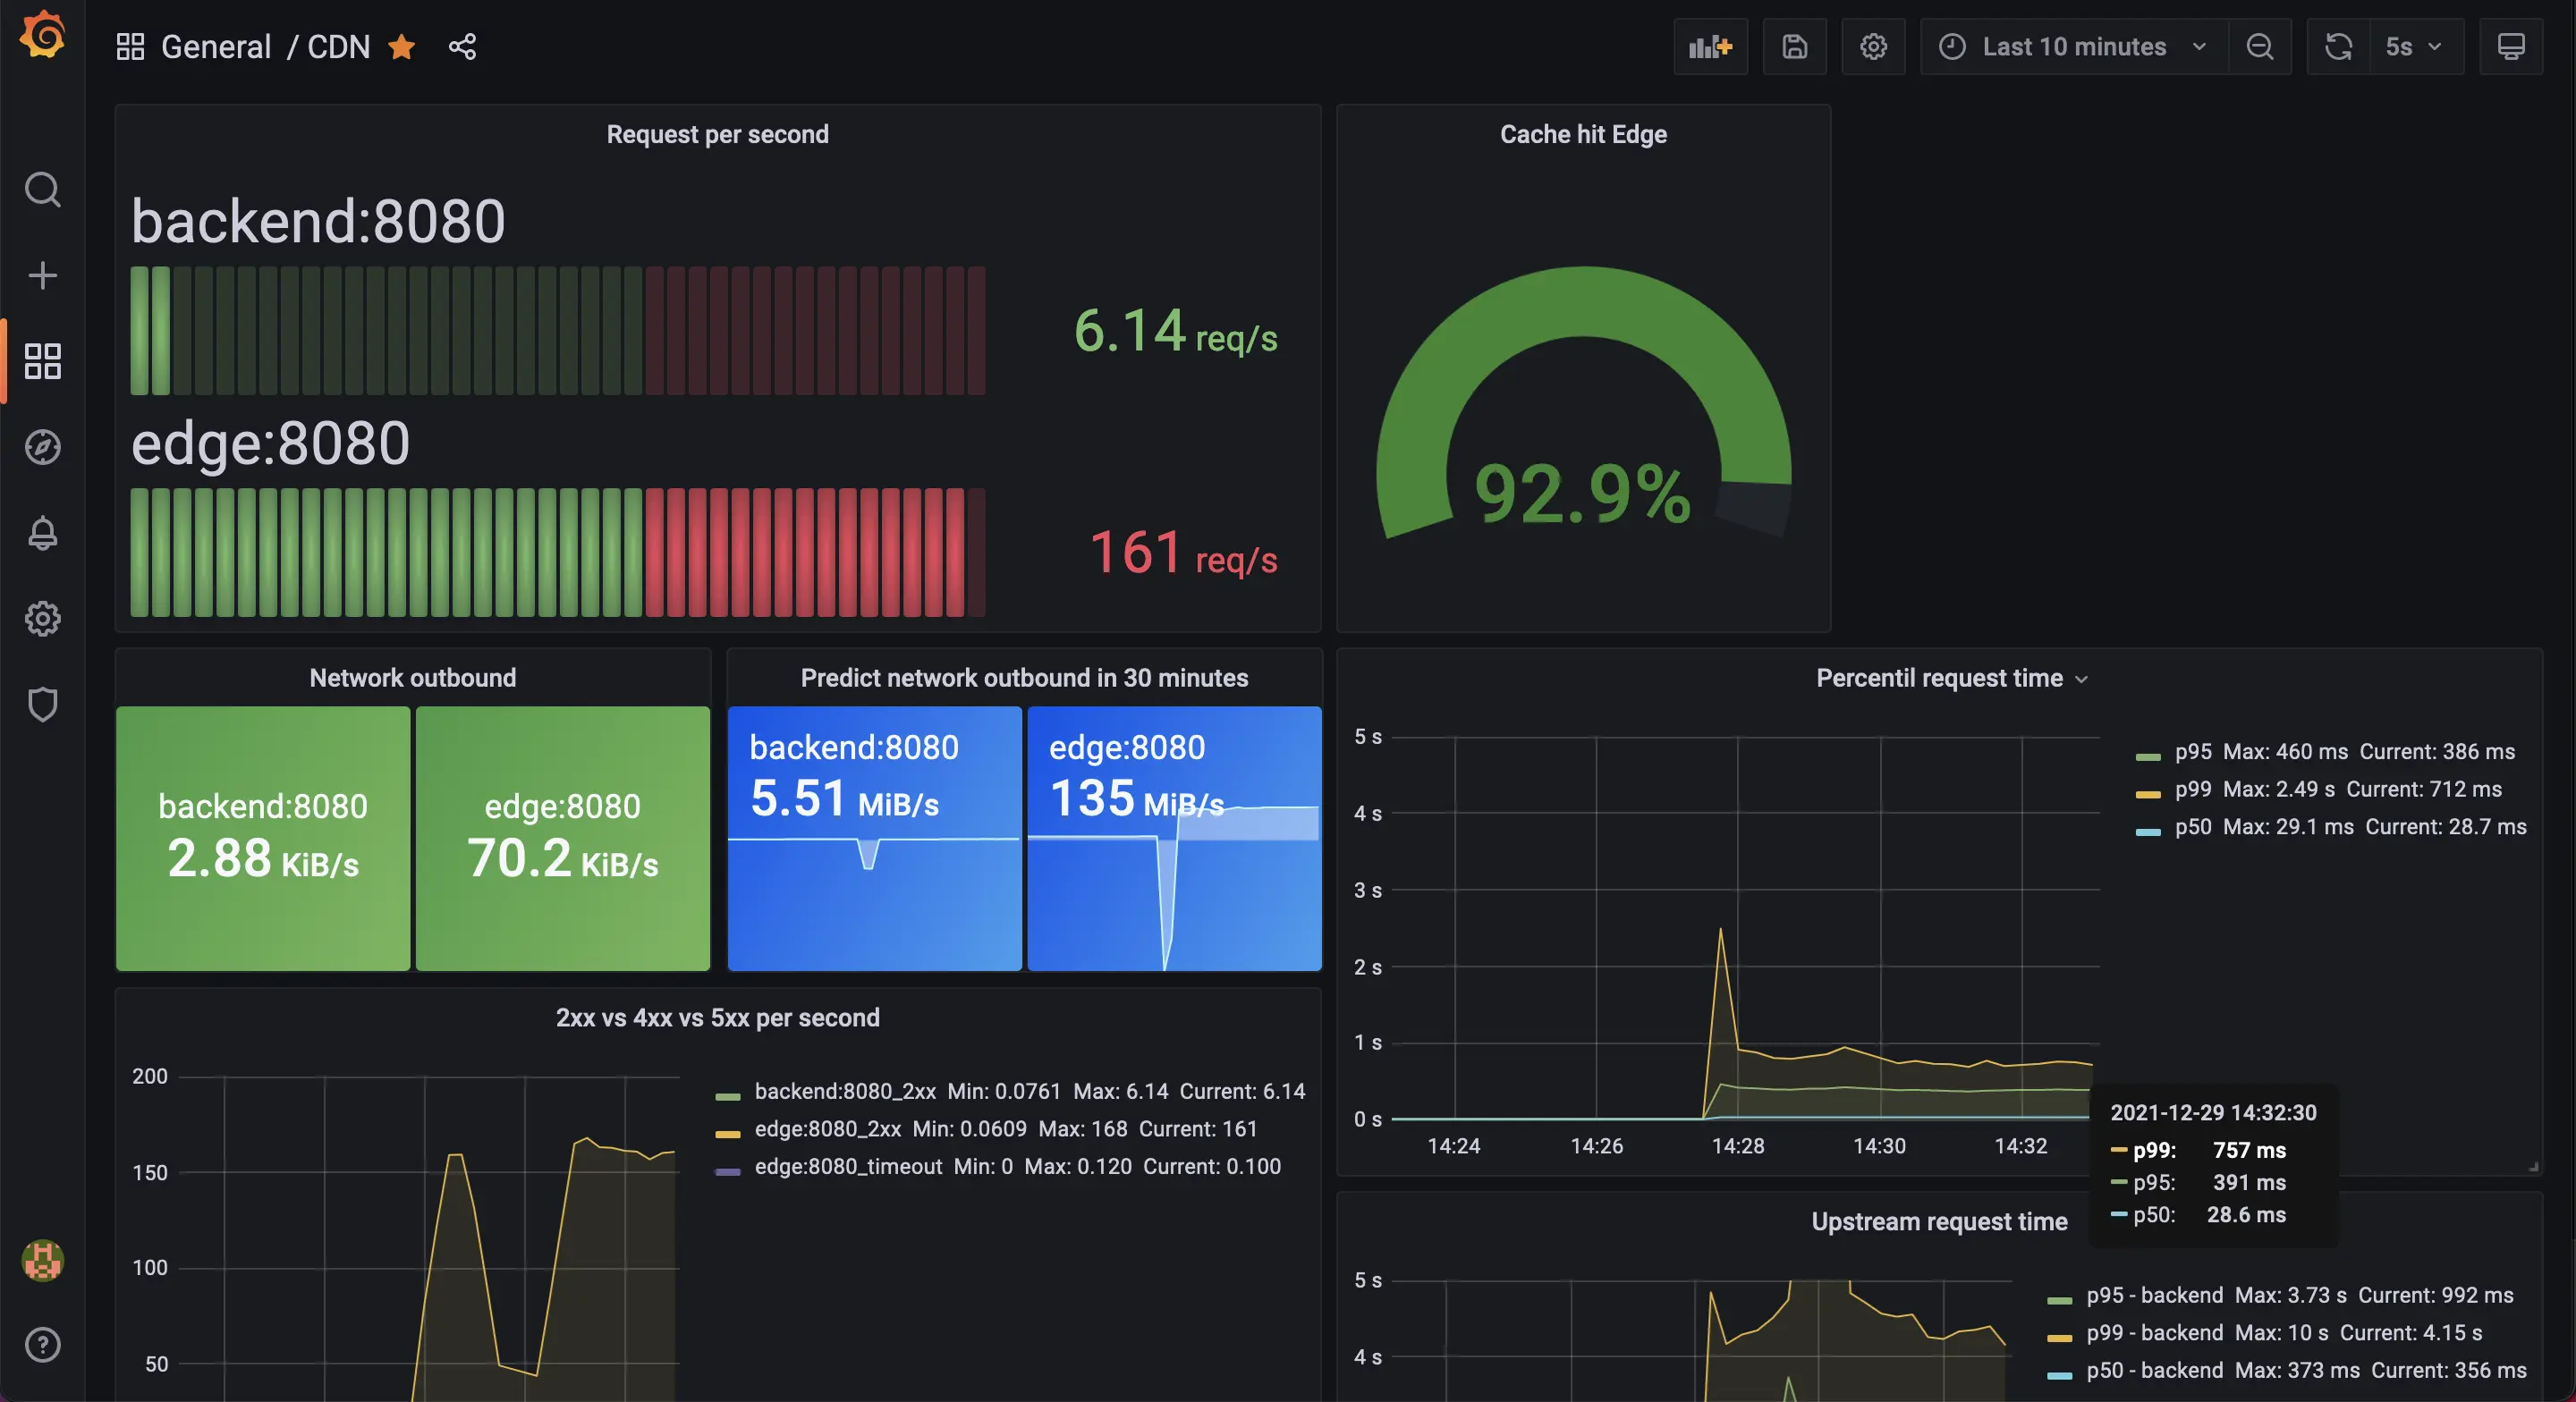
Now, let's test again with proxy_cache_lock off and on.
It's pretty close, even though the lock off is still better marginally. This feature might go to production to show if it's worthy or not.
Heads up: the
proxy_cache_lock_timeoutis dangerous but necessary, if the configured time has passed, all the requests will go to the backend.
We've been testing a single edge but in reality, there will be hundreds of nodes. Having more edge nodes is necessary for scalability, resilience and also to provide closer to user responses. Introducing multiple nodes also introduces another challenge, clients need somehow to figure out which node to fetch the content.
There are many ways to overcome this complication, and we'll try to explore some of them.
A load balancer will spread the client's requests among all the edges.
Round-robin is a balancing policy that takes an ordered list of edges and goes serving requests picking a server each time and wrapping around when the server list ends.
# on nginx, if we do not specify anything the default policy is weighted round-robin
# http://nginx.org/en/docs/http/ngx_http_upstream_module.html#upstream
upstream backend {
  server edge:8080;
  server edge1:8080;
  server edge2:8080;
}

server {
  listen 8080;

  location / {
    proxy_pass http://backend;
    add_header X-Edge LoadBalancer;
  }
}
What's good about round-robin? The requests are shared almost equally to all servers. There might be slower servers or responses which may enqueue lots of requests. There is the least_conn that also considers many connections.
What's not good about it? It's not caching-aware, meaning multiple clients will face higher latencies because they're asking uncached servers.
# demo time
git checkout 4.0.0
docker-compose up
./load_test.sh
Heads up: the load balancer itself here plays a single point of failure role. Facebook has a great talk explaining how they created a load balancer that is resilient, maintainable, and scalable.
Knowing that caching awareness is important for a CDN, it's hard to use round-robin as it is. There is a balancing method known as consistent hashing which tries to solve this problem by choosing a signal (the uri for instance) and mapping it to a hash table, consistently sending all the requests to the same server.
There is a directive for that on nginx as well, it's called hash.
upstream backend {
  hash $request_uri consistent;
  server edge:8080;
  server edge1:8080;
  server edge2:8080;
}

server {
  listen 8080;

  location / {
    proxy_pass http://backend;
    add_header X-Edge LoadBalancer;
  }
}
What's good about consistent hashing? It enforces a policy that will increase the chances of a cache hit.
What's not good about it? Imagine a single content (video, game) is peaking and now we have a problem of a small number of servers to respond to most of the clients.
Heads up Consistent Hashing With Bounded Load born to solve this problem.
# demo time
git checkout 4.0.1
docker-compose up
./load_test.sh
Heads up Initially I used a lua library because I thought the consistent hashing was only available for comercial nginx.
There are at least two problems (beyond it being a SPoF) with a load balancer:
- Network egress - the input/output bandwidth capacity of the load balancer must be at least sum of all its servers.
- Distributed edges - there might be nodes geographically sparsed that impose a hard time for a load balancer.
Many of the problems we saw on the load balancer section are about network reachability. Here we're going to discuss some of the ways we can tackle that, and each one with their ups and downs.
We could introduce an API (cdn routing), all clients will only know where to find a content (a specific edge node) after asking for this API. Clients might need to deal with failover.
Heads up solving on the software side, one could mix the best of all worlds: start balacing using
consistent hashingand then when a given content becames popular uses a better natural distribution
We could use DNS for that. It looks pretty similar to the API but we're going to rely on dns caching ttl for that. Failover on this case is even harder.
We could also use a single Domain/IP, announcing the IP in all places we have nodes, leave the network routing protocols to find the closest node for a given user.
We didn't talk about lots of important aspects of a CDN such as:
- Peering - CDNs will host their nodes/content on ISPs, public peering places and private places.
- Security - CDNs suffer a lot of attacks, DDoS, caching poisoning, and others.
- Caching strategies - in some cases, instead of pulling the content from the backend, the backend pushes the content to the edge.
- Tenants/Isolation - CDNs will host multiple clients on the same nodes, isolation is a must.
- metrics, caching area, configurations (caching policies, backend), and etc.
- Tokens - CDNs offer some form of token protection for content from unauthorized clients.
- Health check (fault detection) - stating whether a node is functional or not.
- HTTP Headers - very often (i.e. CORS) a client wants to add some headers (sometimes dynamically)
- Geoblocking - to save money or enforce contractual restrictions, your CDN will employ some policy regarding the locality of users.
- Purging - the ability to purge content from the cache.
- Throttling - limit the number of concurrent requests.
- Edge computing - ability to run code as a filter for the content hosted.
- and so on...
I hope you learned a little bit about how a CDN works. It's a complex endeavor, highly dependent on how close your nodes are to the clients and how well you can distribute the load, taking caching into consideration, to accommodate spikes and low traffics likewise.
