Spring Boot DataSource Decorator
Spring Boot auto-configuration for integration with
- P6Spy - adds ability to intercept and log sql queries, including interception of a most
Connection,StatementandResultSetmethods invocations - Datasource Proxy - adds ability to intercept all queries and
Connection,StatementandResultSetmethod calls - FlexyPool - adds connection pool metrics (jmx, codahale, dropwizard) and flexible strategies for adjusting pool size on demand
- Spring Cloud Sleuth - library for distributed tracing, if found in classpath enables jdbc connections and queries tracing (only with p6spy or datasource-proxy)
- Micrometer - metrics api, in combination with p6spy or datasource-proxy adds metrics for datasource.
Why need this?
Instead of using the library you can manually wrap your datasource, but using my library also provides
- ability to use
@ConfiguationProperties- custom or provided by Spring Boot (spring.datasource.hikari.*,spring.datasource.dbcp2.*) - ability to disable decorating by deployment property
decorator.datasource.enabled=true/false - just like with other auto-configurations you can configure any supported proxy provider library using
application.properties/ymlor define custom modules in the spring context - integration with Spring Cloud Sleuth and Micrometer
Quick Start
First you need to chose correct version:
- to use with Spring Boot 1.x.x - 1.3.5
- to use with Spring Boot 2.x.x - 1.4.3
Then add one of the starters to the classpath of a Spring Boot application and your datasources (auto-configured or custom) will be wrapped into one of a datasource proxy providers below.
If you want to use P6Spy
compile('com.github.gavlyukovskiy:p6spy-spring-boot-starter:1.4.3')<dependency>
<groupId>com.github.gavlyukovskiy</groupId>
<artifactId>p6spy-spring-boot-starter</artifactId>
<version>1.4.3</version>
</dependency>or Datasource Proxy:
compile('com.github.gavlyukovskiy:datasource-proxy-spring-boot-starter:1.4.3')<dependency>
<groupId>com.github.gavlyukovskiy</groupId>
<artifactId>datasource-proxy-spring-boot-starter</artifactId>
<version>1.4.3</version>
</dependency>or FlexyPool
compile('com.github.gavlyukovskiy:flexy-pool-spring-boot-starter:1.4.3')<dependency>
<groupId>com.github.gavlyukovskiy</groupId>
<artifactId>flexy-pool-spring-boot-starter</artifactId>
<version>1.4.3</version>
</dependency>NOTE: To use FlexyPool with connection pool different than HikariCP you must add PoolAdapter for your particular connection pool.
NOTE 2: You can use all of them if you want, if so decorating order is next:
P6DataSource -> ProxyDataSource -> FlexyPoolDataSource -> DataSource
P6Spy
After adding p6spy starter you'll start getting all sql queries in the logs:
2017-06-07 21:42:08.120  INFO 5456 --- [ool-1-worker-57] p6spy                                    : #1496860928120 | took 0ms | statement | connection 0|SELECT NOW()
;
2017-06-07 21:51:07.802  INFO 5456 --- [ool-1-worker-50] p6spy                                    : #1496861467802 | took 0ms | statement | connection 1|SELECT NOW()
;
2017-06-07 21:51:07.803  INFO 5456 --- [ool-1-worker-43] p6spy                                    : #1496861467803 | took 0ms | statement | connection 2|SELECT NOW()
;
2017-06-07 21:51:08.806  INFO 5456 --- [ool-1-worker-36] p6spy                                    : #1496861468806 | took 0ms | statement | connection 3|SELECT NOW()
;
All beans of type JdbcEventListener are registered in P6Spy:
@Bean
public JdbcEventListener myListener() {
    return new JdbcEventListener() {
        @Override
        public void onAfterGetConnection(ConnectionInformation connectionInformation, SQLException e) {
            System.out.println("got connection");
        }

        @Override
        public void onAfterConnectionClose(ConnectionInformation connectionInformation, SQLException e) {
            System.out.println("connection closed");
        }
    };
}
This done by adding RuntimeListenerSupportFactory into P6Spy modulelist, overriding this property will cause to not registering factory thus listeners will not be applied
You can configure small set of parameters in your application.properties:
# Register P6LogFactory to log JDBC events
decorator.datasource.p6spy.enable-logging=true
# Use com.p6spy.engine.spy.appender.MultiLineFormat instead of com.p6spy.engine.spy.appender.SingleLineFormat
decorator.datasource.p6spy.multiline=true
# Use logging for default listeners [slf4j, sysout, file]
decorator.datasource.p6spy.logging=slf4j
# Log file to use (only with logging=file)
decorator.datasource.p6spy.log-file=spy.log
# Custom log format, if specified com.p6spy.engine.spy.appender.CustomLineFormat will be used with this log format
decorator.datasource.p6spy.log-format=
Also you can configure P6Spy manually using one of available configuration methods. For more information please refer to the P6Spy Configuration Guide
Datasource Proxy
After adding datasource-proxy starter you'll start getting all sql queries in the logs with level DEBUG and slow sql queries with level WARN:
2017-06-07 21:58:06.630  DEBUG 8492 --- [ool-1-worker-57] n.t.d.l.l.SLF4JQueryLoggingListener      :
Name:, Time:0, Success:True
Type:Statement, Batch:False, QuerySize:1, BatchSize:0
Query:["SELECT NOW()"]
Params:[]
2017-06-07 21:58:06.630  DEBUG 8492 --- [ool-1-worker-43] n.t.d.l.l.SLF4JQueryLoggingListener      :
Name:, Time:0, Success:True
Type:Statement, Batch:False, QuerySize:1, BatchSize:0
Query:["SELECT NOW()"]
Params:[]
2017-06-07 21:58:06.630  DEBUG 8492 --- [ool-1-worker-50] n.t.d.l.l.SLF4JQueryLoggingListener      :
Name:, Time:0, Success:True
Type:Statement, Batch:False, QuerySize:1, BatchSize:0
Query:["SELECT NOW()"]
Params:[]
2017-06-07 22:10:50.478  WARN 8492 --- [pool-1-thread-1] n.t.d.l.logging.SLF4JSlowQueryListener   :
Name:, Time:0, Success:False
Type:Statement, Batch:False, QuerySize:1, BatchSize:0
Query:["SELECT SLEEP(301000)"]
Params:[]
All beans of type QueryExecutionListener are registered in ProxyDataSourceBuilder, as well you can use Spring Context for ParameterTransformer and QueryTransformer.:
@Bean
public QueryExecutionListener queryExecutionListener() {
    return new QueryExecutionListener() {
        @Override
        public void beforeQuery(ExecutionInfo execInfo, List<QueryInfo> queryInfoList) {
            System.out.println("beforeQuery");
        }

        @Override
        public void afterQuery(ExecutionInfo execInfo, List<QueryInfo> queryInfoList) {
            System.out.println("afterQuery");
        }
    };
}

@Bean
public ParameterTransformer parameterTransformer() {
    return new MyParameterTransformer();
}

@Bean
public QueryTransformer queryTransformer() {
    return new MyQueryTransformer();
}
You can configure logging, query/slow query listeners and more using your application.properties:
# One of logging libraries (slf4j, jul, common, sysout)
decorator.datasource.datasource-proxy.logging=slf4j

decorator.datasource.datasource-proxy.query.enable-logging=true
decorator.datasource.datasource-proxy.query.log-level=debug
# Logger name to log all queries, default depends on chosen logging, e.g. net.ttddyy.dsproxy.listener.logging.SLF4JQueryLoggingListener
decorator.datasource.datasource-proxy.query.logger-name=

decorator.datasource.datasource-proxy.slow-query.enable-logging=true
decorator.datasource.datasource-proxy.slow-query.log-level=warn
decorator.datasource.datasource-proxy.slow-query.logger-name=
# Number of seconds to consider query as slow and log it
decorator.datasource.datasource-proxy.slow-query.threshold=300

decorator.datasource.datasource-proxy.multiline=true
decorator.datasource.datasource-proxy.json-format=false
# Enable Query Metrics
decorator.datasource.datasource-proxy.count-query=false
Flexy Pool
If the flexy-pool-spring-boot-starter is added to the classpath your datasource will be wrapped to the FlexyPoolDataSource.
With default setting you will start getting messages about acquiring and leasing connections:
2017-07-13 01:31:02.575  INFO 5432 --- [ool-1-worker-50] c.v.flexypool.FlexyPoolDataSource        : Connection leased for 1500 millis, while threshold is set to 1000 in dataSource FlexyPoolDataSource
2017-07-13 01:31:03.143  WARN 5432 --- [ool-1-worker-51] PoolOnTimeoutConnectionAcquiringStrategy : Connection was acquired in 1502 millis, timeoutMillis is set to 500
2017-07-13 01:31:03.143  INFO 5432 --- [ool-1-worker-51] PoolOnTimeoutConnectionAcquiringStrategy : Pool size changed from previous value 10 to 11
You can declare bean MetricsFactory and besides of JMX metrics will be exported to the metrics provider and to the logs:
2017-07-13 02:07:04.265  INFO 5432 --- [rter-1-thread-1] c.v.f.metric.codahale.CodahaleMetrics    : type=HISTOGRAM, name=concurrentConnectionRequestsHistogram, count=4, min=0, max=1, mean=0.5, stddev=0.5, median=1.0, p75=1.0, p95=1.0, p98=1.0, p99=1.0, p999=1.0
2017-07-13 02:07:04.265  INFO 5432 --- [rter-1-thread-1] c.v.f.metric.codahale.CodahaleMetrics    : type=HISTOGRAM, name=concurrentConnectionsHistogram, count=4, min=0, max=1, mean=0.5, stddev=0.5, median=1.0, p75=1.0, p95=1.0, p98=1.0, p99=1.0, p999=1.0
2017-07-13 02:07:04.265  INFO 5432 --- [rter-1-thread-1] c.v.f.metric.codahale.CodahaleMetrics    : type=HISTOGRAM, name=maxPoolSizeHistogram, count=1, min=10, max=10, mean=10.0, stddev=0.0, median=10.0, p75=10.0, p95=10.0, p98=10.0, p99=10.0, p999=10.0
2017-07-13 02:07:04.265  INFO 5432 --- [rter-1-thread-1] c.v.f.metric.codahale.CodahaleMetrics    : type=HISTOGRAM, name=overflowPoolSizeHistogram, count=0, min=0, max=0, mean=0.0, stddev=0.0, median=0.0, p75=0.0, p95=0.0, p98=0.0, p99=0.0, p999=0.0
2017-07-13 02:07:04.265  INFO 5432 --- [rter-1-thread-1] c.v.f.metric.codahale.CodahaleMetrics    : type=HISTOGRAM, name=retryAttemptsHistogram, count=0, min=0, max=0, mean=0.0, stddev=0.0, median=0.0, p75=0.0, p95=0.0, p98=0.0, p99=0.0, p999=0.0
2017-07-13 02:07:04.265  INFO 5432 --- [rter-1-thread-1] c.v.f.metric.codahale.CodahaleMetrics    : type=TIMER, name=connectionAcquireMillis, count=2, min=0.0, max=39.0, mean=19.5, stddev=19.5, median=39.0, p75=39.0, p95=39.0, p98=39.0, p99=39.0, p999=39.0, mean_rate=0.07135042014375073, m1=0.02490778899904623, m5=0.006288975787638508, m15=0.002179432534806779, rate_unit=events/second, duration_unit=milliseconds
2017-07-13 02:07:04.265  INFO 5432 --- [rter-1-thread-1] c.v.f.metric.codahale.CodahaleMetrics    : type=TIMER, name=connectionLeaseMillis, count=2, min=3.0, max=7.0, mean=5.0, stddev=2.0, median=7.0, p75=7.0, p95=7.0, p98=7.0, p99=7.0, p999=7.0, mean_rate=0.07135743555785098, m1=0.02490778899904623, m5=0.006288975787638508, m15=0.002179432534806779, rate_unit=events/second, duration_unit=milliseconds
2017-07-13 02:07:04.265  INFO 5432 --- [rter-1-thread-1] c.v.f.metric.codahale.CodahaleMetrics    : type=TIMER, name=overallConnectionAcquireMillis, count=2, min=0.0, max=39.0, mean=19.5, stddev=19.5, median=39.0, p75=39.0, p95=39.0, p98=39.0, p99=39.0, p999=39.0, mean_rate=0.07135462550886962, m1=0.02490778899904623, m5=0.006288975787638508, m15=0.002179432534806779, rate_unit=events/second, duration_unit=milliseconds
All beans of type ConnectionAcquiringStrategyFactory are used to provide ConnectionAcquiringStrategy for the pool.
MetricsFactory and ConnectionProxyFactory beans can be used to customize metrics and connection decorators.
EventListener<? extends Event> beans can be registered to subscribe on events of flexy-pool (e.g. ConnectionAcquireTimeThresholdExceededEvent, ConnectionLeaseTimeThresholdExceededEvent).
You can configure your FlexyPoolDataSource by using bean FlexyPoolConfigurationBuilderCustomizer or properties:
# Increments pool size if connection acquire request has timed out
decorator.datasource.flexy-pool.acquiring-strategy.increment-pool.max-overflow-pool-size=15
decorator.datasource.flexy-pool.acquiring-strategy.increment-pool.timeout-millis=500

# Retries on getting connection
decorator.datasource.flexy-pool.acquiring-strategy.retry.attempts=2

# Enable metrics exporting to the JMX
decorator.datasource.flexy-pool.metrics.reporter.jmx.enabled=true
decorator.datasource.flexy-pool.metrics.reporter.jmx.auto-start=false

# Millis between two consecutive log reports
decorator.datasource.flexy-pool.metrics.reporter.log.millis=300000

# Enable logging and publishing ConnectionAcquireTimeThresholdExceededEvent when a connection acquire request has timed out
decorator.datasource.flexy-pool.threshold.connection.acquire=50
# Enable logging and publishing ConnectionLeaseTimeThresholdExceededEvent when a connection lease has exceeded the given time threshold
decorator.datasource.flexy-pool.threshold.connection.lease=1000

# Creates span for every connection and query. Works only with p6spy or datasource-proxy.
decorator.datasource.sleuth.enabled=true

# Enables datasource metrics using micrometer, disabled if you're using HikariCP in favor of its more accurate metrics
decorator.datasource.metrics.enabled=true
Spring Cloud Sleuth
With P6Spy span will be created for:
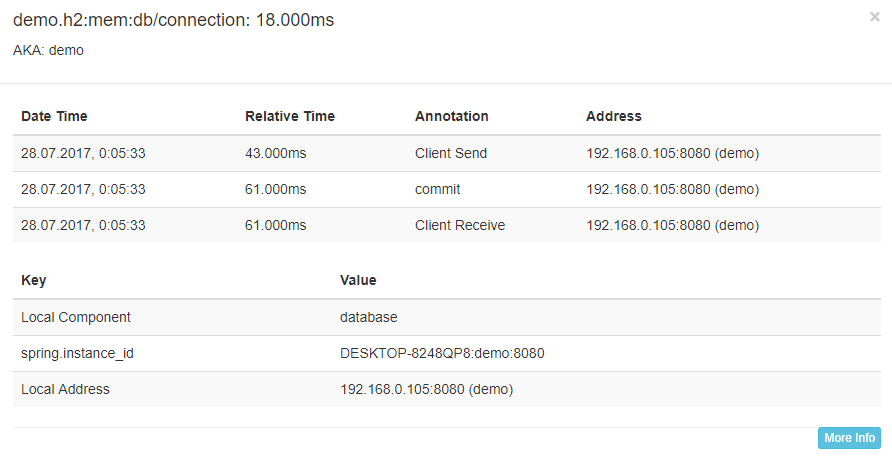
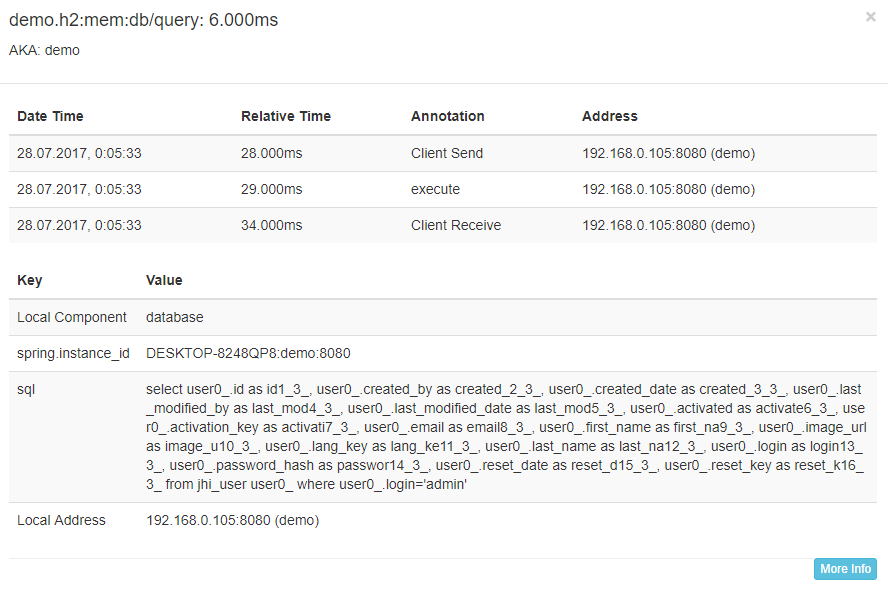
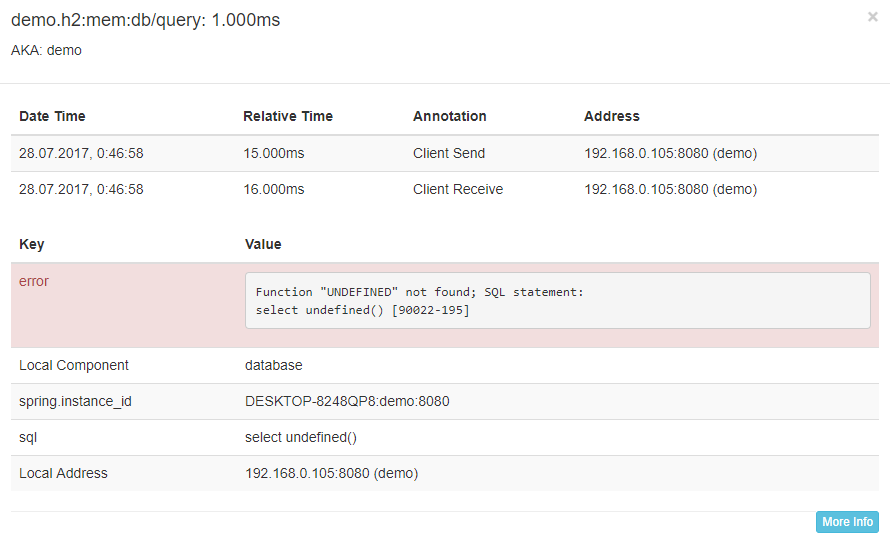
jdbc:/<dataSource>/connection- opening connection including events for commits and rollbacksjdbc:/<dataSource>/query- executing query including sql text and number of affected rows in the tagsjdbc:/<dataSource>/fetch- fetching result set data including number of rows in the tags
With Datasource Proxy span will be created for:
jdbc:/<dataSource>/connection- opening connection including events for commits and rollbacksjdbc:/<dataSource>/query- executing query including sql text (without parameters) and number of affected rows in the tagsjdbc:/<dataSource>/fetch- fetching result set data
Micrometer Exposes datasource metrics using micrometer api.
Metrics are aligned with Hikari metrics, but works for other pools as well.
datasource.connections.acquire- time to acquire connectiondatasource.connections.usage- time of connection usage, usually transaction timedatasource.connections.active- number of currently active connectionsdatasource.connections.pending- number of threads pending for free connectiondatasource.connections.created- number of total connections acquireddatasource.connections.failed- number of total connections acquisition fails
Custom Decorators
Custom data source decorators are supported through declaring beans of type DataSourceDecorator
@Bean
public DataSourceDecorator customDecorator() {
  return (beanName, dataSource) -> new DataSourceWrapper(dataSource);
}
Disable Decorating
If you want to disable decorating set decorator.datasource.excludeBeans with bean names you want to exclude or set decorator.datasource.enabled to false if you want to disable all decorators for all datasources.


