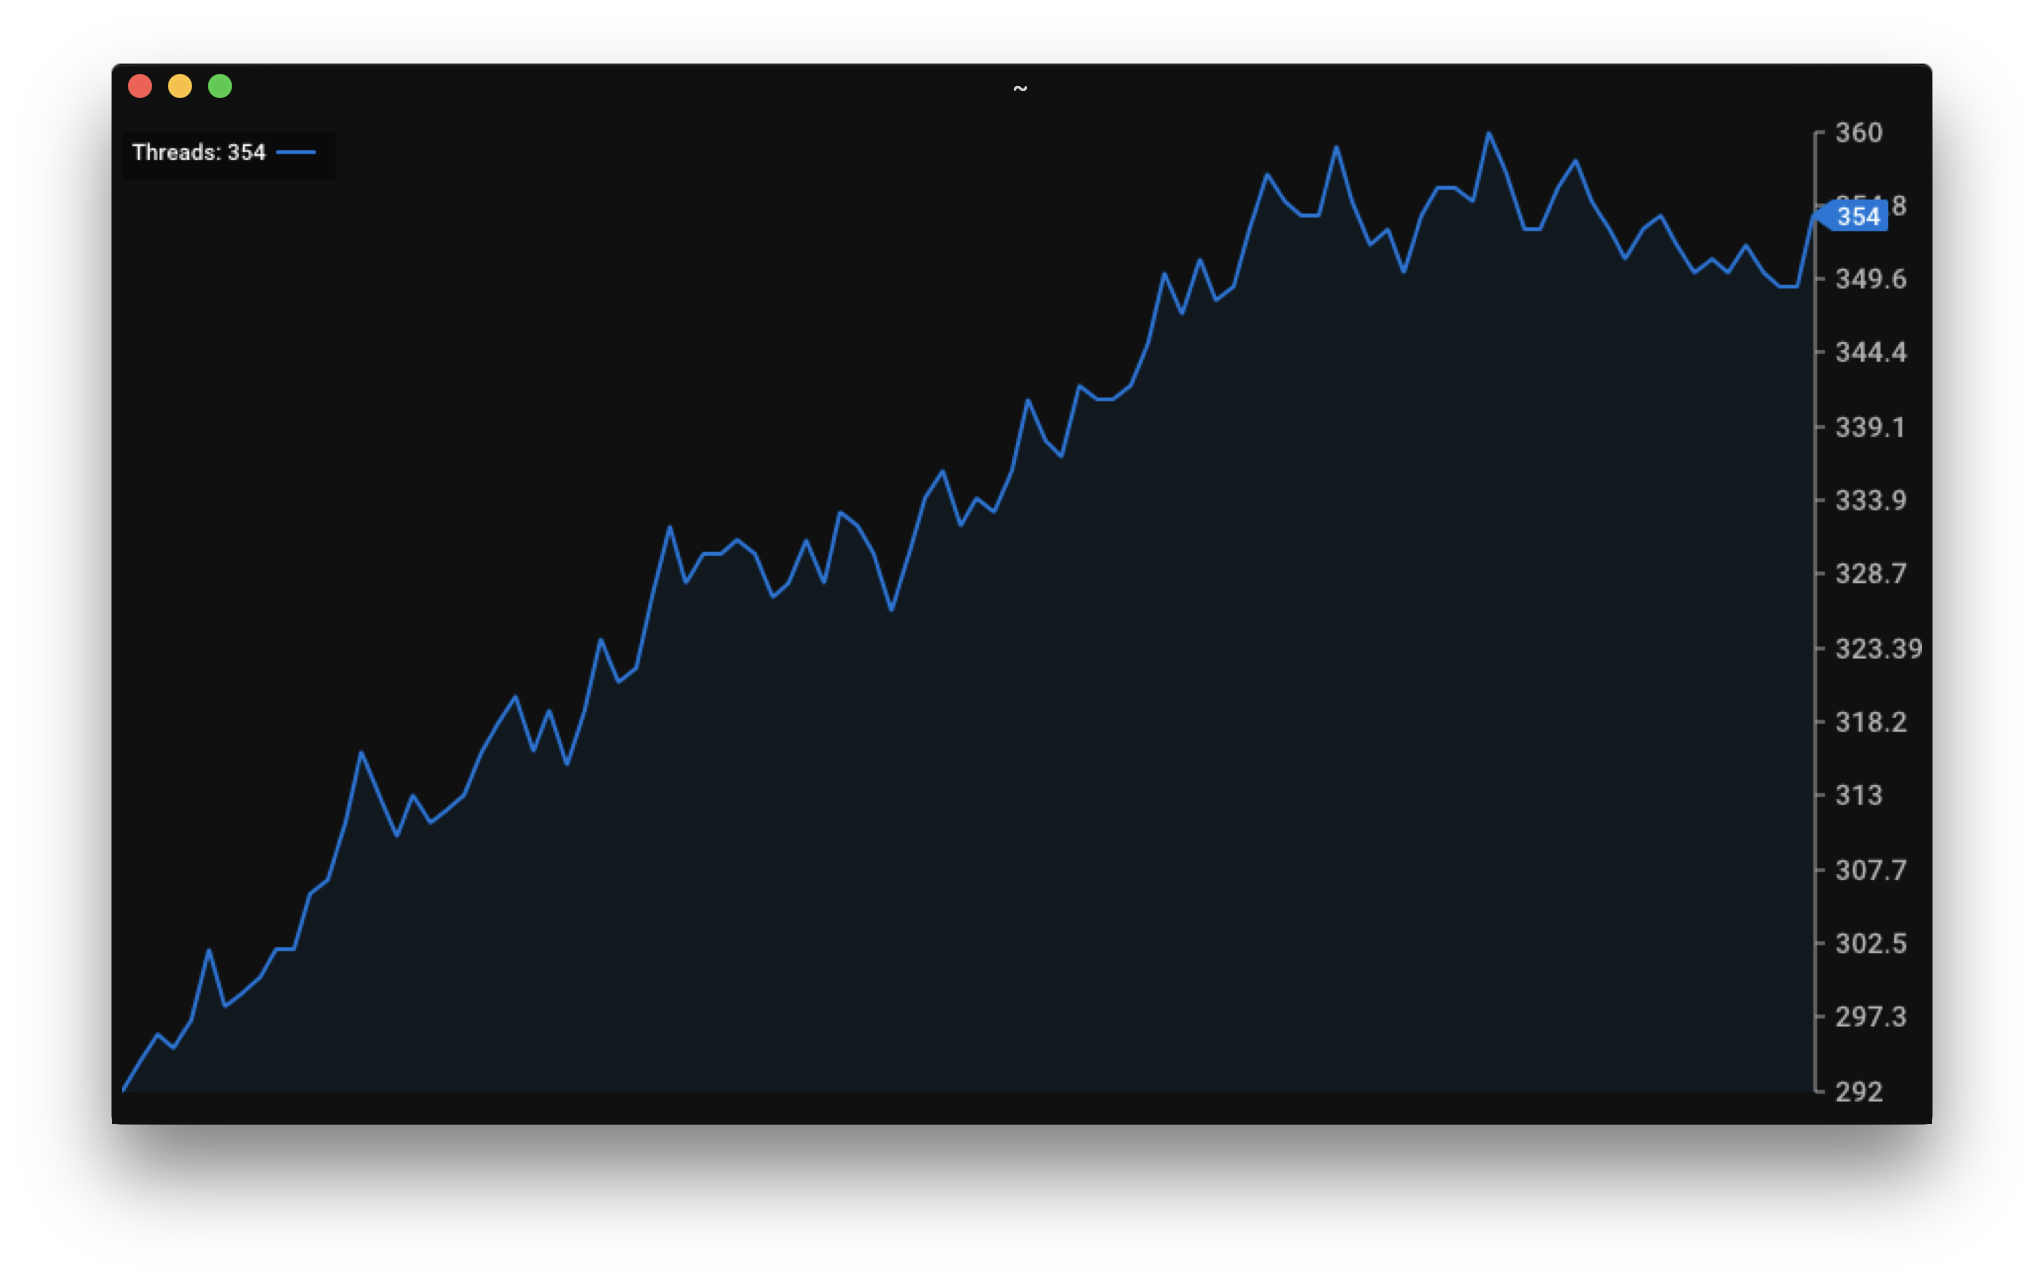
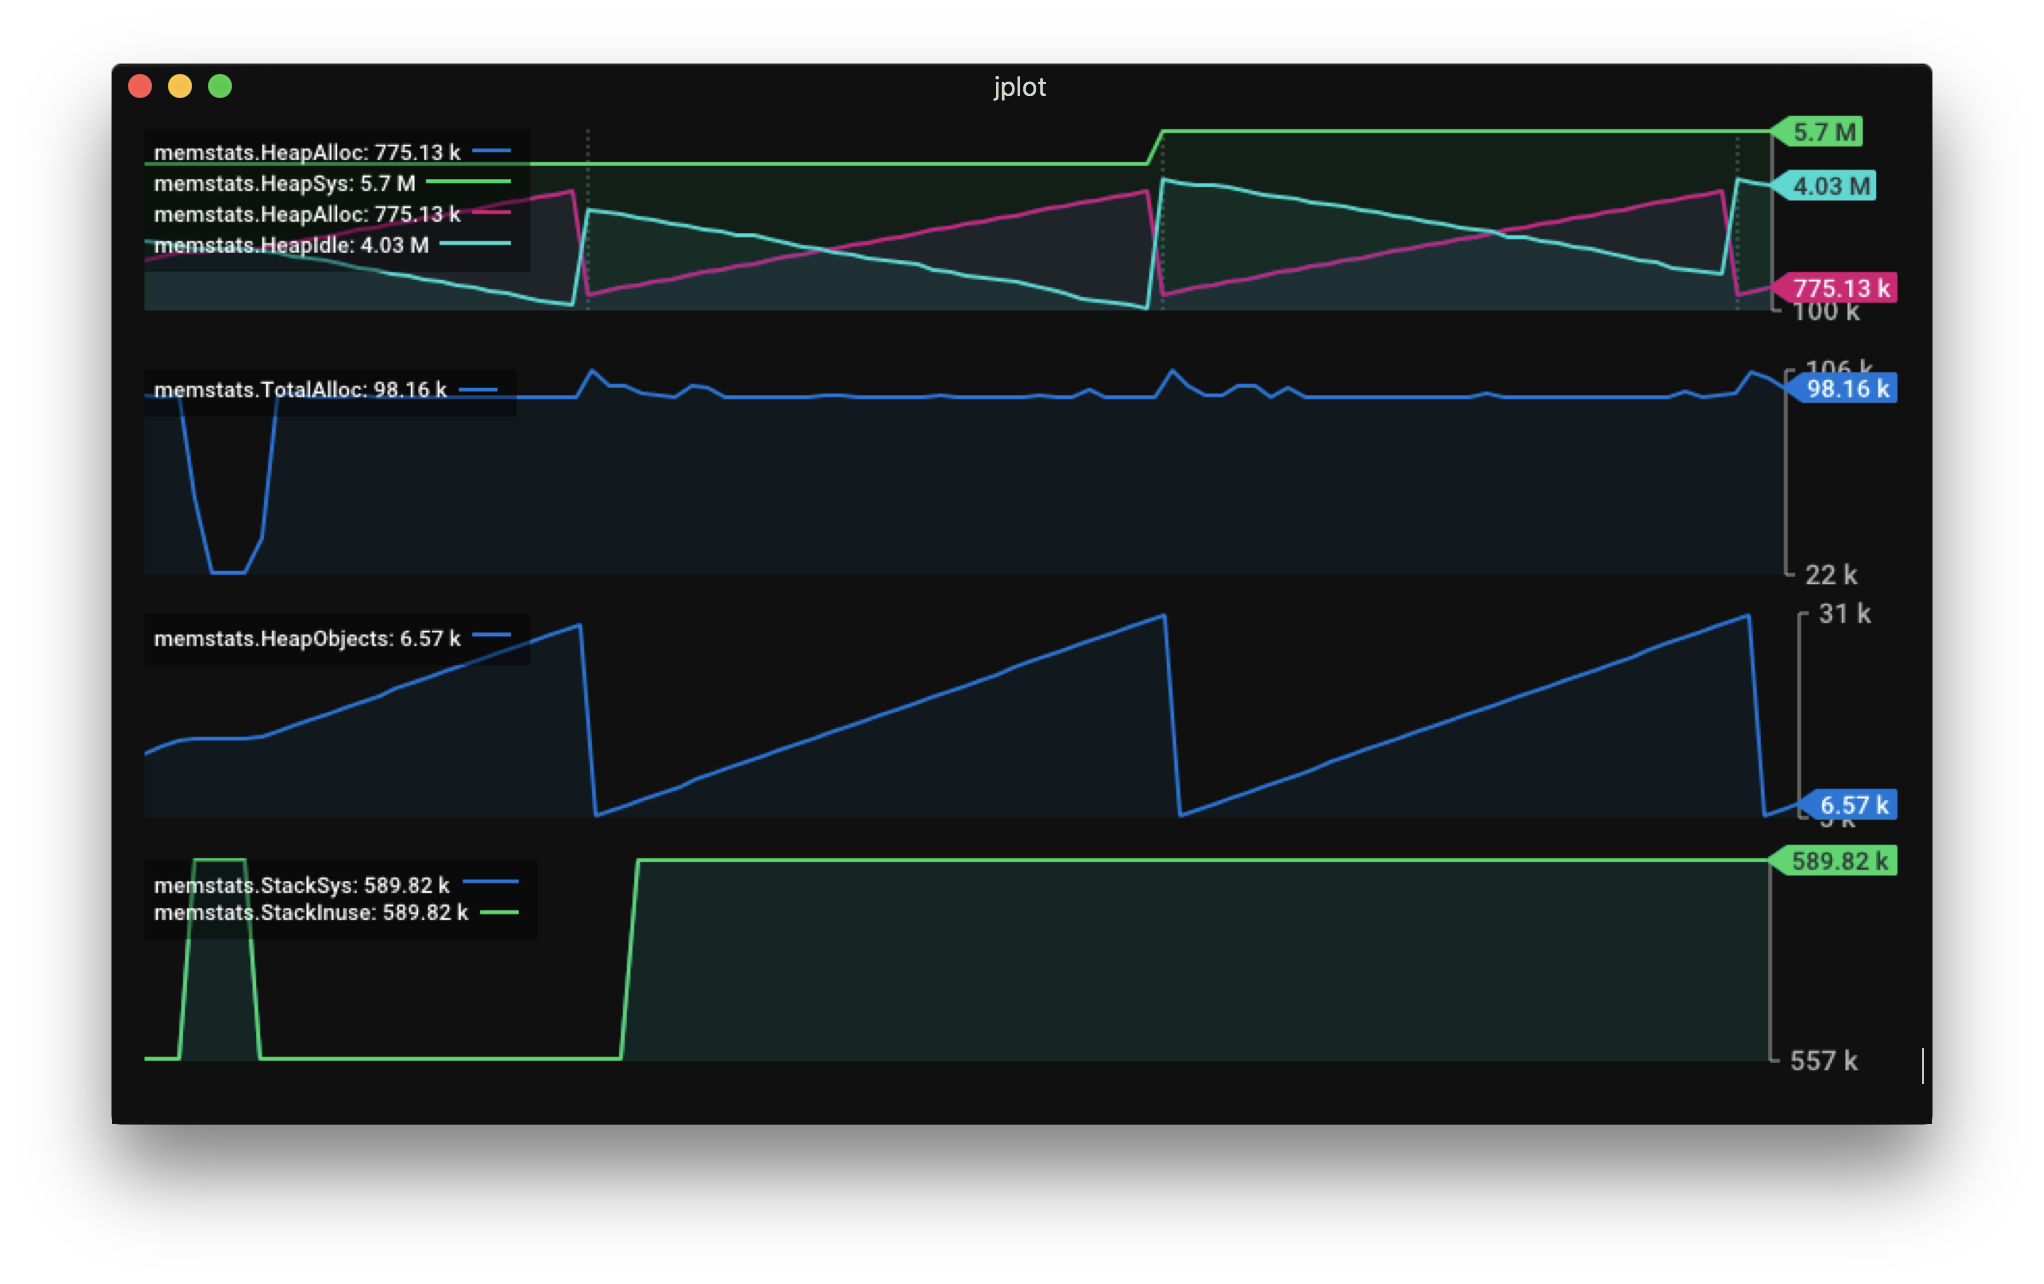
Jplot tracks expvar-like (JSON) metrics and plot their evolution over time right into your iTerm2 terminal (or DRCS Sixel Graphics).
Above capture is jplot monitoring a Go service's expvar:
jplot --url http://:8080/debug/vars \
    memstats.HeapSys+memstats.HeapAlloc+memstats.HeapIdle+marker,counter:memstats.NumGC \
    counter:memstats.TotalAlloc \
    memstats.HeapObjects \
    memstats.StackSys+memstats.StackInuse
By default, jplot uses the full size of the terminal, but it is possible to limit the render to a few rows:
Using homebrew:
brew install rs/tap/jplot
From source:
go install github.com/rs/jplot@latest
This tool does only work with iTerm2, or terminals support DRCS Sixel Graphics.
Given the following JSON output:
{
    "mem": {
        "Heap": 1234,
        "Sys": 4321,
        "Stack": 203
    },
    "cpu": {
        "STime": 123,
        "UTime":1234
    },
    "Threads": 2
}
You can graph the number of thread over time:
jplot --url http://:8080/debug/vars Threads
Or create a graph with both Utime and Stime growth rate on the same axis by using + between two field paths:
jplot --url http://:8080/debug/vars counter:cpu.STime+counter:cpu.UTime
Note: the counter: prefix instructs jplot to compute the difference between the values instead of showing their absolute value.
Or create several graphs by providing groups of fields as separate arguments; each argument creates a new graph:
jplot --url http://:8080/debug/vars mem.Heap+mem.Sys+mem.Stack counter:cpu.STime+cpu.UTime Threads
Each positional arguments given to jplot create a stacked graph with the specified values. To reference the values, use gojq JSON query syntax. Several value paths can be referenced for the same graph by using the + character to separate them.
In addition, each value path can be prefixed with options separated from the path by a column. Several options can be used for the same command by separating them with a comma like so: option1,option2:value.path.
Supported options are:
counter: Computes the difference with the last value. The value must increase monotonically.marker: When the value is none-zero, a vertical line is drawn.
Here is an example command to graph a Go program memstats:
jplot --url http://:8080/debug/vars \
    memstats.HeapSys+memstats.HeapAlloc+memstats.HeapIdle+marker,counter:memstats.NumGC \
    counter:memstats.TotalAlloc \
    memstats.HeapObjects \
    memstats.StackSys+memstats.StackInuse
With the help of jaggr can be used to integrate vegeta with jplot as follow:
echo 'GET http://localhost:8080' | \
    vegeta attack -rate 5000 -workers 100 -duration 10m | vegeta dump | \
    jaggr @count=rps \
          hist\[100,200,300,400,500\]:code \
          p25,p50,p95:latency \
          sum:bytes_in \
          sum:bytes_out | \
    jplot rps+code.hist.100+code.hist.200+code.hist.300+code.hist.400+code.hist.500 \
          latency.p95+latency.p50+latency.p25 \
          bytes_in.sum+bytes_out.sum


