Treco a.k.a Test Report Collector is a simple tool which parses junit formatted test reports and stores it in a database.
As junit report is a widely accepted format, reports from most of the testing frameworks can be pushed to treco.
Treco can run as a service or as a command line tool.
It is preferred to run it as a service so the report file can be sent to service over an http call
Treco is backed by Postgres DB, hence you will need an instance of PG running before Treco can be used.
Treco service needs DB credentials to start. DB credentials are read from the env variables. This gives flexbility to supply creds via secrets in K8s or from the Vault by mounting vault secrets onto the pod.
Make sure following env variables are provided, DB_HOST, DB_PORT, DB_NAME, DB_USER, DB_PASSWORD and DB_TYPE.
Note: For now tool only supports Postgres DB, so DB_TYPE must be postgres. Tool is designed in such a way that it can be easily extended to use different databases
To start the service, run ./treco serve
Environment variables can also be passed through a .env file. To read env from file start the treco with below command
./treco serve -c <path_to_env>
./treco serve --help
Runs as a web server

Usage:
  treco serve [flags]

Flags:
  -c, --config string   config file
  -h, --help            help for serve
  -p, --port int        port for server to run (default 8080)
Treco exposes a single endpoint /v1/publish/report which accepts multipart/form-data payload. Below is an example
curl --location 'http://localhost:8080/v1/publish/report' \
--form 'ci_job_id="12345"' \
--form 'environment="dev"' \
--form 'jira_project="Project"' \
--form 'service_name="service-1"' \
--form 'report_format="junit"' \
--form 'test_type="unit"' \
--form 'coverage="75.2"' \
--form 'report_file=@"/path/to/junit/xml/file"'
| Params | Description |
|---|---|
| ci_job_id | Job ID generated by the CI tool used |
| environment | Environment of test execution |
| jira_project | Name of the Jira Project against which traceability needs to be captured |
| service_name | Name of the microservice for which tests were executed |
| report_format | Must be junit for now. Tool can be extended to support other report formats |
| test_type | Must be one of unit, contract, integration or e2e |
| coverage | Sent of unit tests. Can be set to 0 for integration and end to end tests |
| report_file | Path of the actual junit report generated |
You can also run Treco as a cmd line tool after the tests are executed to push report to treco. Treco help command can provide all the arguments that needs to be passed via commandline
./treco collect --help
config file Runs as a command line tool

Usage:
  treco collect [flags]

Flags:
  -b, --build string         CI Build name or number to uniquely identify the Build
  -c, --coverage string      statement level code coverage
  -e, --environment string   Environment on which the Build is executed
  -f, --format string        report of report file
  -h, --help                 help for collect
  -j, --jira string          Jira project name
  -r, --report string        input file containing test reports
  -s, --service string       Service name
  -t, --type string          type of tests executed. 'unit', 'contract', 'integration' or 'e2e
Below steps can help you to get the whole setup running under 5 mins
Step 1: Start Postgres DB
docker run --network test_network --name postgres -e POSTGRES_PASSWORD=secret -e POSTGRES_DB=treco -d postgres
Step 2: Start Grafana
docker run -d -p 3000:3000 --network test_network --name=grafana --volume grafana-storage:/var/lib/grafana grafana/grafana-enterprise
Step 3: Configure Postgres DataStore in Grafana
With name Postgres and import all the dashboards from dashboards folder.
Note: Use the PG container's IP address to configure is Grafana as they would communicate ove the network.
Step 4: Start the service
./treco serve -c <path_to_env>
Step 5: Send curl command to service
Send your 1st report to service by running curl command as shown here
Now just refresh your dashboards and Voila! you can start visualising your data !!
Dashboards folder has few sample dashboards which can help you get started into viewing some important insights from your test results. These are only few of the dashboards but there is no limit on the dashboards you can build once you have captured the relevant data.
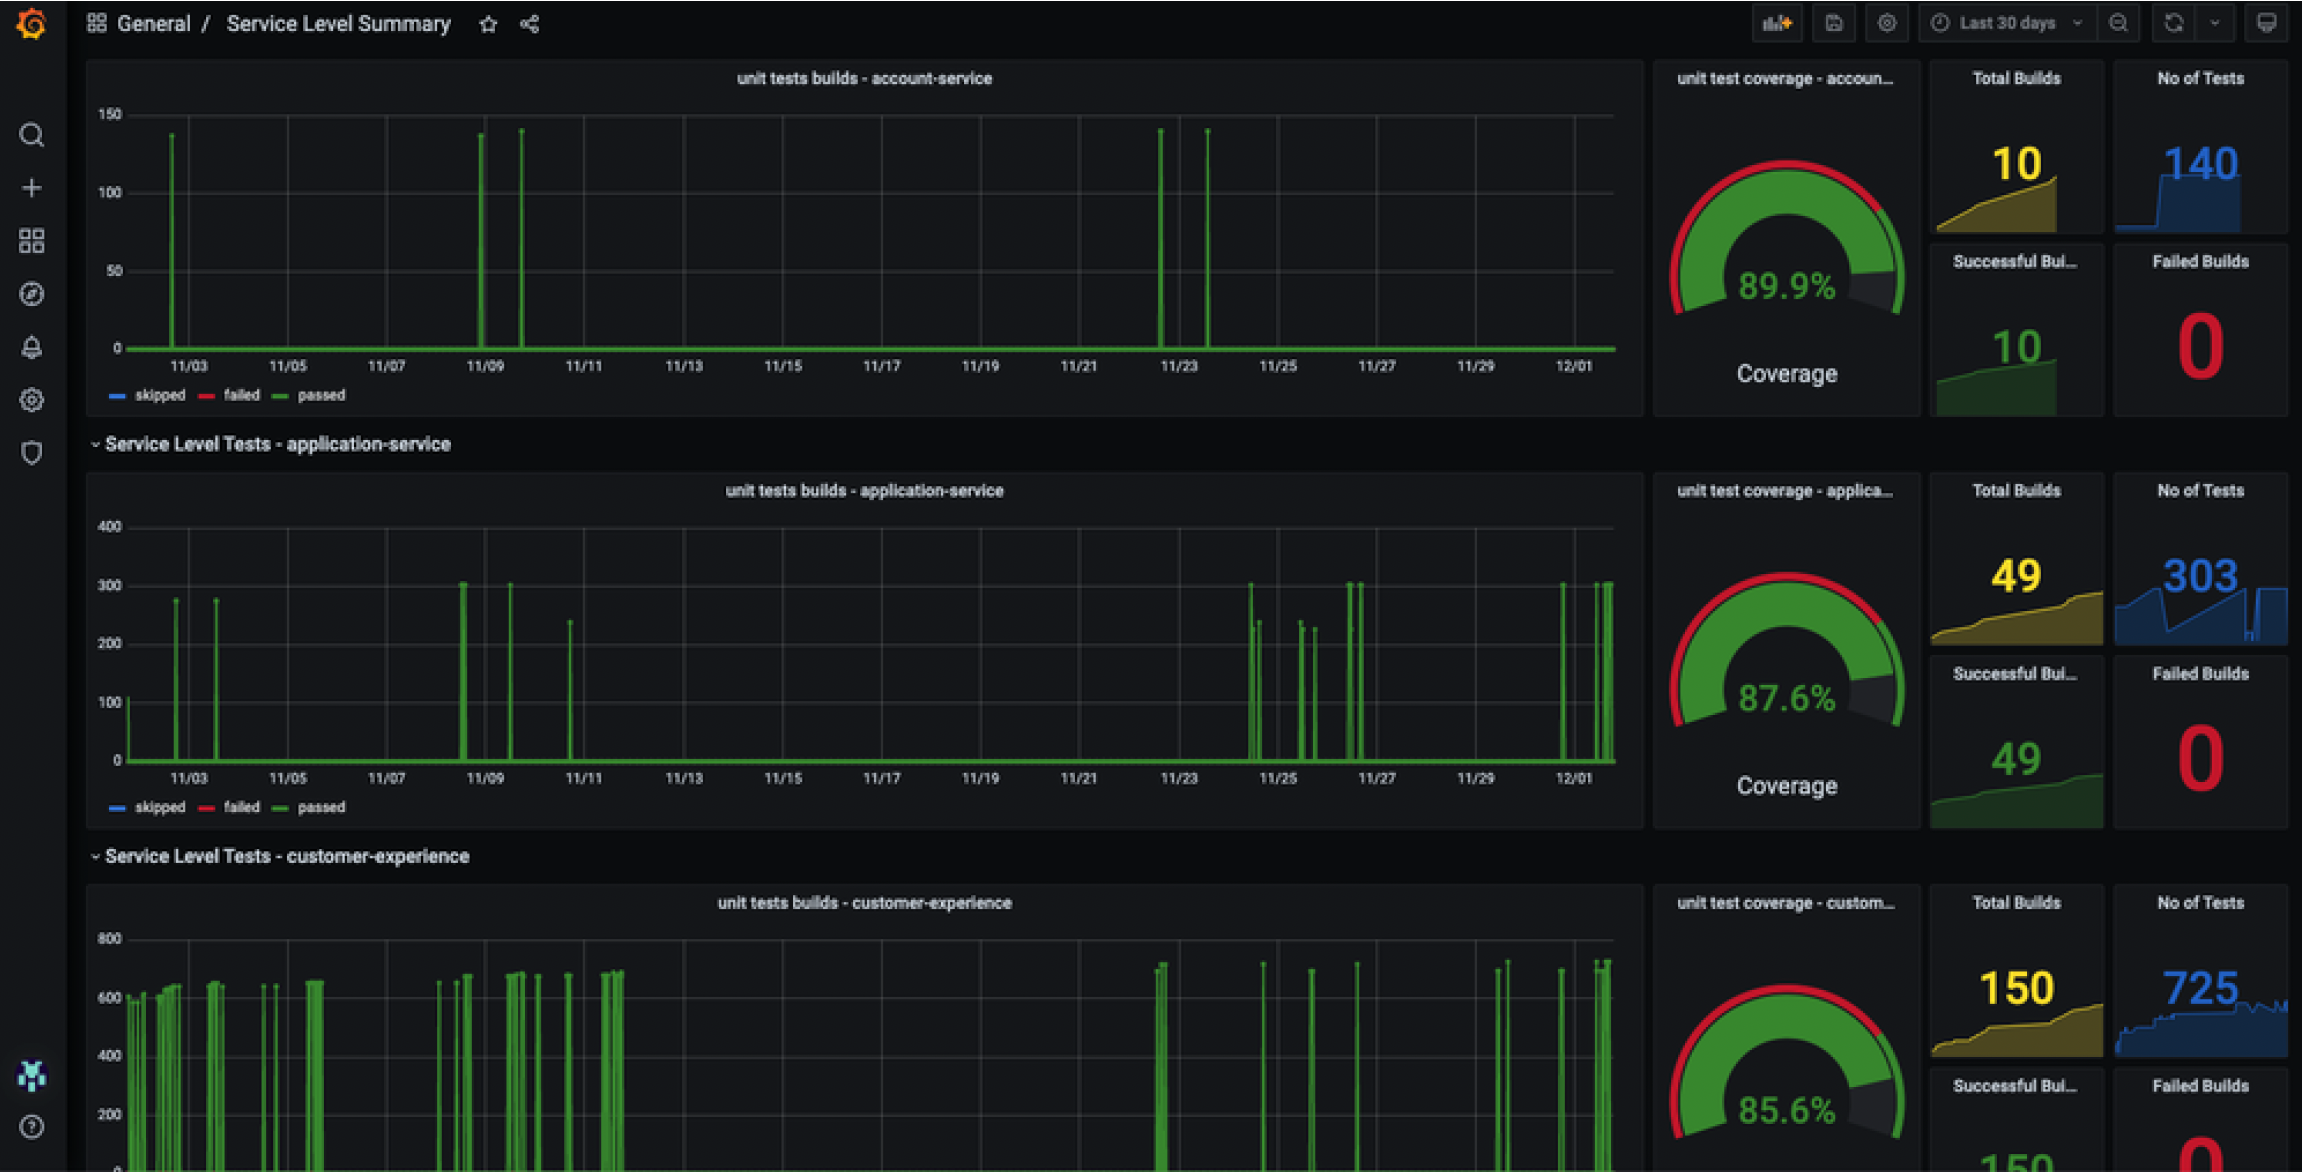
This dashboard is helpful to visualize unit test executions. It shows builds executed on a time series with current code coverage graph and test execution numbers
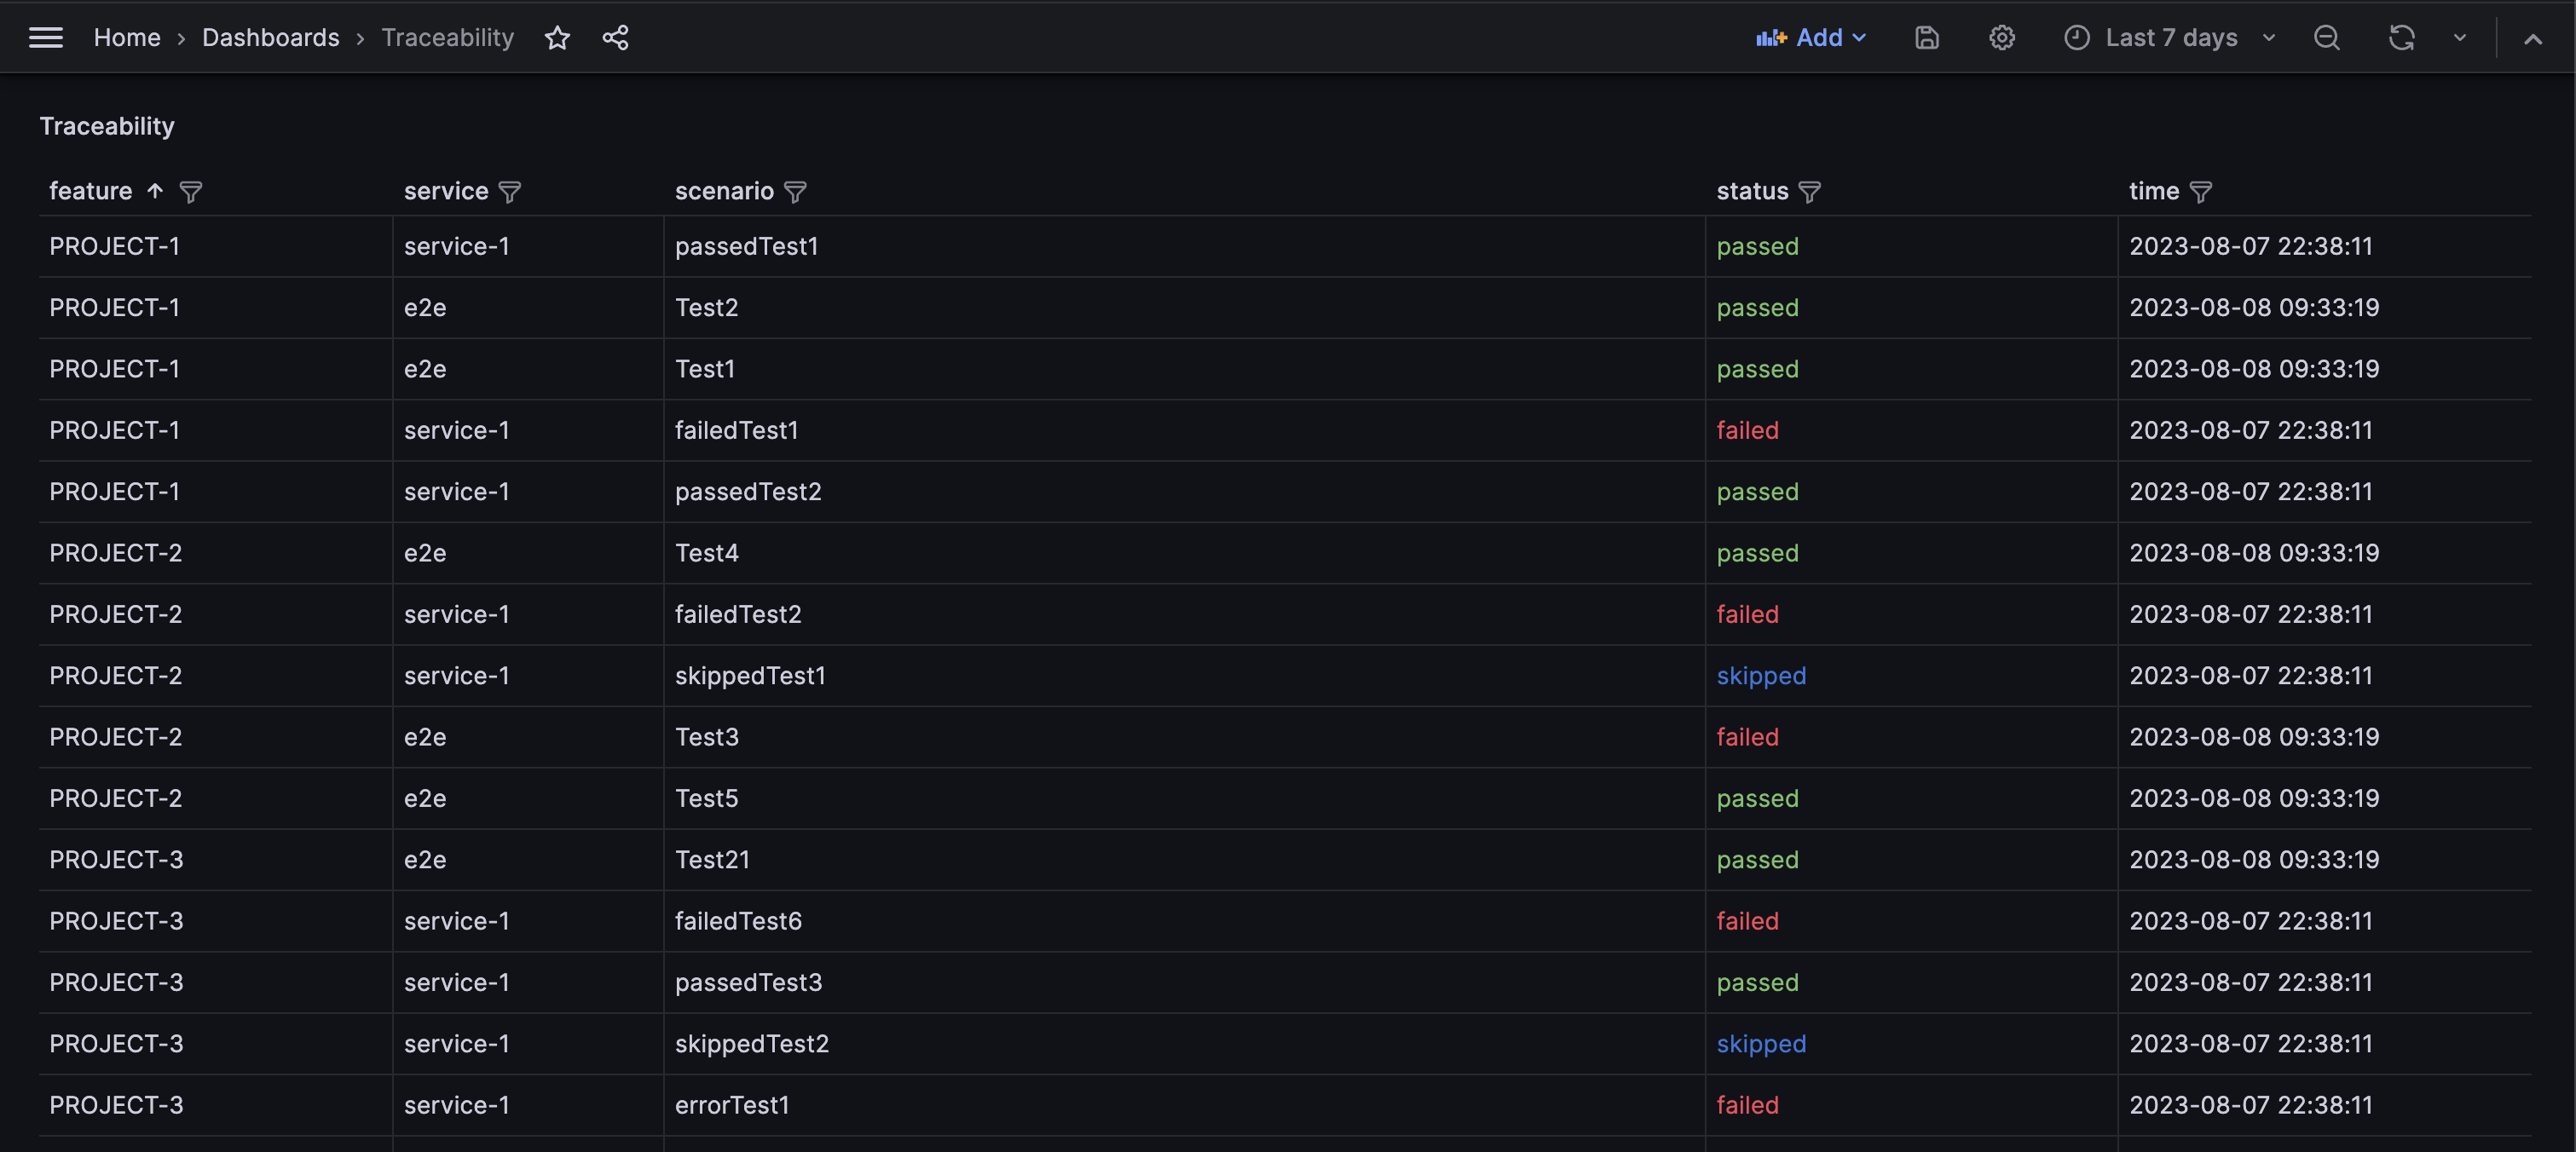
If your Junit report can have Features attribute embedded intp <test> tag, This will be captured as traceability. Status column is from the most recent execution of the test
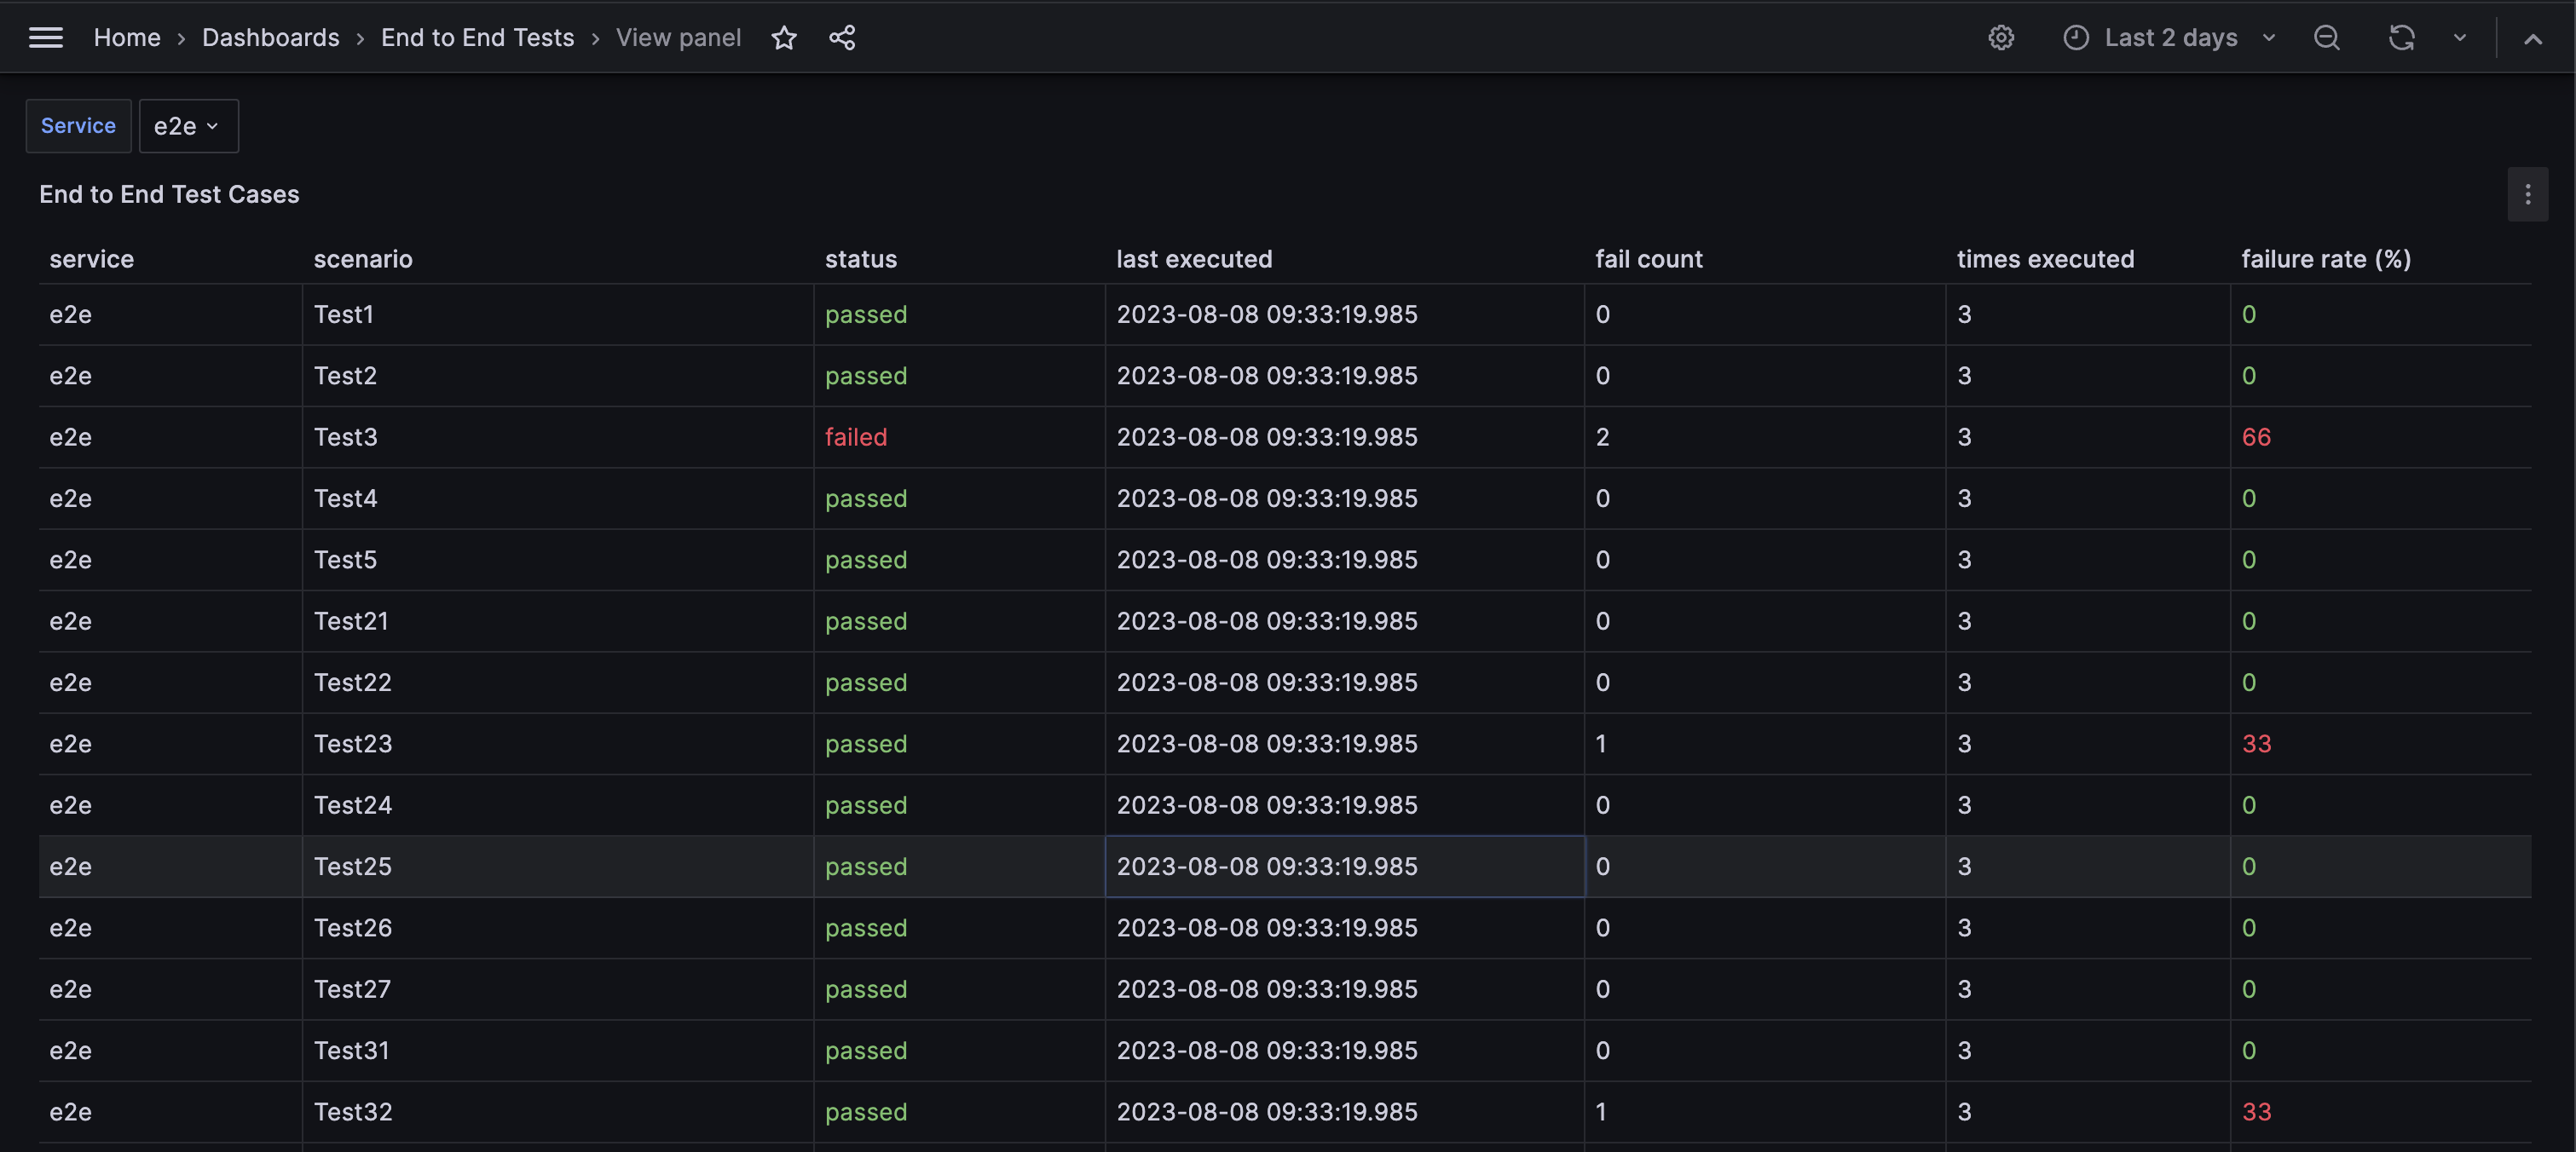
Failure rate is high in these tests and capturing test flakiness is an important metric. This dashboard helps to capture that
All builds is just a simple table with filters on it to search for builds as required


