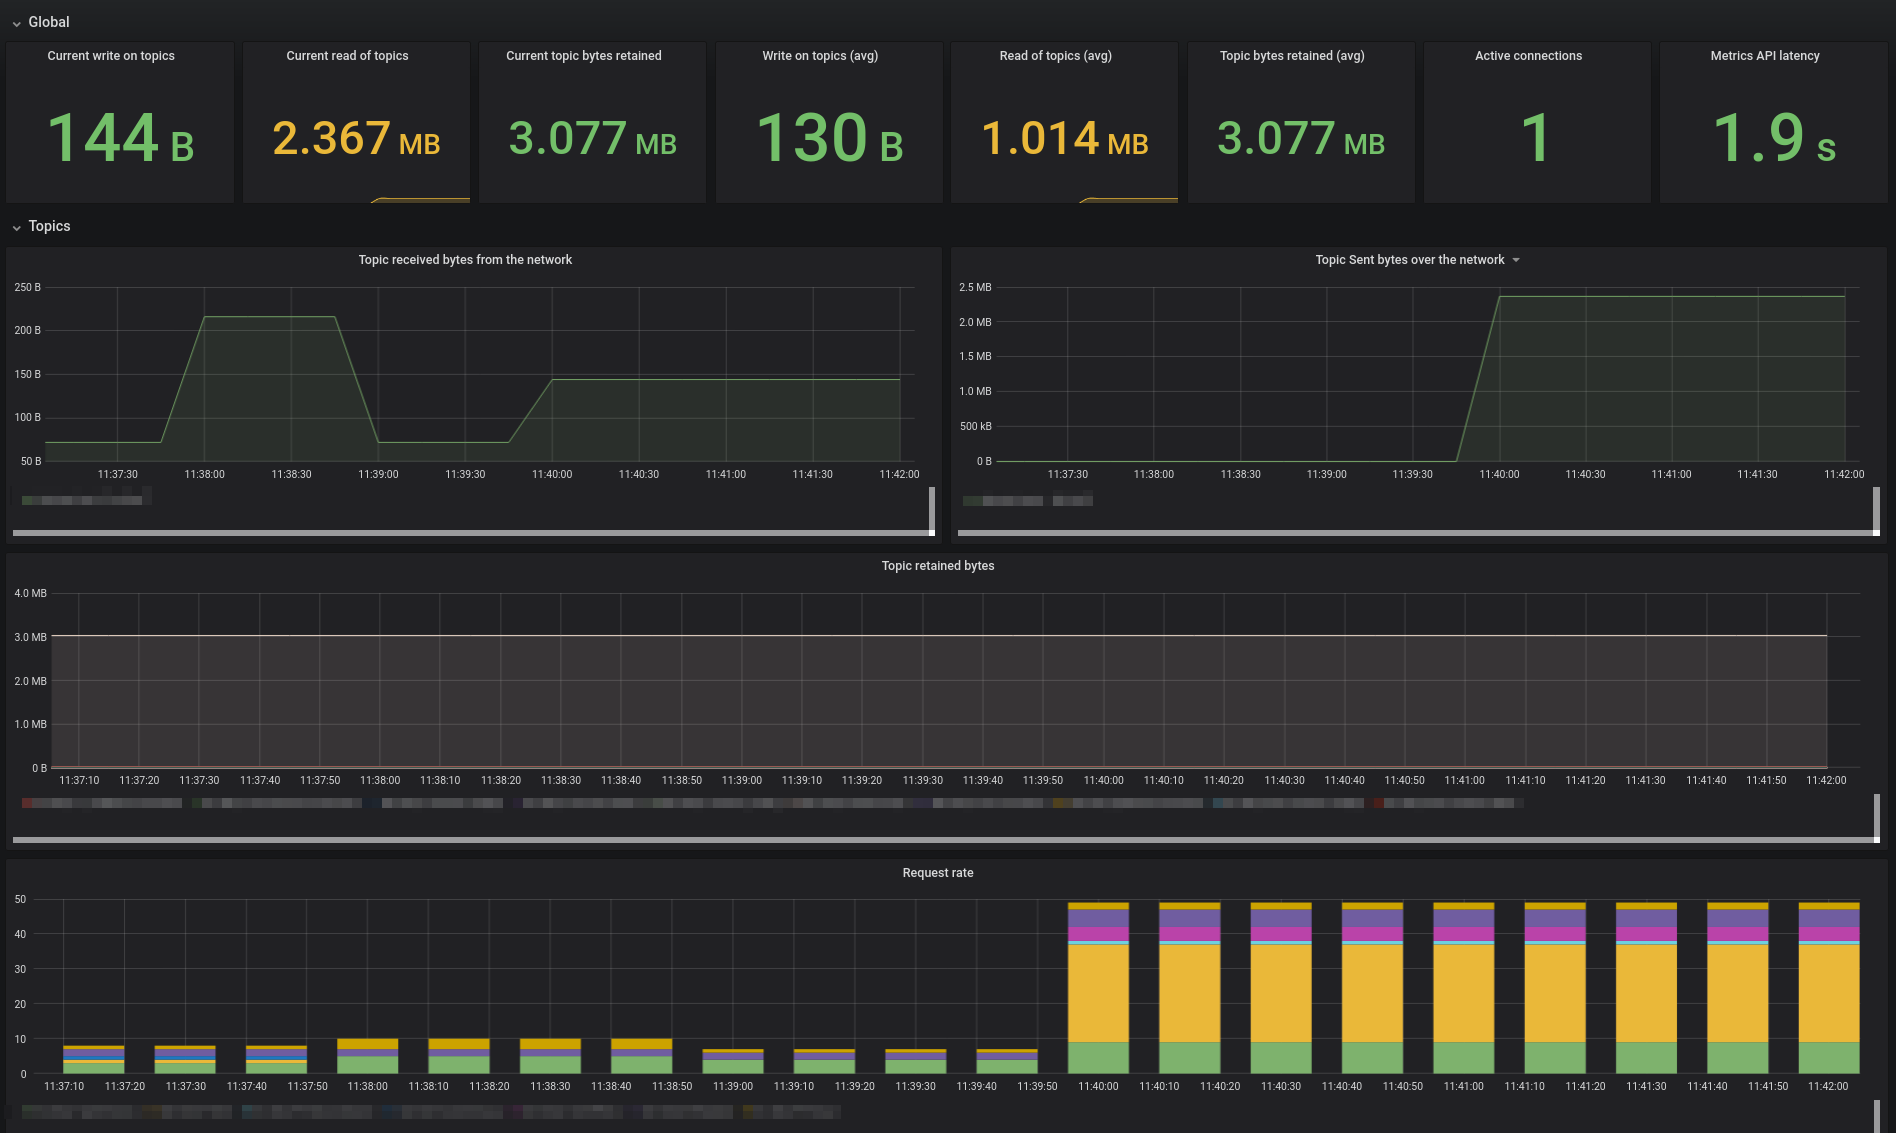
A simple prometheus exporter that can be used to extract metrics from Confluent Cloud Metric API. By default, the exporter will be exposing the metrics on port 2112 To use the exporter, the following environment variables need to be specified:
CCLOUD_USER: Your Confluent Cloud login, or the API Key created withccloud api-key create --resource cloudCCLOUD_PASSWORD: Your Confluent Cloud password, or the API Key Secret when created withccloud api-key create --resource cloud
CCLOUD_USER and CCLOUD_PASSWORD environment variables will be used to invoke the https://api.telemetry.confluent.cloud endpoint.
./ccloudexporter -cluster <cluster_id>
Usage of ./ccloudexporter:
  -cluster string
    	Cluster ID to fetch metric for. If not specified, the environment variable CCLOUD_CLUSTER will be used
  -config string
    	Path to configuration file used to override default behavior of ccloudexporter
  -delay int
    	Delay, in seconds, to fetch the metrics. By default set to 120, this, in order to avoid temporary data points. (default 120)
  -endpoint string
    	Base URL for the Metric API (default "https://api.telemetry.confluent.cloud/")
  -granularity string
    	Granularity for the metrics query, by default set to 1 minutes (default "PT1M")
  -listener string
    	Listener for the HTTP interface (default ":2112")
  -no-timestamp
    	Do not propagate the timestamp from the the metrics API to prometheus
  -timeout int
    	Timeout, in second, to use for all REST call with the Metric API (default 60)
  -version
    	Print the current version and exit
go get github.com/Dabz/ccloudexporter/cmd/ccloudexporter
go install github.com/Dabz/ccloudexporter/cmd/ccloudexporter
export [email protected]
export CCLOUD_PASSWORD=totopassword
./ccloudexporter -cluster lkc-abc123docker run \
-e CCLOUD_USER=$CCLOUD_USER \
-e CCLOUD_PASSWORD=$CCLOUD_PASSWORD
-e CCLOUD_CLUSTER=lkc-abc123
-p 2112:2112
dabz/ccloudexporter:latestexport [email protected]
export CCLOUD_PASSWORD=totopassword
export CCLOUD_CLUSTER=lkc-abc123
docker-compose up -dFor more advanced deployment, you could specify a YAML configuration file with the -config flag.
If you do not provide a configuration file, the exporter creates one from the provided flags.
| Key | Description | Default value |
|---|---|---|
| config.http.baseurl | Base URL for the Metric API | https://api.telemetry.confluent.cloud/ |
| config.http.timeout | Timeout, in second, to use for all REST call with the Metric API | 60 |
| config.listener | Listener for the HTTP interface | :2112 |
| config.noTimestamp | Do not propagate the timestamp from the metrics API to prometheus | false |
| config.delay | Delay, in seconds, to fetch the metrics. By default set to 120, this, in order to avoid temporary data points | 120 |
| config.granularity | Granularity for the metrics query, by default set to 1 minute | PT1M |
| rules | List of rules that need to be executed to fetch metrics |
| Key | Description |
|---|---|
| rules.clusters | List of clusters to fetch metrics from |
| rules.labels | Labels to exposed to Prometheus and group by in the query |
| rules.topics | Optional list of topics to filter the metrics |
| rules.metrics | List of metrics to gather |
- A simple configuration to fetch metrics for a cluster: simple.yaml
- A configuration to fetch metrics at the partition granularity for a few topics: partition.yaml
config:
  http:
    baseurl: https://api.telemetry.confluent.cloud/
    timeout: 60
  listener: 0.0.0.0:2112
  noTimestamp: false
  delay: 60
  granularity: PT1M
rules:
  - clusters:
      - $CCLOUD_CLUSTER
    metrics:
      - io.confluent.kafka.server/received_bytes
      - io.confluent.kafka.server/sent_bytes
      - io.confluent.kafka.server/received_records
      - io.confluent.kafka.server/sent_records
      - io.confluent.kafka.server/retained_bytes
      - io.confluent.kafka.server/active_connection_count
      - io.confluent.kafka.server/request_count
      - io.confluent.kafka.server/partition_count
    labels:
      - cluster_id
      - topic
- typeIn order to avoid reaching the limit of 1,000 points set by the Confluent Cloud Metrics API, the following soft limits has been established in the exporter:
- In order to group by partition, you need to specify one or multiple topics
- You cannot specify more than 100 topics in a single rule
clusters,labelsandmetricsare required in each rule
go get github.com/Dabz/ccloudexporter/cmd/ccloudexporter
A Grafana dashboard is provided in ./grafana/ folder.
