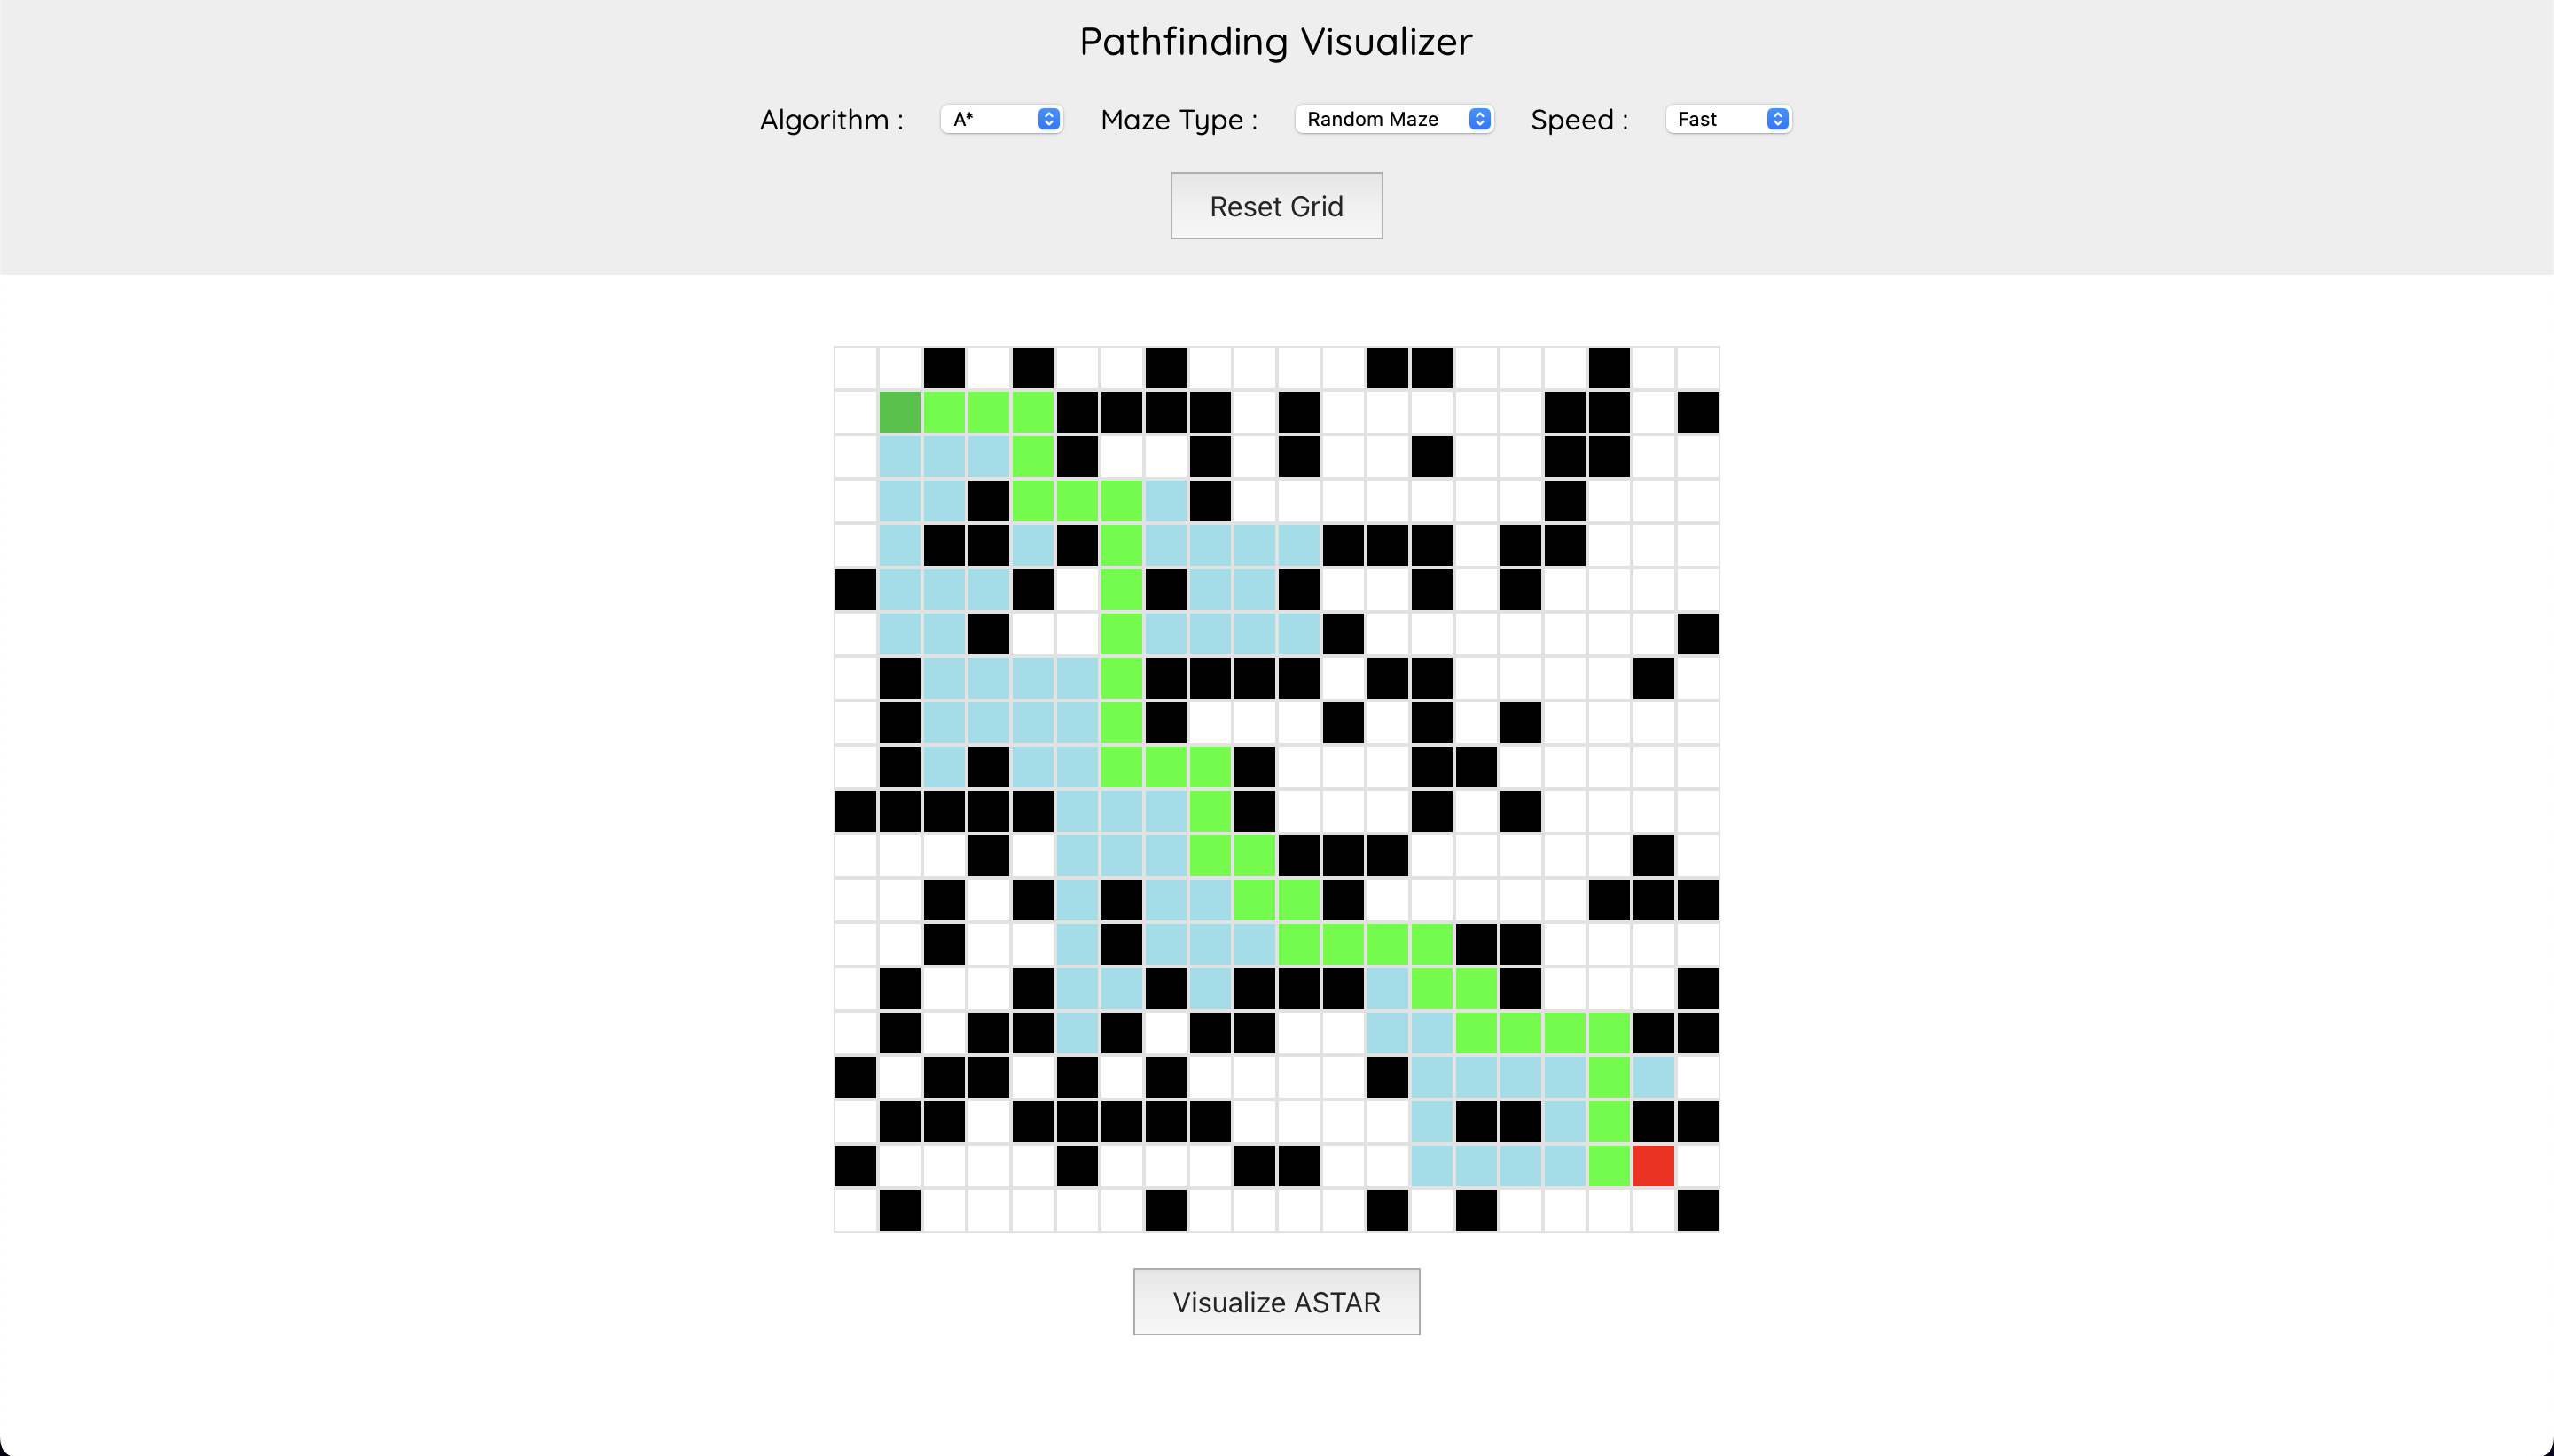
Pathfinding Visualizer is a web application built with React that allows users to visualize different pathfinding algorithms on a grid. The application supports wall drawing, maze generation, and algorithm visualization with adjustable speeds.
Click here to view the live project.
-
Pathfinding Algorithms: Visualize the following algorithms:
- Dijkstra
- Breadth-First Search (BFS)
- Depth-First Search (DFS)
- A*
-
Maze Generation: Generate mazes with different types:
- None
- Random Maze
- Recursive Maze
-
Speed Control: Adjust the speed of the visualization:
- Fast
- Medium
- Slow
-
Wall Drawing: Draw and remove walls to create obstacles for the algorithms.
Follow these instructions to get a copy of the project up and running on your local machine for development and testing purposes.
Ensure you have the following installed:
- Node.js
- npm (Node Package Manager)
-
Clone the repository:
git clone https://github.com/dan10ish/pathfinding-visualizer.git
-
Navigate to the project directory:
cd pathfinding-visualizer -
Install the dependencies
npm install
Start the development server:
npm startOpen your browser and navigate to http://localhost:3000 to see the application in action.
- Select Algorithm: Choose a pathfinding algorithm from the dropdown menu.
- Select Maze Type: Choose a maze type to generate a maze on the grid.
- Select Speed: Adjust the visualization speed.
- Draw Walls: Click on the grid cells to draw or remove walls.
- Visualize: Click the “Visualize” button to start the algorithm visualization.
